

Abstract
Objectives
Characterize radiographic worsening in knee osteoarthritis (KOA) by race and sex over four years and evaluate the role of established risk factors in observed race/sex differences
Methods
Whites (WHs) (694 males, 929 females) and African-Americans (AAs) (92 males, 167 females) at risk for radiographic KOA were eligible. Cox shared frailty models were used to estimate race and sex group differences in radiographic worsening, defined by Kellgren-Lawrence (K-L) and OARSI joint space narrowing (JSN). Mixed effect models for repeated measures were used to estimate race- and sex-specific mean medial and lateral fixed joint space width (fJSW) over four years of follow-up, as well as annual loss of fJSW.
Results
Risk of OARSI medial JSN grade worsening was higher among AA males than WH females (HR 2.28, [95% CI: 1.14–4.57]), though adjustment for KOA risk factors attenuated the association. Compared to WH females, WH males had lower risk of K-L grade worsening (adjusted HR 0.75 [95% CI: 0.58–0.96]). Mean baseline medial fJSW (mm) was 6.49 in WH and AA males, 5.42 in WH females, and 5.41 in AA females. Annual change in mean medial fJSW was greater in AA males (−0.19 mm/year) than in other subgroups (−0.09 WH males, −0.07 WH females, −0.10 AA females, p<0.0001). Compared to WHs, AAs had less lateral fJSW at baseline and throughout follow-up.
Conclusions
Compared to WHs and AA females, AA males experienced higher risk of medial joint space loss. Controlling for established risk factors attenuated associations between race/sex and disease worsening, suggesting that risk factors such as obesity, history of knee injury, and bony finger joint enlargements largely explain race/sex variations in rates of KOA development and progression.
Keywords: knee osteoarthritis, race, sex, x-rays, radiography, disease worsening
INTRODUCTION
The prevalence of symptomatic KOA is significantly higher in African Americans (AAs) than in Whites (WHs) [1–3]. According to a national survey, the prevalence of activity limitation, work limitation and severe joint pain are also significantly higher among AAs than among WHs [4]. Other studies on racial disparities in self-reported pain and function due to KOA have also shown that racial/ethnic minority status is associated with greater severity of osteoarthritis (OA)-related symptoms [5, 6]. In addition, females, in comparison to males, have greater prevalence and incidence of OA at all ages, especially KOA [7–9]. They are also more likely to be burdened by OA and have higher rates of disability due to OA than males [10, 11].
Moreover, AAs have greater prevalence of radiographic KOA based on the Kellgren-Lawrence (K-L) grading system compared to WHs [2, 3]. After controlling for demographic and clinical factors, AA females have greater odds of radiographic KOA than WH females [12, 13]. In one study, racial differences in K-L based radiographic KOA persisted in males, but not in females, even after adjustment for demographic and clinical variables [14]. There is also evidence that AAs with KOA are more likely than their WH counterparts to have osteophytes, sclerosis, and joint space narrowing (JSN) in the lateral but not the medial compartment of the tibiofemoral joint [14]. These studies of race and sex differences in KOA [2, 3, 12–14] are all cross-sectional in nature, however. Race and sex differences in radiographic KOA development and progression are not well-characterized.
Traditionally, KOA structural change has been assessed using radiographs. Both K-L and Osteoarthritis Research Society International (OARSI) classification systems are widely used and provide semi-quantitative assessments of the extent of KOA. Each grading system has limitations, however. The K-L scale is a subjective ordinal score, and use of K-L progression as a measure of disease worsening is osteophyte-driven in early OA and may not be optimal [15]. Further, the ordinal nature of the OARSI classification system may not be sensitive enough to detect subtle changes in joint space over time. Quantitative JSW at fixed locations along the tibiofemoral joint interface was developed as an objective and sensitive radiographic outcome measure [16]. The quantitative fixed JSW (fJSW) measure has been shown to correlate with OA clinical outcomes, with detection of KOA progression and predictive performance for future knee replacement, comparable to that of magnetic resonance imaging (MRI) [17–19].
Our primary objective was to characterize radiographic tibiofemoral KOA longitudinally by race and sex, based on traditional grading schemes as well as annual quantitative measures of JSW. Our secondary objective was to identify race and sex-specific constellations of known risk factors and evaluate their role in KOA development and progression. We hypothesized that among all race and sex groups, AA males were most likely to have radiographic KOA worsening in all measures. We also hypothesized that adjusting for risk factors for KOA progression would attenuate the observed race and sex differences.
METHODS
Participants
The Osteoarthritis Initiative (OAI) is a multi-center, longitudinal, prospective observational study, with publically available detailed protocols and data releases (https://oai.epi-ucsf.org/datarelease/StudyOverview.asp). Individuals with or at risk for symptomatic KOA, ages 45–79, were recruited from four clinical centers and followed with comprehensive annual clinic visits over nine years. The institutional review boards at each of the recruitment sites approved the study, and all participants gave informed consent. Individuals at risk for symptomatic knee OA were eligible for OAI participation based on the presence of specific risk factors. The current study included AA and WH participants with minimal or no radiographic KOA at baseline, defined by baseline K-L grade of 0 or 1 in one or both knees (n=1,882 participants, 3,764 knees). Other racial and ethnic groups were not sufficiently represented to facilitate race and sex-stratified analyses and were excluded from the study. Availability of JSW measurements were limited after the 48 month OAI visit, and a disproportionate number of AAs were lost to follow-up after the 48 month OAI visit. Hence, we were able to evaluate racial differences in radiographic KOA measures using only 4 years of follow-up data.
Radiographic Outcomes: Semi-Quantitative & Quantitative Assessment
Knee radiographs were standardized according to a fixed flexion protocol (http://oai.epi-ucsf.org/datarelease/operationsManuals/RadiographicManual.pdf) using a SynaFlexer frame (Synarc, San Francisco, California). The protocol was used to reproducibly position knees in a 20° flexed position and to equally distribute body weight while the radiograph beam was angled caudally at 10° [20, 21]. This approach was chosen to optimally capture the tibiofemoral joint space [22, 23]. Serial bilateral posteroanterior (PA) radiographs were obtained at baseline and all clinic visits.
Baseline and follow-up radiographs were assessed using the K-L and OARSI classification systems to score the extent of KOA. With the K-L classification system, osteophytes define onset of OA, with possible JSN. As OA progresses, it incorporates distinct constructs, including osteophytes, JSN, subchondral sclerosis, subchondral bone shape changes, and cysts into a single scale. In this system (range: 0–4), grade 0 was normal while 4 indicated large osteophytes, marked narrowing of joint space, severe sclerosis and definite deformity of bone ends [24]. In contrast, the OARSI classification system grades specific phenotypes individually, for instance, the extent of JSN in the medial and lateral compartments of the tibiofemoral joint [25, 26]. JSN based on an ordinal subjective scoring of joint space width (JSW) is significantly associated with joint pain and utilization of joint replacement [27, 28]. In this system (range: 0–3), grade 0 was normal, 1 indicated mild narrowing (1–33%), 2 indicated moderate narrowing (34–66%), and 3 indicated severe narrowing (67–100%) [25, 26].
Radiographs were centrally read by two expert readers (rheumatologist or musculoskeletal radiologist) who assessed each x-ray, blinded to each other’s reading and to clinical data. Discrepancies in scoring both K-L and OARSI grades between readers were adjudicated in a consensus session involving a third reader [20]. The same experienced readers used this protocol to score radiographic KOA severity in other longitudinal studies [20, 29, 30]. Radiographic worsening based on these semi-quantitative scores was defined as any increase in grade.
Fixed location joint space width (fJSW) was measured in a subset of knees (896 participants, 1,519 knees), including those with follow-up x-rays at any time point up to the 48-month visit with radiographic KOA, along with a large number of knees without radiographic KOA. Medial and lateral fJSW was measured using an automated software that relies on a coordinate system based on anatomical landmarks [31, 32]. The distance between the femur and tibia was measured at fixed intervals along the tibiofemoral joint, denoted as JSW(x) [18]. For the current study, JSW at x=0.250 was used to assess the medial compartment, and JSW at x=0.725 was used to assess the lateral compartment [18].
Risk factors for KOA
Race and sex, as well as age, family history of knee replacement surgery, history of knee injury, history of knee surgery or arthroscopy, and frequent knee bending were self-reported at baseline. Participants who performed ≥1 frequent knee-bending activities (kneeling for ≥30 min, squatting for ≥30 min/getting in and out of a squatting position ≥10 times, climbing ≥10 flights of stairs, or lifting/moving objects weighing ≥25 pounds) most days during the previous 30 days were classified as frequent knee-benders [33]. A trained examiner evaluated presence of bony enlargement of the distal interphalangeal joints (DIPs) in both hands (i.e., Heberden’s nodes). Body mass index (BMI) was calculated, and participants were categorized based on World Health Organization criteria. These established risk factors for KOA that comprised OAI eligibility criteria may differ across race and sex groups, potentially act as mediators of KOA worsening and provide potential explanations for race and sex differences [34, 35].
Statistical methods
Clinical characteristics previously established as risk factors for KOA were used to describe the sample at baseline, by race and sex group (WH male, WH female, AA male, and AA female). Baseline radiographic severity was also summarized by K-L grade, OARSI medial and lateral JSN, and fJSW. Participant-level comparisons were conducted using ANOVA and Chi-square statistic for continuous and categorical variables, respectively.
Semi-quantitative data analysis
Cox shared frailty models were used to estimate race and sex group differences in radiographic worsening, defined by any increase in K-L grade, and JSN worsening (defined by any increase in OARSI grade) in the medial and lateral compartments, for time to first annual visit with radiographic worsening [36]. Frailty was incorporated to account for correlation between knees within a participant. WH female was used as the referent race/sex group, as the group is most likely to have low K-L grade scores and least likely to have significant JSN based on previous cross-sectional studies [14, 37].
Quantitative data analysis
Mixed effect models were used to estimate race- and sex-specific mean and 95% confidence interval (CI) for JSW at fixed locations in the medial (x=0.250) and lateral (x=0.725) compartments, to account for correlation between knees within a participant and repeated measurements of the same knee over follow-up. Annual change in mean medial and lateral fJSW loss was also estimated for each race and sex group and compared using the Wald test. As a sensitivity analysis, alternative locations were also used to estimate mean fJSW in both medial (x=0.275) and lateral (x=0.750) compartments.
Mixed effect models and Cox shared frailty models were adjusted for age, BMI, family history of joint replacement, any bony enlargement of the DIPs, frequent knee-bending, and history of knee injury, surgery or arthroscopy to assess potential race and sex differences in worsening not explained by these risk factors.
RESULTS
Initially, 4796 participants enrolled in the OAI. For the current study, participants were excluded primarily due to missing baseline K-L grade score or for radiographic KOA (K-L grade ≥2) in at least one knee (Supplement 1). A total of 694 WH males, 929 WH females, 92 AA males, and 167 AA females were included in the analysis. Baseline description of participant clinical characteristics revealed differences in race and sex group risk factor profiles (Table 1). AA participants, in comparison to WH participants, were more often obese. WH males more often reported a history of knee injury (27.3% WH males vs. 18.7% all others) and knee surgery or arthroscopy (9.9% WH males vs. 3.5% all others). WH participants, particularly females, had a higher prevalence of bony enlargements of the DIPs (66.7% WH females vs. 48.0% all others).
Table 1.
Baseline characteristics by race and sex
| Characteristic | White Male | White Female | African American Male | African American Female | p-value* |
|---|---|---|---|---|---|
| Participant-level | |||||
| (n=694) | (n=929) | (n=92) | (n=167) | ||
|
|
|||||
| Age, mean(sd) | 59.1 (9.2) | 60.1 (9.1) | 57.0 (9.0) | 56.8 (7.9) | <0.0001 |
| BMI, mean(sd) | 27.9 (4.0) | 26.3 (4.5) | 29.0 (4.3) | 29.2 (5.0) | <0.0001 |
| Normal | 183 (26.4) | 403 (43.4) | 17 (18.5) | 35 (21.0) | <0.0001 |
| Overweight | 318 (45.8) | 332 (35.7) | 35 (38.0) | 65 (38.9) | |
| Obese | 193 (27.8) | 194 (20.9) | 40 (43.5) | 67 (40.1) | |
| Family history of knee replacement surgery | 111 (16.3) | 139 (15.1) | 11 (12.2) | 21 (12.8) | 0.5839 |
| Any bony enlargement of the DIPs | 363 (53.9) | 609 (66.6) | 43 (47.3) | 53 (32.3) | <0.0001 |
| Frequent knee bending | 507 (73.6) | 646 (69.8) | 71 (77.2) | 128 (77.1) | 0.0954 |
|
|
|||||
| Knee-level | |||||
| (n=1388) | (n=1858) | (n=184) | (n=334) | ||
|
|
|||||
| History of knee injury | 372 (27.3) | 347 (18.8) | 39 (21.4) | 55 (16.5) | <0.0001 |
| History of knee surgery or arthroscopy | 137 (9.9) | 66 (3.6) | 9 (4.9) | 7 (2.1) | <0.0001 |
| KL grade | 0.4891 | ||||
| 0 | 1035 (74.6) | 1378 (74.2) | 145 (78.8) | 239 (71.6) | |
| 1 | 353 (25.4) | 480 (25.8) | 39 (21.2) | 95 (28.4) | |
| Joint Space Narrowing - medial compartment | 0.0167 | ||||
| Normal (OARSI grade 0) | 1228 (88.5) | 1666 (89.7) | 174 (94.6) | 311 (93.1) | |
| Narrowed (OARSI grade 1–2) | 160 (11.5) | 192 (10.3) | 10 (5.4) | 23 (6.9) | |
| Joint Space Narrowing - lateral compartment | 0.4852 | ||||
| Normal (OARSI grade 0) | 1375 (99.1) | 1832 (98.6) | 183 (99.5) | 331 (99.1) | |
| Narrowed (OARSI grade 1–2) | 13 (0.9) | 26 (1.4) | 1 (0.5) | 3 (0.9) | |
| fJSW - medial compartment (x=0.250), mm | 6.6 (1.0) | 5.5 (0.8) | 6.6 (0.9) | 5.6 (0.7) | <0.0001 |
| fJSW - lateral compartment (x=0.725), mm | 8.8 (1.4) | 7.4 (1.1) | 8.0 (1.4) | 7.0 (1.2) | <0.0001 |
BMI: Body Mass Index, DIPs: Distal Interphalangeal Joints, K-L grade: Kellgren–Lawrence grade, fJSW: fixed Joint Space Width, OARSI grade: Osteoarthritis Research Society International grade
P-values for participant-level comparisons were generated with ANOVA and the Chi-square statistic for continuous and categorical variables, respectively. P-values for knee-level comparisons were generated with a mixed effect model for continuous variables, and logistic regression with generalized estimating equations for categorical variables.
K-L Grade and OARSI JSN Grade
Compared to knees of other race and sex groups, knees of AA females more frequently had a K-L grade of 1 instead of 0 at baseline (28.4% AA females vs. 25.5% all others). Unadjusted, WH males had a lower risk of radiographic K-L grade worsening than WH females (HR 0.68 [95% CI: 0.53, 0.88]; p=0.0028). In a model adjusted for age, BMI, family history of knee replacement, presence of bony enlargement of the DIPs, frequent knee bending, and history of knee injury or surgery, the difference persisted but slightly attenuated (HR 0.75 [95% CI: 0.58, 0.96]; p=0.0220). AA females had the highest rate of K-L worsening, though not significantly different than WH females (HR 1.21 [95% CI: 0.84, 1.74]; p=0.3039), and no evidence of increased risk was observed after adjustment for risk factors (HR 1.07 [95% CI: 0.75, 1.56]; p=0.7250). AA males had a similar crude rate of K-L grade worsening as WH males, though only WH males had a significantly lower risk than WH females after adjustment for risk factors (Table 2).
Table 2.
Radiographic worsening based on semi-quantitative ordinal scoring systems, by race and sex
| Crude Model | Adjusted Model* | |||||||
|---|---|---|---|---|---|---|---|---|
| Events/total at risk | Annual Event Rate† | Hazard Ratio | (95% CI) | p-value | Hazard Ratio | (95% CI) | p-value | |
| Kellgren-Lawrence Grade worsening (any increase in K-L grade) | ||||||||
| White Female | 193/1858 | 29.43 | 1.00 | ref | 1.00 | ref | ||
| African American Female | 39/334 | 35.85 | 1.21 | (0.84, 1.74) | 0.3039 | 1.07 | (0.73, 1.56) | 0.7250 |
| White Male | 99/1388 | 19.83 | 0.68 | (0.53, 0.88) | 0.0028 | 0.75 | (0.58, 0.96) | 0.0220 |
| African American Male | 14/184 | 22.54 | 0.76 | (0.43, 1.33) | 0.3357 | 0.93 | (0.57, 1.54) | 0.7837 |
| Medial Joint Space Narrowing (any increase in OARSI grade) | ||||||||
| White Female | 50/1858 | 7.38 | 1.00 | ref | 1.00 | ref | ||
| African American Female | 10/334 | 8.71 | 1.17 | (0.58, 2.36) | 0.6617 | 0.99 | (0.49, 2.01) | 0.9703 |
| White Male | 45/1388 | 8.79 | 1.20 | (0.79, 1.81) | 0.3989 | 1.03 | (0.68, 1.56) | 0.9012 |
| African American Male | 11/184 | 17.46 | 2.28 | (1.14, 4.57) | 0.0198 | 1.24 | (0.56, 2.76) | 0.6027 |
| Lateral Joint Space Narrowing (any increase in OARSI grade) | ||||||||
| White Female | 28/1858 | 4.10 | 1.00 | ref | 1.00 | ref | ||
| African American Female | 8/334 | 6.93 | 1.66 | (0.72, 3.82) | 0.2313 | 1.12 | (0.42, 2.97) | 0.8273 |
| White Male | 8/1388 | 1.55 | 0.38 | (0.17, 0.86) | 0.0195 | 0.74 | (0.38, 1.44) | 0.3730 |
| African American Male | 3/184 | 4.64 | 1.08 | (0.31, 3.79) | 0.9005 | 1.02 | (0.28, 3.66) | 0.9806 |
Adjusted for age, BMI, family history of knee replacement, any bony enlargements of the distal interphalangeal joints, frequent knee bending, history of knee injury, and history of knee surgery or arthroscopy
Per 1000 knee-years
BMI: Body Mass Index, K-L grade: Kellgren–Lawrence grade, OARSI grade: Osteoarthritis Research Society International grade
Knees of WHs more frequently had evidence of medial JSN with OARSI grade ≥1 at baseline than knees of AAs (10.8% WHs vs. 6.4% AAs). In the crude model, the risk of medial JSN worsening based on OARSI grade progression was higher in AA males than in WH females (HR 2.28 [95% CI: 1.14, 4.57]; p=0.0198), but this difference attenuated substantially after adjustment (HR 1.24 [95% CI: 0.56, 2.76]; p=0.6027). While WH females had the lowest absolute rate of medial JSN, no substantial evidence of a difference in risk between WH females and other race and sex groups was found, particularly after adjustment for risk factors (Table 2).
WH males, compared to WH females, also had a lower risk of worsening lateral JSN (HR 0.38 [95% CI: 0.17 to 0.86]; p=0.0195), but after adjustment for baseline prevalence of KOA risk factors, the association attenuated (HR 0.74 [95% CI: 0.38, 1.44]; p=0.3730). AA females had a 66% higher rate of lateral JSN worsening than WH females, though not significant (HR 1.66 [95% CI: 0.72, 3.82]; p=0.2313), and similar after adjustment (HR 1.12 [95% CI: 0.42, 2.97]; 0.8273) (Table 2).
Joint Space Width
Mean baseline fJSW of the medial compartment was greater in males (6.6mm) than in females (5.6mm). Mean baseline fJSW of the lateral compartment was greater in WH and AA males (8.8mm, 8.0mm, respectively) than in WH and AA females (7.4mm, 7.0mm, respectively).
In a model adjusted for age, BMI, family history of knee replacement, presence of bony enlargement of the DIPs, frequent knee bending, and history of knee injury or surgery, the mean baseline medial fJSW was greater in WH and AA males (6.49 mm for both) than in WH and AA females (5.42 and 5.41, respectively). Figure 1 and Table 3 display the race and sex-specific mean medial fJSW (at x=0.250) from baseline to 48 months, after adjustment, with 95% CIs. Change in mean medial fJSW over four years was significantly greater among AA males (−0.19 mm/year [95% CI: −0.22 to −0.16]) compared to WH males (−0.09 mm/year [95% CI: −0.10 to −0.08]), WH females (−0.07 mm/year [95% CI: −0.08 to −0.06]), and AA females (−0.10 mm/year [95% CI: −0.12 to −0.08]) (p<0.0001). Trajectories of mean medial fJSW x=0.275 were similar (data from sensitivity analysis not shown).
Figure 1.
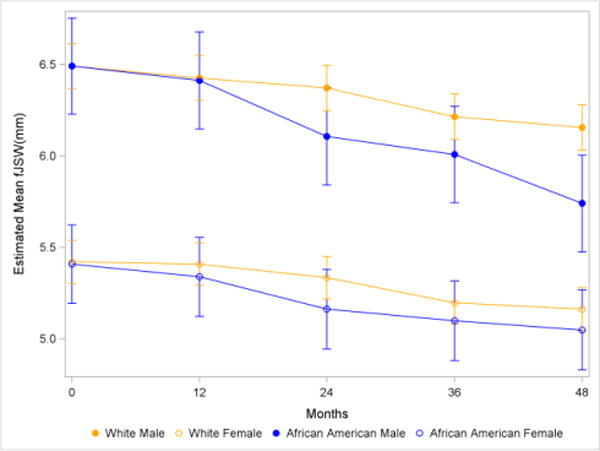
Mean medial fJSW (x=0.250) with 95% CI, by race and sex*
*Adjusted for age, BMI, family history of knee replacement, any bony enlargements of the distal interphalangeal joints, frequent knee bending, history of knee injury, and history of knee surgery or arthroscopy
fJSW: fixed joint space width
Table 3.
Race-sex-specific joint space width in the medial and lateral compartments
| White | African American | |||||||||||
|---|---|---|---|---|---|---|---|---|---|---|---|---|
| Male | Female | Male | Female | |||||||||
| Medial fJSW (x=0.250) | ||||||||||||
| Month | n | mean* | 95%CI | n | mean* | 95%CI | n | mean* | 95%CI | n | mean* | 95%CI |
| 0 | 510 | 6.49 | (6.37, 6.62) | 793 | 5.42 | (5.30, 5.54) | 80 | 6.49 | (6.23, 6.75) | 129 | 5.41 | (5.19, 5.62) |
| 12 | 499 | 6.43 | (6.30, 6.55) | 776 | 5.41 | (5.29, 5.53) | 67 | 6.41 | (6.15, 6.68) | 121 | 5.34 | (5.12, 5.55) |
| 24 | 487 | 6.37 | (6.25, 6.50) | 726 | 5.33 | (5.22, 5.45) | 62 | 6.11 | (5.84, 6.38) | 111 | 5.16 | (4.94, 5.38) |
| 36 | 479 | 6.21 | (6.09, 6.34) | 711 | 5.20 | (5.08, 5.31) | 72 | 6.01 | (5.74, 6.27) | 104 | 5.10 | (4.88, 5.32) |
| 48 | 466 | 6.16 | (6.03, 6.28) | 702 | 5.16 | (5.04, 5.28) | 70 | 5.74 | (5.48, 6.01) | 98 | 5.05 | (4.83, 5.27) |
| Chang in mean fJSW (mm/year) | −0.09 | (−0.10, −0.08) | −0.07 | (−0.08, −0.06) | −0.19 | (−0.22, −0.16) | −0.10 | (−0.12, −0.08) | ||||
| Lateral fJSW (x=0.725) | ||||||||||||
| Month | n | mean* | 95%CI | n | mean* | 95%CI | n | mean* | 95%CI | n | mean* | 95%CI |
| 0 | 489 | 8.70 | (8.53, 8.87) | 749 | 7.37 | (7.21, 7.54) | 66 | 7.99 | (7.62, 8.35) | 118 | 6.87 | (6.57, 7.16) |
| 12 | 473 | 8.61 | (8.44, 8.78) | 732 | 7.28 | (7.12, 7.44) | 59 | 8.02 | (7.66, 8.39) | 114 | 6.62 | (6.33, 6.92) |
| 24 | 473 | 8.53 | (8.36, 8.70) | 678 | 7.19 | (7.03, 7.35) | 54 | 7.57 | (7.20, 7.94) | 102 | 6.43 | (6.13, 6.73) |
| 36 | 472 | 8.38 | (8.21, 8.55) | 680 | 7.07 | (6.91, 7.23) | 71 | 7.67 | (7.31, 8.03) | 97 | 6.44 | (6.14, 6.74) |
| 48 | 458 | 8.34 | (8.17, 8.51) | 674 | 7.00 | (6.84, 7.16) | 68 | 7.49 | (7.13, 7.86) | 98 | 6.26 | (5.96, 6.56) |
| Chang in mean fJSW (mm/year) | −0.10 | (−0.11, −0.08) | −0.10 | (−0.11, −0.09) | −0.13 | (−0.17, −0.10) | −0.14 | (−0.17, −0.11) | ||||
Adjusted for age, BMI, family history of Knee replacement, any bony enlargements of distal interphalangeal joints, frequent knee bending, history of knee injury, and history of knee surgery or arthroscopy
BMI: Body Mass Index, CI: confidence interval, fJSW: fixed Joint Space Width
Based on a model adjusted for the same variables, the baseline mean lateral fJSW was also larger in males than in females and in WHs than in AAs when fJSW was measured at x=0.725 (Table 3) or at x=0.750 (data from sensitivity analysis not shown). These race and sex differences in mean lateral fJSW persisted during the 48 month follow-up period (Figure 2). There was a general decline in lateral JSW during the study period, but there was no evidence of a difference in the change in mean lateral fJSW among the different race and sex groups (Table 3).
Figure 2.
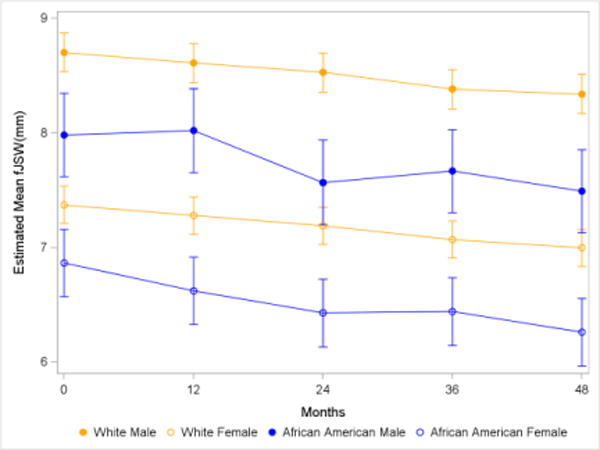
Mean lateral fJSW (x=0.725) with 95% CI, by race and sex*
*Adjusted for age, BMI, family history of knee replacement, any bony enlargements of the distal interphalangeal joints, frequent knee bending, history of knee injury, and history of knee surgery or arthroscopy
fJSW: fixed joint space width
DISCUSSION
Among participants at risk for KOA, males had greater mean medial and lateral JSW than females at baseline, regardless of race. AA males experienced greater medial JSW loss over time on average, compared to WHs and AA females. There was also evidence that AA males, compared to WH females, experienced higher risk of medial joint space worsening based on OARSI JSN criteria, with much of the increased risk explained by established risk factors for KOA. When grouped by sex, AAs also had less lateral JSW on average at baseline and throughout the follow-up period compared to WHs. When adjusted for multiple clinical variables, the risk of further lateral JSN by OARSI criteria did not significantly differ by race and sex. WH males, compared to WH females, also had a lower risk of radiographic KOA grade worsening based on the K-L grading system.
In our cohort, AAs were substantially more often overweight or obese, WH females had the highest prevalence of bony enlargements of the DIPs, and males, particularly WH males, more frequently presented with a history of knee injury/surgery. These risk factors for KOA development could contribute to race and sex variations in JSN worsening [34, 35]. Distinct OA phenotypes have different drivers of progression [38]. Certain risk factors for KOA progression (e.g., meniscal knee injury) predominately affect JSN worsening while others may more strongly influence other radiographic features such as osteophytes. Different race and sex groups have varying risk factor profiles, potentially leading to different OA phenotypes (Figure 3). Hence, estimates of KOA worsening by race and sex groups may be influenced depending on the use of K-L grade scores versus OARSI JSN scores, to define worsening.
Figure 3.
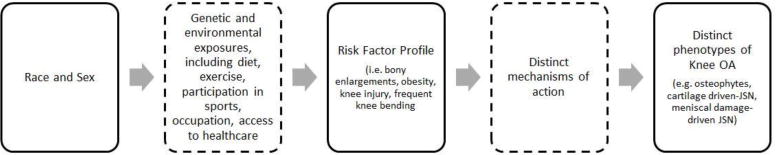
Conceptual model
Notably, AA females had the highest rates of K-L grade worsening and lateral JSN worsening and were more often overweight or obese than WH females. After adjustment for BMI and other risk factors, the magnitude of the difference diminished substantially, suggesting that obesity acts as a mediator. AA males had the highest rate of medial JSN worsening and frequently presented overweight or obese at baseline, as well as with a history of knee injury. After adjustment for these and other risk factors, the risk difference was markedly less, though still detectable in analysis of the loss of medial fJSW, suggesting that while BMI and history of knee injury may play a large role, other unmeasured contributing factors remain. WH females experienced a high rate of K-L grade worsening, despite the lowest prevalence of obesity, though they also presented with the highest rate of bony enlargements of the DIPs at baseline, suggesting a potentially widespread bony phenotype.
Consistent with previous analyses of semi-quantitative readings of knee radiographs, we found no racial difference in medial JSW but less lateral JSW at baseline among AAs compared to WHs, as well as greater medial JSW among males compared to females [14, 37]. In a cross-sectional analysis of the Johnston County Osteoarthritis (JoCo OA) Project data, Braga et al [14] showed that AA males and females were more likely to have lateral JSN than WHs. Yet, they found no racial difference in the frequency of medial JSN among both sexes. Proportionally, females were also more likely than males to have medial JSN. Using the Multicenter Osteoarthritis Study (MOST) data, Wise et al [37] also reported that lateral JSN was more prevalent in the knees of AAs than in WHs and in the knees of females than in males, consistent with our findings. Overall our baseline JSW findings are consistent with findings from these previous cross-sectional analyses.
Our longitudinal findings additionally suggest that the risk of lateral JSN worsening did not significantly differ by race and sex when adjusted for multiple clinical variables. AA males had a higher risk of medial JSN worsening over time than WH females, but the difference in risk was no longer significant when taking into account the same clinical variables. As previously suggested, varying genetic and environmental exposures by the different racial and sex group may account for the different rates of worsening in unadjusted models. Other KOA longitudinal studies compared the incidence or progression of radiographic KOA between AAs and WHs [39–41]. However, none had quantitative JSW data, and only one, a study by Mazzuca et al [39], utilized the OARSI JSN system in tracking radiographic changes in the tibiofemoral compartment. In this study of 114 subjects recruited from Indianapolis, the unadjusted odds of developing medial tibiofemoral OARSI JSN was approximately 4 times higher in AAs than in WHs [39]. Our study adds to the literature by comparing JSN worsening between AAs and WHs and between males and females longitudinally using quantitative data and semi-quantitative (e.g., OARSI JSN grade) data, adjusted for known OA risk factors.
We further demonstrated that the risk of any increase in K-L grade over time was lower only in WH males, in comparison to WH females. Yet, neither AA males nor females had a significantly different risk of K-L grade worsening, in comparison to WH females. Kopec et al [40] found that AA race was not associated with radiographic KOA incidence, defined by an increase in K-L grade from 0/1 at baseline to ≥2 at first follow-up, among JoCo OA study participants [40]. However, AA race was associated with radiographic KOA progression, defined by an increase in K-L grade at follow-up of a joint with K-L grade of 2 or 3 at baseline. In a separate analysis, incident radiographic KOA (K-L grade ≥2) rate minimally differed between AAs and WHs [41].
Measuring JSW, however, is arguably a more objective, sensitive and responsive quantitative measure for radiographic KOA than either the K-L or OARSI grading systems. It may also more fully characterize the natural history of JSW loss. By tracking the JSW of OAI knees over time, we were able to shed light on what has been a somewhat conflicted literature [39–41] on longitudinal race and sex changes in radiographic KOA. Clinicians may educate patients, particularly AAs, about their higher risks of developing KOA and the risk factors that contribute to race and sex differences in KOA. Health policy makers may use our findings to advocate for more consistent use of quantitative data in evaluating the effects of potentially disease-modifying OA drugs in clinical trials and the inclusion of an appropriate number of racial/ethnic minorities in these trials.
Our study has several limitations. First, the OAI is not a population-based study, so it is not clear if the race and sex-specific risk factor profile differences that we found are broadly generalizable. Second, recruited OAI participants were predominantly non-Hispanic WHs and AAs, and we were not able to evaluate early KOA worsening in other race/ethnic groups. Third, we were not able to present data on the development of osteophytes, and AAs may be at a higher risk than WHs of developing osteophytes in early KOA [14, 39]. OARSI osteophyte scores were only available in participants with definite radiographic OA. Fourth, we were not able to report on longitudinal knee malalignment, as full-limb radiographs were not taken at baseline. Malalignment may increase the risk of knee OA progression and incidence [42]. Wise et al [37] found that the prevalence of varus malalignment was higher in males and AAs than in females and WHs, respectively, using MOST data. Females were also found to be more likely to have valgus malalignment than males [37]. Nelson et al [43], on the other hand, found no racial difference in valgus knee malalignment among individuals without radiographic KOA in the JoCo cohort. Finally, the OAI did not take skyline or lateral knee radiographs, thus we cannot report on patellofemoral joint findings. Racial differences in certain patellofemoral joint radiographic features have been reported [14]. However, tibiofemoral JSN is the radiographic finding that is most strongly associated with OA-related knee pain [28].
There are several strengths to this study as well. We used data from a large cohort of OAI participants with a relatively large number of AAs, allowing us to compare KOA worsening by race. Our study is also the first to assess knee radiographs with semi-quantitative scoring and to report quantitative fJSW measurement, stratified by race and sex, over 4 years of follow-up. Finally, we were able to highlight relevant race/sex differences in the constellation of predisposing risk factors of KOA, which may lead to distinct OA phenotype distributions among males and females, AAs and WHs, and potentially explain different rates of worsening and loss of joint space.
CONCLUSIONS
AA males experienced higher risk of medial joint space loss, whether assessed by semi-quantitative JSN or quantitative fJSW, potentially due to high rates of both obesity and history of knee injury. AAs, compared to WHs, also had less lateral joint space on average at baseline and during four years of follow-up. WH females had high rates of KOA K-L grade worsening during follow-up and presented with markedly high prevalence of bony enlargements of the DIPs. Further research to investigate risk factor profiles as causes of differential KOA worsening by race and sex is warranted. Understanding these causes may facilitate a greater understanding of the role of individual risk factors and tailored interventions to reduce race/sex disparities in KOA.
Supplementary Material
Acknowledgments
The authors would like to thank all OAI study staff and participants. The OAI is a public-private partnership comprised of five contracts (N01-AR-2-2258; N01-AR-2-2259; N01-AR-2-2260; N01-AR-2-2261; N01-AR-2-2262) funded by the National Institutes of Health, a branch of the Department of Health and Human Services, and conducted by the OAI Study Investigators. Private funding partners include Merck Research Laboratories; Novartis Pharmaceuticals Corporation, GlaxoSmithKline; and Pfizer, Inc. Private sector funding for the OAI is managed by the Foundation for the National Institutes of Health. This manuscript was prepared using an OAI public use data set and does not necessarily reflect the opinions or views of the OAI investigators, the NIH, or the private funding partners.
This study was funded in part by NIH/National Institute of Arthritis and Musculoskeletal and Skin Diseases (NIAMS) (award numbers K23AR067226 and R01AR066601).
Footnotes
Publisher's Disclaimer: This is a PDF file of an unedited manuscript that has been accepted for publication. As a service to our customers we are providing this early version of the manuscript. The manuscript will undergo copyediting, typesetting, and review of the resulting proof before it is published in its final citable form. Please note that during the production process errors may be discovered which could affect the content, and all legal disclaimers that apply to the journal pertain.
References
- 1.Lawrence RC, Felson DT, Helmick CG, Arnold LM, Choi H, Deyo RA, et al. Estimates of the prevalence of arthritis and other rheumatic conditions in the United States. Part II. Arthritis Rheum. 2008;58:26–35. doi: 10.1002/art.23176. [DOI] [PMC free article] [PubMed] [Google Scholar]
- 2.Dillon CF, Rasch EK, Gu Q, Hirsch R. Prevalence of knee osteoarthritis in the United States: arthritis data from the Third National Health and Nutrition Examination Survey 1991–94. J Rheumatol. 2006;33:2271–9. [PubMed] [Google Scholar]
- 3.Jordan JM, Helmick CG, Renner JB, Luta G, Dragomir AD, Woodard J, et al. Prevalence of knee symptoms and radiographic and symptomatic knee osteoarthritis in African Americans and Caucasians: the Johnston County Osteoarthritis Project. J Rheumatol. 2007;34:172–80. [pii] [PubMed] [Google Scholar]
- 4.Bolen J, Schieb L, Hootman JM, Helmick CG, Theis K, Murphy LB, et al. Differences in the prevalence and severity of arthritis among racial/ethnic groups in the United States, National Health Interview Survey, 2002, 2003, and 2006. Prev Chronic Dis. 2010;7:A64. [PMC free article] [PubMed] [Google Scholar]
- 5.Golightly YM, Dominick KL. Racial variations in self-reported osteoarthritis symptom severity among veterans. Aging Clin Exp Res. 2005;17:264–9. doi: 10.1007/BF03324608. [DOI] [PubMed] [Google Scholar]
- 6.Allen KD, Helmick CG, Schwartz TA, DeVellis RF, Renner JB, Jordan JM. Racial differences in self-reported pain and function among individuals with radiographic hip and knee osteoarthritis: the Johnston County Osteoarthritis Project. Osteoarthritis Cartilage. 2009;17:1132–6. doi: 10.1016/j.joca.2009.03.003. [DOI] [PMC free article] [PubMed] [Google Scholar]
- 7.Blagojevic M, Jinks C, Jeffery A, Jordan KP. Risk factors for onset of osteoarthritis of the knee in older adults: a systematic review and meta-analysis. Osteoarthritis Cartilage. 2010;18:24–33. doi: 10.1016/j.joca.2009.08.010. [DOI] [PubMed] [Google Scholar]
- 8.Felson DT, Zhang Y, Hannan MT, Naimark A, Weissman BN, Aliabadi P, et al. The incidence and natural history of knee osteoarthritis in the elderly. The Framingham Osteoarthritis Study. Arthritis Rheum. 1995;38:1500–5. doi: 10.1002/art.1780381017. [DOI] [PubMed] [Google Scholar]
- 9.Srikanth VK, Fryer JL, Zhai G, Winzenberg TM, Hosmer D, Jones G. A meta-analysis of sex differences prevalence, incidence and severity of osteoarthritis. Osteoarthritis Cartilage. 2005;13:769–81. doi: 10.1016/j.joca.2005.04.014. [DOI] [PubMed] [Google Scholar]
- 10.Verbrugge LM. Women, men, and osteoarthritis. Arthritis Care Res. 1995;8:212–20. doi: 10.1002/art.1790080404. [DOI] [PubMed] [Google Scholar]
- 11.McAlindon TE, Snow S, Cooper C, Dieppe PA. Radiographic patterns of osteoarthritis of the knee joint in the community: the importance of the patellofemoral joint. Ann Rheum Dis. 1992;51:844–9. doi: 10.1136/ard.51.7.844. [DOI] [PMC free article] [PubMed] [Google Scholar]
- 12.Anderson JJ, Felson DT. Factors associated with osteoarthritis of the knee in the first national Health and Nutrition Examination Survey (HANES I). Evidence for an association with overweight, race, and physical demands of work. Am J Epidemiol. 1988;128:179–89. doi: 10.1093/oxfordjournals.aje.a114939. [DOI] [PubMed] [Google Scholar]
- 13.Sowers M, Lachance L, Hochberg M, Jamadar D. Radiographically defined osteoarthritis of the hand and knee in young and middle-aged African American and Caucasian women. Osteoarthritis Cartilage. 2000;8:69–77. doi: 10.1053/joca.1999.0273. [DOI] [PubMed] [Google Scholar]
- 14.Braga L, Renner JB, Schwartz TA, Woodard J, Helmick CG, Hochberg MC, et al. Differences in radiographic features of knee osteoarthritis in African-Americans and Caucasians: the Johnston county osteoarthritis project. Osteoarthritis Cartilage. 2009;17:1554–61. doi: 10.1016/j.joca.2009.07.011. [DOI] [PMC free article] [PubMed] [Google Scholar]
- 15.Hunter DJ, Le Graverand MP, Eckstein F. Radiologic markers of osteoarthritis progression. Curr Opin Rheumatol. 2009;21:110–7. doi: 10.1097/BOR.0b013e3283235add. [DOI] [PubMed] [Google Scholar]
- 16.Duryea J, Zaim S, Genant HK. New radiographic-based surrogate outcome measures for osteoarthritis of the knee. Osteoarthritis Cartilage. 2003;11:102–10. doi: 10.1053/joca.2002.0866. [DOI] [PubMed] [Google Scholar]
- 17.Oak SR, Ghodadra A, Winalski CS, Miniaci A, Jones MH. Radiographic joint space width is correlated with 4-year clinical outcomes in patients with knee osteoarthritis: data from the osteoarthritis initiative. Osteoarthritis Cartilage. 2013;21:1185–90. doi: 10.1016/j.joca.2013.06.024. [DOI] [PubMed] [Google Scholar]
- 18.Duryea J, Neumann G, Niu J, Totterman S, Tamez J, Dabrowski C, et al. Comparison of radiographic joint space width with magnetic resonance imaging cartilage morphometry: analysis of longitudinal data from the Osteoarthritis Initiative. Arthritis Care Res (Hoboken) 2010;62:932–7. doi: 10.1002/acr.20148. [DOI] [PMC free article] [PubMed] [Google Scholar]
- 19.Bruyere O, Richy F, Reginster JY. Three year joint space narrowing predicts long term incidence of knee surgery in patients with osteoarthritis: an eight year prospective follow up study. Ann Rheum Dis. 2005;64:1727–30. doi: 10.1136/ard.2005.037309. [DOI] [PMC free article] [PubMed] [Google Scholar]
- 20.Riddle DL, Jiranek WA, Hull JR. Validity and reliability of radiographic knee osteoarthritis measures by arthroplasty surgeons. Orthopedics. 2013;36:e25–32. doi: 10.3928/01477447-20121217-14. [DOI] [PubMed] [Google Scholar]
- 21.Kothari M, Guermazi A, von Ingersleben G, Miaux Y, Sieffert M, Block JE, et al. Fixed-flexion radiography of the knee provides reproducible joint space width measurements in osteoarthritis. Eur Radiol. 2004;14:1568–73. doi: 10.1007/s00330-004-2312-6. [DOI] [PubMed] [Google Scholar]
- 22.Brandt KD, Mazzuca SA, Conrozier T, Dacre JE, Peterfy CG, Provvedini D, et al. Which is the best radiographic protocol for a clinical trial of a structure modifying drug in patients with knee osteoarthritis? J Rheumatol. 2002;29:1308–20. [PubMed] [Google Scholar]
- 23.Peterfy C, Li J, Zaim S, Duryea J, Lynch J, Miaux Y, et al. Comparison of fixed-flexion positioning with fluoroscopic semi-flexed positioning for quantifying radiographic joint-space width in the knee: test-retest reproducibility. Skeletal Radiol. 2003;32:128–32. doi: 10.1007/s00256-002-0603-z. [DOI] [PubMed] [Google Scholar]
- 24.Kellgren JH, Lawrence JS. Radiological assessment of osteo-arthrosis. Ann Rheum Dis. 1957;16:494–502. doi: 10.1136/ard.16.4.494. [DOI] [PMC free article] [PubMed] [Google Scholar]
- 25.Altman RD, Hochberg M, Murphy WA, Jr, Wolfe F, Lequesne M. Atlas of individual radiographic features in osteoarthritis. Osteoarthritis Cartilage. 1995;3(Suppl A):3–70. [PubMed] [Google Scholar]
- 26.Altman RD, Gold GE. Atlas of individual radiographic features in osteoarthritis, revised. Osteoarthritis Cartilage. 2007;15(Suppl A):A1–56. doi: 10.1016/j.joca.2006.11.009. [DOI] [PubMed] [Google Scholar]
- 27.Gossec L, Jordan JM, Mazzuca SA, Lam MA, Suarez-Almazor ME, Renner JB, et al. Comparative evaluation of three semi-quantitative radiographic grading techniques for knee osteoarthritis in terms of validity and reproducibility in 1759 X-rays: report of the OARSI-OMERACT task force. Osteoarthritis Cartilage. 2008;16:742–8. doi: 10.1016/j.joca.2008.02.021. [DOI] [PubMed] [Google Scholar]
- 28.Neogi T, Felson D, Niu J, Nevitt M, Lewis CE, Aliabadi P, et al. Association between radiographic features of knee osteoarthritis and pain: results from two cohort studies. BMJ. 2009;339:b2844. doi: 10.1136/bmj.b2844. [DOI] [PMC free article] [PubMed] [Google Scholar]
- 29.Nevitt MC, Peterfy C, Guermazi A, Felson DT, Duryea J, Woodworth T, et al. Longitudinal performance evaluation and validation of fixed-flexion radiography of the knee for detection of joint space loss. Arthritis Rheum. 2007;56:1512–20. doi: 10.1002/art.22557. [DOI] [PubMed] [Google Scholar]
- 30.Felson D, Niu J, Sack B, Aliabadi P, McCullough C, Nevitt MC. Progression of osteoarthritis as a state of inertia. Ann Rheum Dis. 2013;72:924–9. doi: 10.1136/annrheumdis-2012-201575. [DOI] [PMC free article] [PubMed] [Google Scholar]
- 31.Duryea J, Li J, Peterfy CG, Gordon C, Genant HK. Trainable rule-based algorithm for the measurement of joint space width in digital radiographic images of the knee. Med Phys. 2000;27:580–91. doi: 10.1118/1.598897. [DOI] [PubMed] [Google Scholar]
- 32.Neumann G, Hunter D, Nevitt M, Chibnik LB, Kwoh K, Chen H, et al. Location specific radiographic joint space width for osteoarthritis progression. Osteoarthritis Cartilage. 2009;17:761–5. doi: 10.1016/j.joca.2008.11.001. [DOI] [PMC free article] [PubMed] [Google Scholar]
- 33.Virayavanich W, Alizai H, Baum T, Nardo L, Nevitt MC, Lynch JA, et al. Association of frequent knee bending activity with focal knee lesions detected with 3T magnetic resonance imaging: data from the osteoarthritis initiative. Arthritis Care Res (Hoboken) 2013;65:1441–8. doi: 10.1002/acr.22017. [DOI] [PMC free article] [PubMed] [Google Scholar]
- 34.Felson DT, Niu J, Clancy M, Sack B, Aliabadi P, Zhang Y. Effect of recreational physical activities on the development of knee osteoarthritis in older adults of different weights: the Framingham Study. Arthritis Rheum. 2007;57:6–12. doi: 10.1002/art.22464. [DOI] [PubMed] [Google Scholar]
- 35.Lohmander LS, Gerhardsson de Verdier M, Rollof J, Nilsson PM, Engstrom G. Incidence of severe knee and hip osteoarthritis in relation to different measures of body mass: a population-based prospective cohort study. Ann Rheum Dis. 2009;68:490–6. doi: 10.1136/ard.2008.089748. [DOI] [PubMed] [Google Scholar]
- 36.Klein JP, Moschberger ML. Survival Analysis: Techniques for Censored and Truncated Data. New York, NY: Springer; 2003. [Google Scholar]
- 37.Wise BL, Niu J, Yang M, Lane NE, Harvey W, Felson DT, et al. Patterns of compartment involvement in tibiofemoral osteoarthritis in men and women and in whites and African Americans. Arthritis Care Res (Hoboken) 2012;64:847–52. doi: 10.1002/acr.21606. [DOI] [PMC free article] [PubMed] [Google Scholar]
- 38.Siebuhr AS, Bay-Jensen AC, Jordan JM, Kjelgaard-Petersen CF, Christiansen C, Abramson SB, et al. Inflammation (or synovitis)-driven osteoarthritis: an opportunity for personalizing prognosis and treatment? Scand J Rheumatol. 2016;45:87–98. doi: 10.3109/03009742.2015.1060259. [DOI] [PubMed] [Google Scholar]
- 39.Mazzuca SA, Brandt KD, Katz BP, Ding Y, Lane KA, Buckwalter KA. Risk factors for early radiographic changes of tibiofemoral osteoarthritis. Ann Rheum Dis. 2007;66:394–9. doi: 10.1136/ard.2006.055905. [DOI] [PMC free article] [PubMed] [Google Scholar]
- 40.Kopec JA, Sayre EC, Schwartz TA, Renner JB, Helmick CG, Badley EM, et al. Occurrence of radiographic osteoarthritis of the knee and hip among African Americans and whites: a population-based prospective cohort study. Arthritis Care Res (Hoboken) 2013;65:928–35. doi: 10.1002/acr.21924. [DOI] [PMC free article] [PubMed] [Google Scholar]
- 41.Murphy LB, Moss S, Do BT, Helmick CG, Schwartz TA, Barbour KE, et al. Annual Incidence of Knee Symptoms and Four Knee Osteoarthritis Outcomes in the Johnston County Osteoarthritis Project. Arthritis Care Res (Hoboken) 2016;68:55–65. doi: 10.1002/acr.22641. [DOI] [PMC free article] [PubMed] [Google Scholar]
- 42.Felson DT, Niu J, Gross KD, Englund M, Sharma L, Cooke TD, et al. Valgus malalignment is a risk factor for lateral knee osteoarthritis incidence and progression: findings from the Multicenter Osteoarthritis Study and the Osteoarthritis Initiative. Arthritis Rheum. 2013;65:355–62. doi: 10.1002/art.37726. [DOI] [PMC free article] [PubMed] [Google Scholar]
- 43.Nelson AE, Braga L, Braga-Baiak A, Atashili J, Schwartz TA, Renner JB, et al. Static knee alignment measurements among Caucasians and African Americans: the Johnston County Osteoarthritis Project. J Rheumatol. 2009;36:1987–90. doi: 10.3899/jrheum.081294. [DOI] [PMC free article] [PubMed] [Google Scholar]
Associated Data
This section collects any data citations, data availability statements, or supplementary materials included in this article.