Abstract
The auditory system is thought to process complex sounds through overlapping bandpass filters. Frequency selectivity as estimated by auditory filters has been well quantified in humans and other mammalian species using behavioral and physiological methodologies, but little work has been done to examine frequency selectivity in nonhuman primates. In particular, knowledge of macaque frequency selectivity would help address the recent controversy over the sharpness of cochlear tuning in humans relative to other animal species. The purpose of our study was to investigate the frequency selectivity of macaque monkeys using a notched-noise paradigm. Four macaques were trained to detect tones in noises that were spectrally notched symmetrically and asymmetrically around the tone frequency. Masked tone thresholds decreased with increasing notch width. Auditory filter shapes were estimated using a rounded exponential function. Macaque auditory filters were symmetric at low noise levels and broader and more asymmetric at higher noise levels with broader low-frequency and steeper high-frequency tails. Macaque filter bandwidths (BW3dB) increased with increasing center frequency, similar to humans and other species. Estimates of equivalent rectangular bandwidth (ERB) and filter quality factor (QERB) suggest macaque filters are broader than human filters. These data shed further light on frequency selectivity across species and serve as a baseline for studies of neuronal frequency selectivity and frequency selectivity in subjects with hearing loss.
Keywords: Frequency selectivity, Notched-noise, Critical band, Nonhuman primate, Auditory filters, ERB
1. Introduction
Frequency selectivity, or the ability to resolve the different frequency components of a complex sound, is a fundamental property of the auditory system. Characterization of individual perceptual abilities and the anatomical and physiological correlates of these abilities reveals important contributions to one’s ability to hear in noisy environments. Decades of work have investigated frequency selectivity in humans, primarily through behavioral tasks, as well as a variety of animal models, using a combination of behavioral and physiological methodologies. These studies suggest that the auditory system utilizes overlapping bandpass filters for the detection and resolution of complex sounds (e.g. Fletcher, 1940; Patterson and Nimmo-Smith, 1980). These auditory filters are known to broaden in individuals with hearing impairment, serving as a likely contributor to difficulties with speech in noise perception (Tyler et al., 1984; Glasberg and Moore 1986; Desloge et al., 2012).
Little work has been done to examine frequency selectivity in nonhuman primates. Nonhuman primates are an ideal animal model for human hearing, due to their close phylogenetic relationship to humans and the similarities in their ability to detect auditory signals in noise (e.g. Dylla et al., 2013). Early auditory filter measurements in macaques were found to be similar to those for humans (Gourevitch, 1970) and more recent filter measurements in marmosets showed that frequency selectivity was generally comparable to that for humans, at least for some frequencies (Osmanski et al., 2013). In contrast, physiological measures using stimulus frequency otoacoustic emissions (SFOAEs) indicate poorer frequency selectivity for macaques than for humans (Joris et al., 2011). These discordant results are one example of the impact of methodology on measures of frequency selectivity. Comprehensive characterization of frequency selectivity in nonhuman primates using comparable methodologies to previous human experiments across both behavioral and physiological measures would contribute important information toward the controversy regarding the sharpness of human cochlear tuning (e.g. Shera et al., 2002; Ruggero and Temchin, 2005; Lopez-Poveda and Eustaquio-Martín, 2013). Here we report on behavioral frequency selectivity in macaque monkeys across their audible frequency range. These data provide the basis for ongoing and future investigations of the neurophysiological representations of frequency selectivity and changes in frequency selectivity following noise-induced hearing loss.
1.1. Methodological considerations in the measurement of frequency selectivity
While there are a variety of methods used to study frequency selectivity, the notched-noise paradigm (described in detail by Patterson and Nimmo-Smith, 1980) has been used routinely to study auditory filters in humans with normal hearing (e.g. Glasberg et al., 1984b; Oxenham and Simonson, 2006; Eustaquio-Martín and Lopez-Poveda, 2011; Lopez-Poveda and Eustaquio-Martín, 2013) and with hearing loss (Tyler et al., 1984; Glasberg and Moore 1986; Desloge et al., 2012). This body of research determined that auditory filter bandwidth increases with increasing signal frequency (e.g. Moore et al., 1990; Rosen and Stock, 1992; Shailer et al., 1990) and filter shape becomes more asymmetric at higher masker levels (e.g. Moore and Glasberg, 1987).
Due to the compressive nonlinearity of the auditory periphery, filter shape and width vary significantly depending on probe and masker level, frequency composition of the masker, use of fixed signal or masker level, and timing between signal and masker (e.g. Houtgast, 1977; Glasberg and Moore, 1982; Glasberg et al., 1984b; Niemiec et al., 1992; Moore and Glasberg, 1981; Rosen et al., 1998; Eustaquio-Martín and Lopez-Poveda, 2011; Lopez-Poveda and Eustaquio-Martín, 2013). The significant impact of methodology on filter sharpness complicates definitions and comparisons of frequency selectivity within and across species. Therefore, these comparisons require critical review and have been under debate in recent years. In particular, estimates of frequency selectivity using fixed signal level and fixed masker level paradigms should be compared with caution (Eustaquio-Martín and Lopez-Poveda, 2011; Lopez-Poveda and Eustaquio-Martín, 2013). Despite this, many studies make comparisons across species and between behavioral and physiological studies in an attempt to describe the evolutionary basis and neuronal origins of frequency selectivity (e.g. Fay, 1988; Evans et al., 1989; Shera et al., 2002; Joris et al., 2011). Unsurprisingly, the conclusions from these studies are variable and inconsistent.
These discrepancies in the literature motivate our investigation of auditory filters in a single model species using a single methodology in both physiological and behavioral experiments. We elected to use a fixed masker level notched-noise paradigm. This design limits the opportunity for off-frequency listening, provides ease of comparison to the wealth of human and non-primate mammalian behavioral data using fixed masker levels, and supplements physiological measurements of frequency selectivity in humans, macaques, and other mammals.
2. Methods
Experiments were conducted on four macaques: three male rhesus monkeys (Macaca mulatta) that were seven (monkey C) and ten (monkeys B and L) years of age at the time of testing, and one bonnet monkey (Macaca radiata) that was nine years of age at the time of testing (monkey G). All procedures were approved by the Animal Care and Use Committee at Vanderbilt University Medical Center and were in strict compliance with the National Institutes of Health guidelines for animal research.
All experiments were conducted in sound treated booths (Industrial Acoustics Corp, NY) that measured 1.8 m × 1.8 m × 2 m. During experiments, the monkeys were seated in an acrylic primate chair that was designed for comfort and with no obstruction to sounds on either side of the head (Audio chair, Crist Instrument Co., Hagerstown, MD). The subject’s head was fixed to the chair such that the head was directly facing the middle of the loudspeaker at a distance of 35 inches from the ears. The loudspeaker (SA1 loudspeaker, Madisound, WI) and amplifier (SLA2, Applied Research Technologies, Rochester, NY) were able to deliver sounds between 50 Hz and 40 kHz. Calibration using a ½” probe microphone placed at the approximate entrance of the subjects’ ear canals revealed that the output of the loudspeaker varied less than ±3 dB across the frequency range. Tones and noise were delivered from the same loudspeaker.
The monkeys were prepared for behavioral experiments by a surgical procedure, described in detail by Dylla et al. (2013). Briefly, during this surgical procedure, each monkey was implanted with a PEEK or titanium head holder (Crist Instruments, Hagerstown, MD) on the skull. This was used to position the monkey’s head in a fixed location during experiments, so that the sound location and level were constant relative to the monkey’s ears across trials and days. The monkeys were then trained to perform a behavioral Go/No-Go lever release task using fluid reward as positive reinforcement (for details, see Dylla et al., 2013).
2.1. Behavioral task
The monkeys were trained to detect 200-ms tones with 10-ms rise and fall times that were embedded in continuous noise. Signals were generated with onset phase of 0° and a sampling rate of 97.6 kHz. Monkeys initiated trials by pressing down on a lever (Model 829 Single Axis Hall Effect Joystick, P3America, San Diego, CA). The lever state was sampled at a rate of 24.4 kHz. After a variable hold time, a signal (tone) was presented on about 80% of trials. On hearing the tone, the monkey was required to release the lever within a 600-ms response window after the offset of the tone. The response window began with the onset of the stimulus, and the monkeys were free to respond even before stimulus offset. If the lever was released correctly on signal trials (hit), the monkey was rewarded with fluid. There were no penalties for not releasing the lever (miss), as this was taken to indicate non-detection. Catch trials were those in which no signal was played. Incorrect lever releases on catch trials (false alarms) were penalized with a timeout (6–10 s) in which no tone was presented (noise continued playing).
The experiments were controlled by a computer running OpenEx software (System 3, TDT Inc., Alachua, FL). The sound pressure level (SPL) of each tone could take values over a 60 dB range within each block. The different tone levels were randomly interleaved with catch trials and repeated 15–30 times each using the method of constant stimuli. Broadband noise was generated using one of the TDT System 3 functions, which generated flat spectrum noise that was then band-limited to 40 kHz. The level of the broadband noise is specified as the spectrum level, in dB SPL/Hz. The overall sound pressure level may be computed by adding the spectrum level to 10*log10(bandwidth in Hz).
2.2. Procedure
The notched-noise paradigm was modeled after the methods of Patterson and Nimmo-Smith (1980) and Glasberg et al. (1984b). Both symmetric and asymmetric notches were used to derive auditory filter shapes.
Symmetric notches were used for signal frequencies of 0.5, 1, 2, 4, 8, 16, 24, and 32 kHz, spanning nearly the entire audible frequency range of macaques (e.g., Pfingst et al., 1978). Tone detection performance was measured in broadband noise (5–40,000 Hz, 30 or 50 dB spectrum level) and notched-noise. The normalized half-notchwidth from the stimulus (tone) frequency, f0, to each edge of the notch, expressed as Δf/f0, was 0.0, 0.05, 0.1, 0.2, 0.3, 0.5, 0.6, 0.65, and 0.8. (Note: Due to bandwidth limitations of the system, 24 kHz was not tested at 0.8 half notch width and 32 kHz was not tested at half notch widths greater than 0.2.)
Asymmetric notches were also used for the signal frequencies of 2 and 16 kHz. Upward shifted notches were obtained with the high frequency edge of the lower band of noise 0.2f0 closer to f0 than the low frequency edge of the higher band of noise, while maintaining a particular notch width. Downward shifted notches were obtained with the lower band of noise 0.2f0 farther from f0 than the higher band of noise. For an illustration of the stimulus setup, see the inset graphs in Figs. 3 and 4 of Patterson and Nimmo-Smith (1980). Values of Δf/f0 for the asymmetric notch conditions were 0.3, 0.4, 0.5, 0.6, 0.65, and 0.8. All asymmetric testing was completed using both the 30 and 50 dB SPL/Hz maskers.
2.3. Calculation of behavioral thresholds
Data were analyzed according to signal detection theoretic methods, as described in Dylla et al. (2013) and Bohlen et al. (2014). Briefly, the hit rate at each tone level (H(level)) and false alarm rate (FA) were calculated based on the number of releases at each tone level and on catch trials respectively within a block. Based on signal detection theory, H(level) and FA were then converted into units of standard deviation of a standard normal distribution (z-score, norminv in MATLAB) to estimate d’ according to d′(level) = z(H(level)) − z(FA) (Macmillan and Creelman, 2005). Because we wanted these results to serve as a baseline for neurophysiological studies where we measure distributions of responses to (noise) and (signal+noise), we converted the Go/No-Go analysis to a 2AFC analysis and calculated the probability correct (pc) at each tone level as follows: pc(level) = z−1(d′ (level)/2). Here, the inverse z transform (z−1) converts a unique number of standard deviations of a standard normal distribution into a probability correct (normcdf in MATLAB). The conversion of d’ to the pc measure was to facilitate the comparison of psychometric functions with neurometric functions obtained from neuronal responses using distribution free methods. The traditional threshold estimated at d′ = 1 corresponds to pc = 0.76.
To obtain a smooth relationship between pc and level, psychometric functions were fitted with a modified Weibull cumulative distribution function (cdf) according to , where level is the tone level (in dB SPL), λ represents the threshold parameter and k corresponds to the slope parameter. c represents the saturation probability correct, and d is the estimate of chance performance. Threshold was calculated from the fit as the tone level that would cause a pcfit value of 0.76.
2.4. Filter shape and bandwidth analyses
Tone detection thresholds obtained from the Weibull cdf fits at various notch widths were fitted assuming that each side of the auditory filter was a rounded exponential. This was done using publicly available software developed by B. C. J. Moore and B. R. Glasberg. The ROEXPR program was used for symmetric filter estimates and the ROEX3 program was used for asymmetric filter estimates. In both of these programs, the default settings were used. The rounded exponential (roex) filter shape is described by:
where g is the normalized deviation from the center frequency, and p and r are adjustable parameters. A larger value of p indicates a larger slope and therefore a narrower filter. r corresponds to the shallow tail of the filter. Additionally, processing efficiency (k) was calculated directly from the fitting process (see Patterson et al., 1982), with a smaller value of k (in dB) indicating more efficient processing. The W(g) filter parameter values were iteratively adjusted in the software so as to achieve the smallest RMS difference between the predicted and actual threshold values. The width of the filter was measured 3 dB down from the peak (BW3dB) and was used to define frequency selectivity. ERB values, another metric used to describe frequency selectivity, were calculated from the p values, according to: ERB = 4*f0/p. Quality factors of the perceptual filter (QERB), which provide a dimensionless measure of the sharpness of filter tuning, were calculated from the ERB, according to Shera et al. (2002): QERB = f0/ERB: BW3dB, ERB, and QERB values were compared across species using published data sets.
3. Results
3.1. Macaque filter shapes and bandwidths
Fig. 1 shows the behavioral data used to derive a perceptual auditory filter. Fig. 1A shows the psychometric functions for Monkey B for an 8 kHz signal in a 30-dB spectrum level masker. Psychometric functions are shown for notched-noise maskers with g values of 0 (black), 0.1 (red), 0.5 (green), and 0.65 (blue). As shown in other studies, the tone detection threshold decreased (threshold level indicated by the dashed lines, leftward shift of the dynamic range) with increasing notch width. Fig. 1B shows the threshold (in dB SPL) of the 8 kHz tone as a function of notch width. Filter parameter values were used to generate the auditory filter shown in Fig. 1C. The horizontal dashed line in Fig. 1C indicates the half power bandwidth of the auditory filter function, which was defined as BW3dB.
Fig. 1.
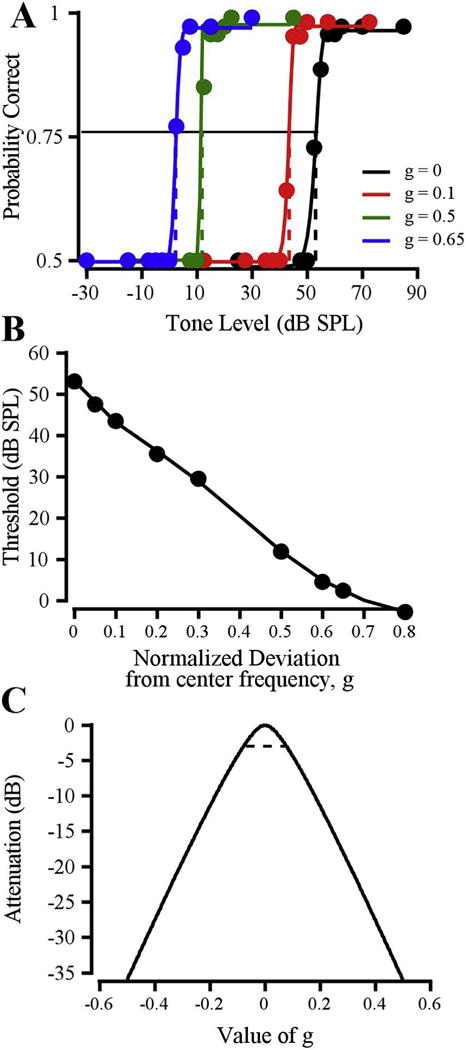
Estimation of an auditory filter shape from the notched-noise paradigm. A: Psychometric functions for detecting an 8-kHz tone in a 30 dB/Hz masker, with g values of 0 (black), 0.1 (red), 0.5 (green), and 0.65 (blue). Threshold is the signal level that would evoke 0.76 probability correct (indicated by dashed lines). B: Thresholds from (A) plotted as a function of g (normalized deviation from center frequency). C: Auditory filter shape for an 8-kHz tone in 30 dB/Hz noise (from data in B). Dashed line indicates the half power point of the filter; the bandwidth of the filter at the half-power point was taken as BW3dB. Data are from Monkey B. (For interpretation of the references to colour in this figure legend, the reader is referred to the web version of this article.)
3.1.1. Auditory filters across frequencies
Fig. 2 shows tone detection threshold as a function of notch width for various tone frequencies in the symmetric notch condition. For all four subjects, the lowest frequencies (0.5 kHz, 1 kHz, red) yielded the shallowest functions and the highest frequencies (16 kHz, 32 kHz, blue) yielded the steepest functions. A steeper slope indicates a more sharply tuned filter. These data suggest that auditory filters become relatively narrower (on a logarithmic frequency scale) with increasing frequency. The symmetric auditory filters generated from the functions in Fig. 2 are shown for each subject in Fig. 3. Absolute filter bandwidth increased with increasing frequency, consistent with the extensive literature on human auditory filters (e.g. Moore and Glasberg, 1987).
Fig. 2.
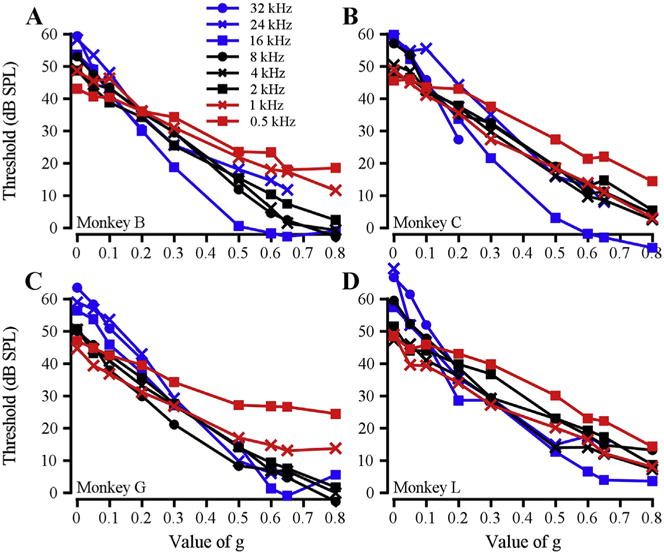
Threshold as a function of g at each frequency tested for each subject. A – D. Data from monkeys B, C, G, L, respectively.
Fig. 3.
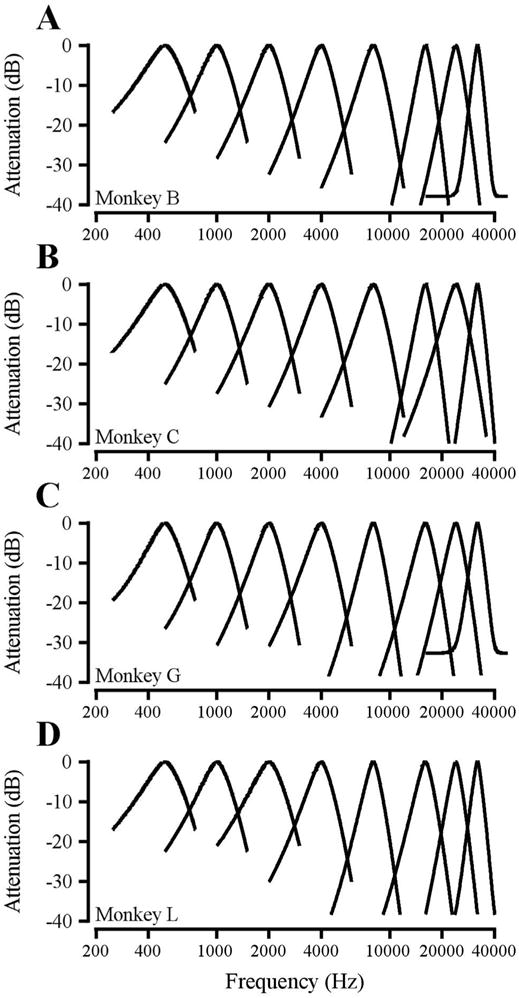
Auditory filters across the macaque audible frequency range. A – D. Data from monkeys B, C, G, L, respectively.
3.1.2. Auditory filters across masker levels and asymmetric masker configurations
Masker intensity affects the bandwidth and asymmetry of auditory filters (e.g. Moore et al., 1990; Rosen and Stock, 1992; Eustaquio-Martín and Lopez-Poveda, 2011; explained in Lopez-Poveda and Eustaquio-Martín, 2013). Our macaque subjects showed similar masker level effects to those observed previously in human and animal studies. Representative auditory filter shapes are shown for one subject at 2 kHz (Fig. 4A) and 16 kHz (Fig. 4B) with 30 (blue) and 50 (red) dB/Hz maskers in both symmetric (dashed line) and asymmetric (solid line) masking conditions. Filter bandwidth and symmetry changed minimally with increasing noise level at 2 kHz. A more pronounced effect of noise level was observed at 16 kHz, with a broader, more asymmetric filter (broad lower side, steep upper side) at the higher noise level. Additionally, filter asymmetry was small for 30 dB/Hz masker conditions at both 2 and 16 kHz, while more pronounced asymmetry occurred at 50 dB/Hz masker conditions for both signal frequencies. These findings are consistent with previous work (Weber, 1977; Pick, 1980; Patterson, 1971).
Fig. 4.
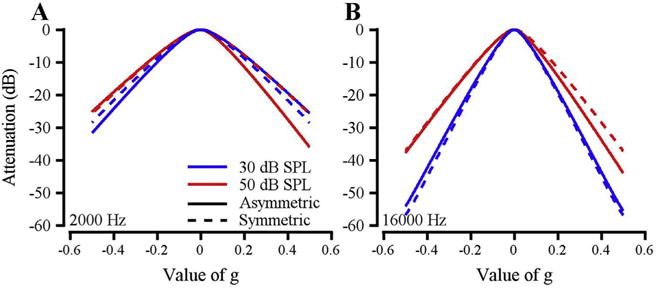
Auditory filter shape and asymmetry as a function of masker level. Data are from Monkey B. A: Symmetric (dashed lines) and asymmetric (solid lines) auditory filter shapes for a 2 kHz tone with 30 (blue) and 50 (red) dB/Hz maskers. B: Similar to A, but for a 16 kHz tone. (For interpretation of the references to colour in this figure legend, the reader is referred to the web version of this article.)
3.2. Characterizing macaque frequency selectivity
Half power bandwidth (BW3dB), equivalent rectangular bandwidth (ERB), and quality factor (QERB) were calculated for the auditory filters for each subject at each probe frequency. Values were derived from symmetric 30 dB masker level filters unless otherwise specified. Due to low variability in filter shape and frequency selectivity metrics across subjects, mean data will be highlighted in the following section. Individual and mean BW3dB values are listed by frequency in Table 1.
Table 1.
BW3dB values in Hz for individual monkeys and their mean.
| Frequency (kHz) | Monkey B | Monkey C | Monkey G | Monkey L | Mean (Std. Dev.) |
|---|---|---|---|---|---|
| 0.5 | 143 | 143 | 123 | 143 | 138 (10) |
| 1 | 215 | 210 | 195 | 230 | 213 (14) |
| 2 | 380 | 390 | 354 | 480 | 401 (55) |
| 4 | 680 | 706 | 700 | 720 | 702 (17) |
| 8 | 1240 | 1320 | 1040 | 1000 | 1150 (155) |
| 16 | 1648 | 1680 | 2160 | 2000 | 1872 (249) |
| 24 | 2520 | 3624 | 2808 | 2328 | 2820 (571) |
| 32 | 2105 | 2368 | 2592 | 2336 | 2350 (199) |
Note: BW3dB values were obtained using filters estimated from 30 dB SPL/Hz maskers.
BW3dB values increased approximately linearly as a function of frequency (Fig. 5, mean = red circles, range = gray shaded area; slope = 0.084, R2 = 0.8376, p = 6.8 × 10⁻¹⁴). Values were consistent with previous macaque critical bandwidth data (Gourevitch, 1970; blue circles) from 0.5 to 4 kHz and were lower over the 8–32 kHz range. Macaque BW3dB values were plotted against previous data collected from humans (Desloge et al., 2012, notched-noise; black diamonds). BW3dB values from the present study of macaques seem to align well with BW3dB values from humans, but differences may not be clear using this metric due to scaling.
Fig. 5.
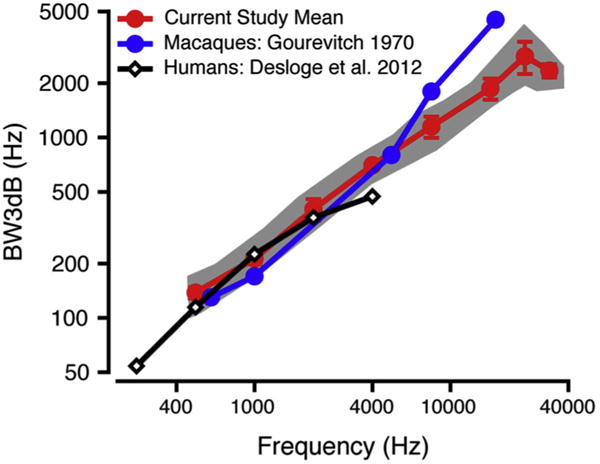
BW3dB values as a function of frequency. Mean macaque BW3dB data from current study (mean: red circles; standard deviation: error bars) are plotted against previous macaque data using band-widening techniques (Gourevitch, 1970; blue circles) and BW3dB data from humans (Desloge et al., 2012; unfilled black diamonds). The gray shaded area shows the range of the macaque BW3dB values in the current study. (For interpretation of the references to colour in this figure legend, the reader is referred to the web version of this article.)
BW3dB values were also calculated for symmetric and asymmetric filters at 2 and 16 kHz for the 30 and 50 dB masker levels (mean data listed in Table 2). BW3dB values were generally smaller using asymmetric filter shapes compared to symmetric filter shapes. BW3dB values were greater at the higher masker level for both symmetric and asymmetric filters.
Table 2.
BW3dB values in Hz obtained from symmetric and asymmetric notched-noise at 30 and 50 dB SPL/Hz.
| Frequency (kHz) | Mean BW3dB @ 30 dB (Std. Dev) | Mean BW3dB @ 50 dB (Std. Dev.) |
|---|---|---|
| 2, symmetric | 401 (55) | 478 (64) |
| 2, asymmetric | 362 (45) | 384 (45) |
| 16, symmetric | 1872 (249) | 2422 (386) |
| 16, asymmetric | 1874 (294) | 2124 (436) |
Note: Summary data based on 4 monkeys.
ERB values were calculated based on the values of p derived from the rounded exponential fit. Individual and mean macaque ERB values are listed by frequency in Table 3 and mean ERB values are plotted as a function of tone frequency in Fig. 6 (mean: red circles; standard deviation: error bars; range indicated by gray shaded area). The ERB increased with increasing signal frequency and this was well described by a power function of the signal frequency (exponent = 0.098, R2 = 0.8565, p = 3.5 × 10⁻¹⁴). Macaque ERB values were compared to ERB values from humans (black, all notched-noise; circles: Moore et al., 1990; unfilled squares: Glasberg and Moore 1986; triangles: Shailer et al., 1990; unfilled diamonds: Desloge et al., 2012), marmosets (blue circles: Osmanski et al., 2013, notched-noise), and chinchillas (green squares: Niemiec et al., 1992, notched-noise). Macaque ERB values were comparable to some human ERB data sets (compare red circles with unfilled diamonds, Fig. 6), but were globally broader than most human ERB values and ERBs for marmosets and chinchillas.
Table 3.
ERB values in Hz for individual macaques and their mean.
| Frequency (kHz) | Monkey B | Monkey C | Monkey G | Monkey L | Mean (Std. Dev.) |
|---|---|---|---|---|---|
| 0.5 | 171 | 171 | 146 | 171 | 165 (13) |
| 1 | 255 | 250 | 233 | 272 | 252 (16) |
| 2 | 452 | 465 | 423 | 576 | 479 (67) |
| 4 | 812 | 847 | 842 | 856 | 839 (19) |
| 8 | 1488 | 1576 | 1250 | 1194 | 1377 (184) |
| 16 | 1963 | 2000 | 2570 | 2415 | 2237 (302) |
| 24 | 3028 | 4229 | 3380 | 2807 | 3361 (625) |
| 32 | 2560 | 2826 | 3107 | 2777 | 2817 (225) |
Note: ERBs obtained using filters estimated from 30 dB SPL/Hz maskers.
Fig. 6.
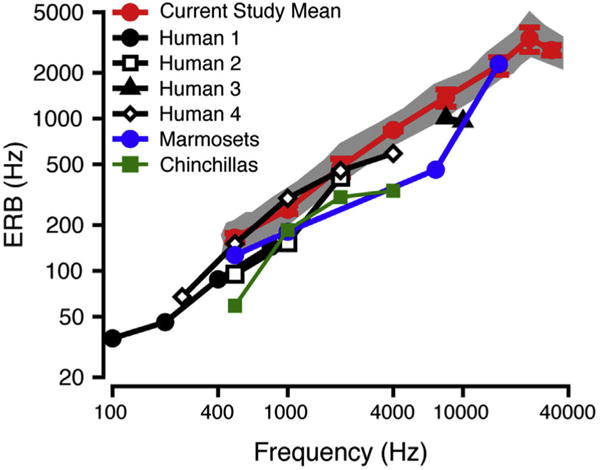
ERB as a function of frequency. Mean macaque ERB data from current study (mean: red circles; standard deviation: error bars) are compared to ERB data obtained using notched-noise methods for humans (black; filled circles (Human1): Moore et al., 1990; unfilled squares (Human2): Glasberg and Moore 1986; filled triangles (Human3): Shailer et al., 1990; unfilled diamonds (Human4): Desloge et al., 2012), marmosets (blue; Osmanski et al., 2013), and chinchillas (green; Niemiec et al., 1992). The gray shaded area shows the range of the macaque ERB values in the current study. (For interpretation of the references to colour in this figure legend, the reader is referred to the web version of this article.)
QERB values also reflect this trend, with generally lower QERB values for the macaque as compared to most human data sets (except for data from Desloge et al., 2012), suggesting poorer frequency selectivity in macaques. Individual and mean QERB data are listed in Table 4. Fig. 7 shows mean macaque data (red circles) plotted against behavioral data for humans (black circles: Moore et al., 1990; unfilled black squares: Glasberg and Moore 1986; black triangles: Shailer et al., 1990; unfilled diamonds: Desloge et al., 2012; black line: Shera et al., 2002), marmosets (blue circles: Osmanski et al., 2013), and chinchillas (green squares: Niemiec et al., 1992). Interestingly, both the marmoset and chinchilla ERB and QERB are comparable to the human values and actually seem to suggest narrower spectral tuning than humans and macaques depending upon which data set and frequencies are being compared.
Table 4.
QERB values for individual monkeys and their mean.
| Frequency (kHz) | Monkey B | Monkey C | Monkey G | Monkey L | Mean (Std. Dev.) |
|---|---|---|---|---|---|
| 0.5 | 2.93 | 2.93 | 3.43 | 2.93 | 3.05 (0.25) |
| 1 | 3.93 | 4.00 | 4.30 | 3.68 | 3.98 (0.26) |
| 2 | 4.43 | 4.30 | 4.73 | 3.48 | 4.23 (0.54) |
| 4 | 4.93 | 4.73 | 4.75 | 4.68 | 4.77 (0.11) |
| 8 | 5.38 | 5.08 | 6.40 | 6.70 | 5.89 (0.78) |
| 16 | 8.15 | 8.00 | 6.23 | 6.63 | 7.25 (0.97) |
| 24 | 7.93 | 5.68 | 7.10 | 8.55 | 7.31 (1.2) |
| 32 | 12.50 | 11.33 | 10.30 | 11.53 | 11.41 (0.90) |
Note: QERB values obtained using filters estimated from 30 dB SPL/Hz maskers.
Fig. 7.
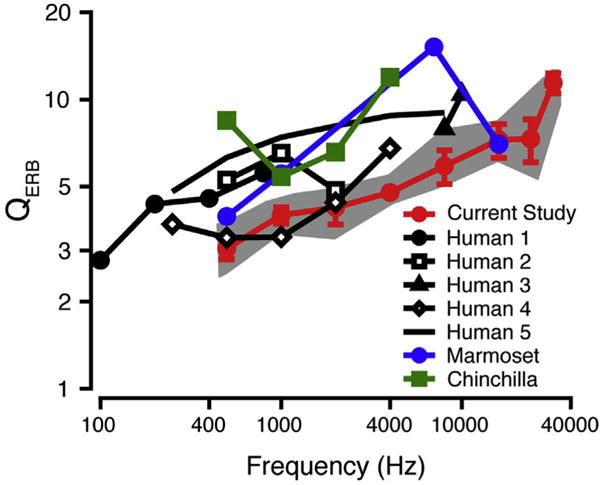
QERB as a function of frequency. Mean macaque behavioral QERB data (red circles; standard deviation error bars) are compared to behavioral QERB data for humans (black; filled circles (Human1): Moore et al., 1990; unfilled squares (Human2): Glasberg and Moore 1986; filled triangles (Human3): Shailer et al., 1990; unfilled diamonds (Human4): Desloge et al., 2012; solid line (Human5): Shera et al., 2002), marmosets (blue; Osmanski et al., 2013), and chinchillas (green; Niemiec et al., 1992). The gray shaded area shows the range of the macaque QERB values in the current study. (For interpretation of the references to colour in this figure legend, the reader is referred to the web version of this article.)
4. Discussion
This study provides a comprehensive description of behavioral auditory filters in nonhuman primates. Changes in filter shape and bandwidth according to frequency, noise masker level, and asymmetry were similar to those observed in humans and other non-primate species. Macaque filters were generally broader than those for humans, suggesting poorer frequency selectivity.
4.1. Effect of noise level and signal frequency on auditory filter shapes
The present study is one of the first to examine auditory filters across the audible frequency range of a species and to use sample frequencies across the audible range to check for frequency dependent effects of noise level or asymmetry. Macaque auditory filters were broader and more asymmetric at the higher masker level and at higher signal frequencies. The majority of previous studies site similar effects of noise level (e.g. Rosen and Stock, 1992; Patterson, 1971; Pick, 1980; Moore and Glasberg, 1987) and signal frequency (e.g. Weber, 1977; Pick, 1980; Rosen and Stock, 1992; Moore et al., 1990; Glasberg and Moore 1986; Shailer et al., 1990), though some report no effect of masker level on filter width (see Pick (1980) for further discussion). It is likely that methodological differences, such as masker type or stimulus frequency, or even the details of the task itself, contribute to these discrepancies, due to cochlear nonlinearity (Rosen and Stock, 1992; Lopez-Poveda and Eustaquio-Martín, 2013).
Humans and macaques have different audible frequency ranges: the macaque audible range is approximately 55 Hz-45 kHz (Pfingst et al., 1978; Stebbins et al., 1966), while humans can hear from 20 Hz to 20 kHz (Sivian and White, 1933; Hawkins and Stevens, 1950). The lowest tone thresholds of macaques are between 1 and 16 kHz (Pfingst et al., 1978; Dylla et al., 2013) whereas the lowest tone thresholds of humans are between 0.5 and 8 kHz (Sivian and White, 1933; Hawkins and Stevens, 1950). It is likely that frequency-specific characteristics of auditory filters will vary among species based on this difference. For example, Shailer et al. (1990) noted smaller ERB values at 8 and 10 kHz in humans than expected based on extrapolation of classical filter bandwidth values. However, this reduction from a linear relationship was not observed in the macaques in the current study until 16 kHz. The large variability across subjects in auditory filter shape observed at 8 and 10 kHz with increasing noise level in humans (Shailer et al., 1990) may also be related to the variable filter asymmetry and bandwidth with increasing noise levels we observed for our macaques at 16 kHz. Therefore, we suggest that similarities in frequency-specific filter effects may emerge if the species’ audible range is taken into account.
4.2. Describing macaque frequency selectivity
In evaluating an animal’s utility as a model for human hearing, one needs a basic understanding of the animal’s psychophysical auditory abilities, such as frequency selectivity (Fay, 1988). One previous review suggests that small laboratory animals, such as mice (Ehret, 1976), rats (Gourevitch, 1965), chinchillas (Niemiec et al., 1992), and cats (Nienhuys and Clark, 1979; Pickles, 1979), have broader auditory filters than humans (see Fig. 8 in Fay, 1988), which may implicate an evolutionary aspect of frequency selectivity. In contrast, a more recent review comparing only among data obtained using a fixed masker level suggests comparable tuning across mammals and birds (Ruggero and Temchin, 2005). A perfunctory comparison of our macaque data suggests broader tuning than for the human, marmoset, and chinchilla (see Fig. 7, all notched-noise data).
However, as described in the introduction, methodology is known to have a significant impact on estimates of frequency selectivity (Glasberg et al., 1984a; Niemiec et al., 1992; Eustaquio-Martín and Lopez-Poveda, 2011; Lopez-Poveda and Eustaquio-Martín, 2013), so data comparisons must be made sensibly. When comparing to one study that employed a similar fixed signal level methodology, our BW3dB, ERB and QERB values suggest that frequency selectivity is similar for monkeys and humans (e.g. Desloge et al., 2012). However, comparisons to most other human studies indicate sharper tuning for humans compared to macaques (e.g. Moore et al., 1990; Glasberg and Moore 1986).
Previous studies have compared frequency selectivity across species using comparisons across methodologies. For example, Shera et al. (2002) found lower QERB values for cats and guinea pigs than for humans using fixed signal level SFOAE measurements, indicating broader frequency selectivity in these animals (see their Fig. 1). While these data could be interpreted together due to the use of similar methodologies (though this is questioned in Lopez-Poveda and Eustaquio-Martín, 2013), they should be compared to the current behavioral data, obtained with a fixed masker level, with caution. QERB values calculated from our behavioral measurements in macaques were considerably lower than those obtained previously using SFOAEs and in ANF recordings (Joris et al., 2011; data not shown). When comparing human SFOAE data to human behavioral data, a similar disparity in QERB values obtained by behavioral and physiological methodologies was noted. However, the utility of this comparison is questionable, since the physiological estimates of frequency selectivity were obtained using a fixed signal level and the behavioral estimates were obtained using a fixed masker level (for a discussion of the problems with these comparisons, see Eustaquio-Martín and Lopez-Poveda, 2011; Lopez-Poveda and Eustaquio-Martín, 2013).
Some of the variation in estimates of frequency selectivity at high frequencies may also be a result of not taking into account the frequency response of the transducer (Moore et al., 1990; Shailer et al., 1990). In our study, calibrations were routinely performed to ensure that all signals and masking noises were presented at equivalent levels across subjects and testing sessions. Thus, the observed narrowing of filter bandwidths at high frequencies may reflect a true characteristic of the macaque auditory system. Previous work has suggested that a modified a priori notched-noise method yields more symmetrical, steep filters at high frequencies (10 kHz) by taking into account the middle ear transfer function (Glasberg and Moore, 1990, 2000; Kowalewski, 2014).
In summary, these data will serve as comparisons for ongoing physiological measures of frequency selectivity in single units along the auditory pathway. These investigations of neuronal frequency selectivity will contribute toward an understanding of the under-lying computations, circuitry, and transformations that generate perceptual frequency selectivity in normal hearing and hearing impaired subjects.
Acknowledgments
The authors would like to acknowledge Mary Feurtado for her assistance with the surgical procedures to prepare subjects for experiments, Bruce Williams and Roger Williams for building experimental hardware, and Corey Mondul for his assistance with data collection. The authors would like to acknowledge the helpful comments of Dr. B. C. J. Moore and two anonymous reviewers during the review of this manuscript. The authors would also like to acknowledge the National Institutes of Health for funding this research through the following grant support: R01 DC 011092 (PI: Ramnarayan Ramachandran) and T35 DC008763-08 (PI: Linda J. Hood).
References
- Bohlen P, Dylla M, Timms C, Ramachandran R. Detection of modulated tones in modulated noise by non-human primates. JARO. 2014;15:801–821. doi: 10.1007/s10162-014-0467-7. [DOI] [PMC free article] [PubMed] [Google Scholar]
- Desloge JG, Reed CM, Braida LD, Perez ZD, Delhorne LA. Auditory-filter characteristics for listeners with real and simulated hearing impairment. Trends Amplif. 2012;16(1):19–39. doi: 10.1177/1084713812445510. [DOI] [PMC free article] [PubMed] [Google Scholar]
- Dylla M, Hrnicek A, Rice C, Ramachandran R. Detection of tones and their modification by noise in nonhuman primates. J Assoc Res Otolaryngol. 2013;14:547–560. doi: 10.1007/s10162-013-0384-1. [DOI] [PMC free article] [PubMed] [Google Scholar]
- Ehret G. Critical bands and filter characteristics in the ear of the housemouse (Mus musculus) Biol Cybern. 1976;24:35–42. doi: 10.1007/BF00365592. [DOI] [PubMed] [Google Scholar]
- Eustaquio-Martín A, Lopez-Poveda EA. Isoresponse versus isoinput estimates of cochlear filter tuning. J Assoc Res Otolaryngol. 2011;12(3):281–299. doi: 10.1007/s10162-010-0252-1. [DOI] [PMC free article] [PubMed] [Google Scholar]
- Evans EF, Pratt SR, Cooper NP. Correspondence between behavioural and physiological frequency selectivity in the Guinea pig. Br J Audiol. 1989;23(2):151–152. [Google Scholar]
- Fay RR. Comparative psychoacoustics. Hear Res. 1988;34:295–306. doi: 10.1016/0378-5955(88)90009-3. [DOI] [PubMed] [Google Scholar]
- Fletcher H. Auditory patterns. Rev Mod Phys. 1940;12:47–65. [Google Scholar]
- Glasberg BR, Moore BCJ. Auditory filter shapes in forward masking as a function of level. J Acoust Soc Am. 1982;71:946–949. doi: 10.1121/1.387575. [DOI] [PubMed] [Google Scholar]
- Glasberg BR, Moore BCJ, Nimmo-Smith I. Comparison of auditory filter shapes derived with three different maskers. J Acoust Soc Am. 1984;75(2):536–544. doi: 10.1121/1.390487. [DOI] [PubMed] [Google Scholar]
- Glasberg BR, Moore BCJ, Patterson RD, Nimmo-Smith I. Dynamic range and asymmetry of the auditory filter. J Acoust Soc Am. 1984;76(2):419–427. doi: 10.1121/1.391584. [DOI] [PubMed] [Google Scholar]
- Glasberg BR, Moore BCJ. Auditory filter shapes in subjects with unilateral and bilateral cochlear impairments. J Acoust Soc Am. 1986;79(4):1020–1033. doi: 10.1121/1.393374. [DOI] [PubMed] [Google Scholar]
- Glasberg BR, Moore BCJ. Derivation of auditory filter shapes from notched-noise data. Hear Res. 1990;47:103–138. doi: 10.1016/0378-5955(90)90170-t. [DOI] [PubMed] [Google Scholar]
- Glasberg BR, Moore BCJ. Frequency selectivity as a function of level and frequency measured with uniformly exciting notched noise. J Acoust Soc Am. 2000;108:2318–2328. doi: 10.1121/1.1315291. [DOI] [PubMed] [Google Scholar]
- Gourevitch G. Auditory masking in the rat. J Acoust Soc Am. 1965;37(3):439–443. doi: 10.1121/1.1909348. [DOI] [PubMed] [Google Scholar]
- Gourevitch G. Detectability of tones in quiet and in noise by rats and monkeys. In: Stebbins WC, editor. Animal Psychoacoustics: the Design and Conduct of Sensory Experiments. Appleton-Century-Crofts; New York, NY: 1970. pp. 67–97. [Google Scholar]
- Hawkins JE, Stevens SS. The masking of pure tones and of speech by white noise. J Acoust Soc Am. 1950;22(1):6–13. [Google Scholar]
- Houtgast T. Auditory-filter characteristics derived from direct-masking data and pulsation-threshold data with a rippled-noise masker. J Acoust Soc Am. 1977;62(2):409–415. doi: 10.1121/1.381541. [DOI] [PubMed] [Google Scholar]
- Joris PX, Bergevin C, Kalluri R, McLaughlin M, Michelet P, van der Heijden M, Shera CA. Frequency selectivity in Old-World monkeys corroborates sharp cochlear tuning in humans. Proc Natl Acad Sci U S A. 2011;108(42):17516–17520. doi: 10.1073/pnas.1105867108. [DOI] [PMC free article] [PubMed] [Google Scholar]
- Kowalewski B. Modified notched-noise method for investigation of auditory filter shapes at high frequencies. Forum Acusticum. 2014 Retrieved from. http://www.fa2014.agh.edu.pl/fa2014_cd/article/RS/R17_11.pdf.
- Lopez-Poveda EA, Eustaquio-Martín A. On the controversy about the sharpness of human cochlear tuning. J Assoc Res Otolaryngol. 2013;14(5):673–686. doi: 10.1007/s10162-013-0397-9. [DOI] [PMC free article] [PubMed] [Google Scholar]
- Macmillan NA, Creelman CD. Detection Theory: a User’s Guide. second. Lawrence Erlbaum Associates; Mahwah, NJ: 2005. [Google Scholar]
- Moore BCJ, Glasberg BR. Auditory filter shapes derived in simultaneous and forward masking. J Acoust Soc Am. 1981;70(4):1003–1014. doi: 10.1121/1.386950. [DOI] [PubMed] [Google Scholar]
- Moore BCJ, Glasberg BR. Formulae describing frequency selectivity as a function of frequency and level, and their use in calculating excitation patterns. Hear Res. 1987;28:209–225. doi: 10.1016/0378-5955(87)90050-5. [DOI] [PubMed] [Google Scholar]
- Moore BCJ, Peters RW, Glasberg BR. Auditory filter shapes at low center frequencies. J Acoust Soc Am. 1990;88(1):132–140. doi: 10.1121/1.399960. [DOI] [PubMed] [Google Scholar]
- Niemiec AJ, Yost WA, Shofner WP. Behavioral measures of frequency selectivity in the chinchilla. J Acoust Soc Am. 1992;92(5):2636–2649. doi: 10.1121/1.404380. [DOI] [PubMed] [Google Scholar]
- Nienhuys TGW, Clark GM. Critical bands following the selective destruction of cochlear inner and outer hair cells. Acta Otolaryngol. 1979;88:350–358. doi: 10.3109/00016487909137179. [DOI] [PubMed] [Google Scholar]
- Osmanski MS, Song X, Wang X. The role of harmonic resolvability in pitch perception in a vocal nonhuman primate, the common marmoset (Callithrix jacchus) J Neurosci. 2013;33(21):9161–9168. doi: 10.1523/JNEUROSCI.0066-13.2013. [DOI] [PMC free article] [PubMed] [Google Scholar]
- Oxenham AJ, Simonson AM. Level dependence of auditory filters in nonsimultaneous masking as a function of frequency. J Acoust Soc Am. 2006;119(1):444–453. doi: 10.1121/1.2141359. [DOI] [PMC free article] [PubMed] [Google Scholar]
- Patterson RD. Effect of amplitude on auditory filter shape. J Acoust Soc Am. 1971;49(1A):81. [Google Scholar]
- Patterson RD, Nimmo-Smith I, Weber DL, Milroy R. The deterioration of hearing with age: frequency selectivity, the critical ratio, the audiogram, and speech threshold. J Acoust Soc Am. 1982;72(6):1788–1803. doi: 10.1121/1.388652. [DOI] [PubMed] [Google Scholar]
- Patterson RD, Nimmo-Smith I. Off-frequency listening and auditory filter asymmetry. J Acoust Soc Am. 1980;67(1):229–245. doi: 10.1121/1.383732. [DOI] [PubMed] [Google Scholar]
- Pfingst BE, Laycock J, Flammino F, Lonsbury-Martin B, Martin G. Pure tone thresholds for the rhesus monkey. Hear Res. 1978;1:43–47. doi: 10.1016/0378-5955(78)90008-4. [DOI] [PubMed] [Google Scholar]
- Pick GF. Level dependence of psychophysical frequency resolution and auditory filter shape. J Acoust Soc Am. 1980;68(4):1085–1095. doi: 10.1121/1.384979. [DOI] [PubMed] [Google Scholar]
- Pickles JO. Psychophysical frequency resolution in the cat as determined by simultaneous masking and its relation to auditory-nerve resolution. J Acoust Soc Am. 1979;66(6):1725–1732. doi: 10.1121/1.383645. [DOI] [PubMed] [Google Scholar]
- Rosen S, Stock D. Auditory filter bandwidths as a function of level at low frequencies (125 Hz – 1 kHz) J Acoust Soc Am. 1992;92(2):773–781. doi: 10.1121/1.403946. [DOI] [PubMed] [Google Scholar]
- Rosen S, Baker RJ, Darling A. Auditory filter nonlinearity at 2 kHz in normal hearing listeners. J Acoust Soc Am. 1998;103(5):2539–2550. doi: 10.1121/1.422775. [DOI] [PubMed] [Google Scholar]
- Ruggero MA, Temchin AN. Unexceptional sharpness of frequency tuning in the human cochlea. Proc Natl Acad Sci U S A. 2005;102(51):18614–18619. doi: 10.1073/pnas.0509323102. [DOI] [PMC free article] [PubMed] [Google Scholar]
- Shailer MJ, Moore BCJ, Glasberg BR, Watson N, Harris S. Auditory filter shapes at 8 and 10 kHz. J Acoust Soc Am. 1990;88(1):141–148. doi: 10.1121/1.399961. [DOI] [PubMed] [Google Scholar]
- Shera CA, Guinan JJ, Oxenham AJ. Revised estimates of human cochlear tuning from otoacoustic and behavioral measurements. Proc Natl Acad Sci U S A. 2002;99(5):3318–3323. doi: 10.1073/pnas.032675099. [DOI] [PMC free article] [PubMed] [Google Scholar]
- Sivian LJ, White SD. On minimum audible sound fields. J Acoust Soc Am. 1933;4(4):288–321. [Google Scholar]
- Stebbins WC, Green S, Miller FL. Auditory sensitivity of the monkey. Science. 1966;153(3744):1646–1647. doi: 10.1126/science.153.3744.1646-a. [DOI] [PubMed] [Google Scholar]
- Tyler RS, Hall JW, Glasberg BR, Moore BCJ. Auditory filter asymmetry in the hearing impaired. J Acoust Soc Am. 1984;76(5):1363–1368. doi: 10.1121/1.391452. [DOI] [PubMed] [Google Scholar]
- Weber DL. Growth of masking and the auditory filter. J Acoust Soc Am. 1977;62(2):424–429. doi: 10.1121/1.381542. [DOI] [PubMed] [Google Scholar]


