Key Points
Five Hb variants were identified in the Uganda Sickle Surveillance Study with nonuniform distribution across the country.
Recognition of IEF patterns and molecular techniques provide an algorithm for the diagnosis of hemoglobin variants in sub-Saharan Africa.
Abstract
The Uganda Sickle Surveillance Study analyzed dried blood spots that were collected from almost 100 000 infants and young children from all 10 regions and 112 districts in the Republic of Uganda, with the primary objective of determining the prevalence of sickle cell trait and disease. An overall prevalence of 13.3% sickle cell trait and 0.7% sickle cell disease was recently reported. The isoelectric focusing electrophoresis technique coincidentally revealed numerous hemoglobin (Hb) variants (defined as an electrophoresis band that was not Hb A, Hb F, Hb S, or Hb C) with an overall country-wide prevalence of 0.5%, but with considerable geographic variability, being highest in the northwest regions and districts. To elucidate these Hb variants, the original isoelectric focusing (IEF) gels were reviewed to identify and locate the variant samples; corresponding dried blood spots were retrieved for further testing. Subsequent DNA-based investigation of 5 predominant isoelectric focusing patterns identified 2 α-globin variants (Hb Stanleyville II, Asn78Lys; Hb G-Pest, Asp74Asn), 1 β-globin variant (Hb O-Arab, Glu121Lys), and 2 fusion globin variants (Hb P-Nilotic, β31-δ50; Hb Kenya, Aγ81Leu-β86Ala). Compound heterozygotes containing an Hb variant plus Hb S were also identified, including both Hb S/O-Arab and HbS/Kenya. Regional differences in the types and prevalence of these hemoglobin variants likely reflect tribal ancestries and migration patterns. Algorithms are proposed to characterize these Hb variants, which will be helpful for emerging neonatal hemoglobinopathy screening programs that are under way in sub-Saharan Africa.
Visual Abstract
Introduction
A partnership between the Uganda Ministry of Health, Makerere University, and Cincinnati Children’s Hospital Medical Center (CCHMC) was established to design and conduct the Uganda Sickle Surveillance Study (US3), a prospective study that assessed the current burden of sickle cell disease (SCD) at the national level. Between February 2014 and March 2015, nearly 100 000 dried blood spot (DBS) samples collected from infants and young children in all 10 regions and 112 districts in the Republic of Uganda for the country’s Early Infant Diagnosis HIV program were reanalyzed by hemoglobin (Hb) isoelectric focusing (IEF) to detect sickle cell trait and SCD. The recently published results documented an overall national prevalence of 13.3% sickle trait and 0.7% SCD, but with considerable regional variability.1 Subsequently, a targeted neonatal screening program has begun in the highest burden districts in the central and northern regions, along with increased emphasis on clinical care and training as part of an emerging national sickle cell strategy for Uganda.
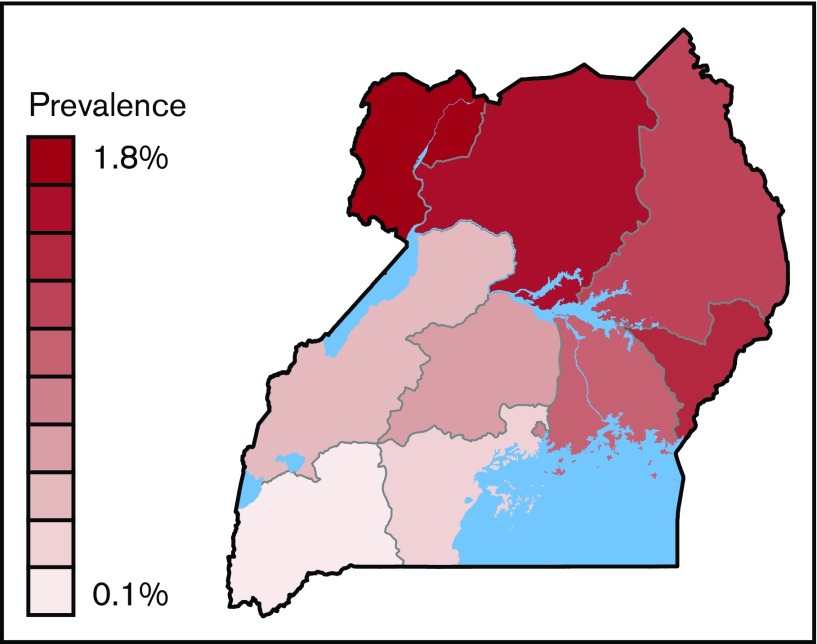
In addition to establishing the prevalence of sickle cell trait and SCD, the DBS samples in the US3 study were scored as Hb variants if the IEF pattern revealed at least 1 band that was clearly distinct from Hb A, Hb F, Hb S, or Hb C. The overall study prevalence of these Hb variants was 0.5% with substantial geographic variability across the country, ranging from 0.1% of samples in the South Western Region to 1.8% in the West Nile Region.1
Given the migratory history and tribal structure of Uganda’s population, we hypothesized that individual Hb variants would differ across the country, but would likely be clustered by region. Defining their clinical importance, either in the heterozygous state with normal Hb A or in the compound heterozygous state with Hb S, would require molecular identification of individual variants. In the current report, we describe the elucidation and geospatial mapping of the 5 most commonly observed Hb variants found in the US3 study. Our results allow the creation of algorithms to assist the identification of common IEF-based Hb variants, which are relevant for emerging hemoglobinopathy screening programs in sub-Saharan Africa.
Methods
Variant samples
The acquisition, laboratory techniques, and analysis of DBS samples for the US3 study were previously described in detail.1,2 For each DBS sample, the Hb pattern on IEF electrophoresis was scored as normal, trait, disease, or variant; the latter designation required the presence of at least 1 IEF band that did not correlate to the Hb A, Hb F, Hb S, or Hb C controls that were run on each gel and consensus by 2 independent reviewers. Samples that contained sickle Hb and variant Hb were designated as disease, given the potential for clinical manifestations. Following completion of the US3 study, a secondary objective was the elucidation of Hb variants. The US3 database was queried to locate samples scored as variants. Samples were transported as deidentified specimens to CCHMC for further laboratory analysis. Subsequent Hb and genetic analyses were performed with oversight from an institutional review board–approved protocol at both CCHMC and Makerere University.
HPLC analysis
Each Hb variant was first investigated using high-performance liquid chromatography (HPLC) to establish the Hb pattern and allow comparison with known published variants using a previously established method.3 After 50 μL of freshly prepared Mobile Phase A (Bis-Tris with potassium cyanide) was added to 2 3-mm punches from each DBS, the samples were incubated at room temperature for 60 minutes and then centrifuged at 13 000g for 3 minutes. The eluted Hb was pipetted into a Waters 150-μL insert and placed in a 12 × 32 mm glass vial. Samples were analyzed on a PolyCAT A cation exchange column (PolyLC, Inc., Columbia, MD) using an Alliance Separation Module (model 2690/2695, Waters Corporation, Milford, MA). Absorbance was detected at 405 nm using a Waters dual wavelength absorbance detector and the data analyzed using Empower software (Waters Corporation). Assay controls included a Hb retention time control (AFSC Control, Helena Laboratories, Beaumont, TX) and Hb quantitation controls (Lyphocheck Hemoglobin A2 Control levels 1 and 2; Bio-Rad Laboratories, Hercules, CA).
Description of techniques for DNA-based confirmation and findings
Genomic DNA was isolated from two 3 mm punches, following a protocol from Instagene (Bio-Rad Laboratories) that was adapted for DNA extraction from DBS samples. The primary modifications include initial suspension in 1 mL of PBS 0.1% Tween (Sigma-Aldrich, St. Louis, MO), and addition of 65 μL of Instagene Matrix. The purified DNA was not quantified before use in polymerase chain reaction (PCR)-based methods because of low concentration. For each Hb variant sample, the predicted globin exons were first amplified using flanking primers, followed by direct Sanger sequencing of the PCR products for confirmation. After each particular missense mutation or fusion protein was identified, a more rapid PCR-based technique was developed using TaqMan probes or restriction fragment length polymorphisms (RFLPs). PCR primers and conditions for Hb variants are included in supplemental Table 1.
In each assay, the PCR reaction was performed in 25 μL volume, containing 2.5 μL of DNA, 22.5 μL of PCR mix including 0.25 μL of nucleotides (dNTP Pharmacia 10 μM final), 2.5 μL 10X Buffer (Qiagen, Hilden Germany), 2 μM of each primer, and 1.25 U Hot Star Taq Polymerase (Qiagen). A negative control (water), PCR-positive control, and positive control (DNA sample confirmed by Sanger sequencing) were included in each assay. Amplification of the β-globin gene was performed using forward (5′-GGT TGG GAT AAG GCT GGA TT-3) and reverse (5′-TTT GCA GCC TCA CCT TCT TT-3′) primers. Hb S mutation (Glu6Val) was evaluated by TaqMan (rs334) wherein 1 μL of PCR product was added to 6 μL 2X Genotyping master mix, 0.6 μL probe mix, and water according to the manufacturer’s recommendation (Applied Biosystems, Foster City, CA). Amplification of α-globin genes was performed using forward primer (5′-CCC GCG CCC CAA GCA TAA AC-3′) with unique reverse primers for α-1 (5′-CTG GCA CGT TTG CTG AGG GAA AA-3′) and α-2 (5′-GGCACATTCCGGGATAGAGA-3′).
Hb Stanleyville II.
The Hb Stanleyville II variant was confirmed by PCR (supplemental Table 1) and RFLP with restriction enzyme AfeI. Products were digested by adding 10 μL of PCR product to 10 μL of digest mix (including 2 μL 10X NEB Cut Smart Buffer, 0.4 μL AfeI; New England BioLabs, Ipswich, MA). The sample was digested for 3 hours at 37°C followed by heat inactivation 75°C for 20 minutes. The samples were resolved on a 3% agarose gel with wild-type (WT) remaining uncut with a single band at 681 base pair (bp) present. Samples that have Hb Stanleyville II will digest into products of 483 bp and 198 bp, and heterozygous samples will have both uncut 681 bp and cut products of 483 bp and 198 bp.
Hb G-Pest.
This variant was confirmed by PCR (supplemental Table 1) and customized TaqMan probe (rs28928875) in a method similar to detection of Hb S (rs334).
Hb O-Arab.
This variant was confirmed by PCR (supplemental Table 1) and RFLP analysis with the restriction enzyme EcoRI (0.3 μ, New England BioLabs) in a method identical to Hb Stanleyville II. The samples were resolved on a 1% agarose gel with Hb O-Arab remaining uncut with a single band at 1780 bp, whereas WT samples are digested into 2 bands of 1418 bp and 362 bp. Heterozygous samples will have both uncut 1780 bp and digested products of 1418 bp and 362 bp.
Hb Kenya.
The Hb Kenya variant was confirmed by allele-specific gap PCR (supplemental Table 1).4 The PCR product was resolved on a 1% agarose gel. Both mutant (209 bp) and WT were identified in affected samples, indicating heterozygosity for this mutation.
Hb P-Nilotic.
This variant was confirmed by Hb P-Nilotic allele-specific gap PCR (supplemental Table 1). The PCR product was resolved on a 1% agarose gel. Both mutant (824 bp) and WT (923 bp) were identified in affected samples, indicating heterozygosity for this mutation.
Results
Variant prevalence
The country-wide prevalence of Hb variants was 0.5%, ranging from 0.1% of samples collected in the South Western Region to 1.8% in the West Nile Region (Figure 1).1 Variants were detected in 94 of 112 districts, exceeding 1.0% in 22 districts, and were most prevalent in the Arua (2.7%), Alebtong (2.9%), and Adjumani (2.9%) districts in the West Nile region of Uganda.
Figure 1.
Prevalence of variants in 10 regions in Uganda. Prevalence ranged from 1.76% (West Nile) to 0.12% (South Western).
Variant analysis
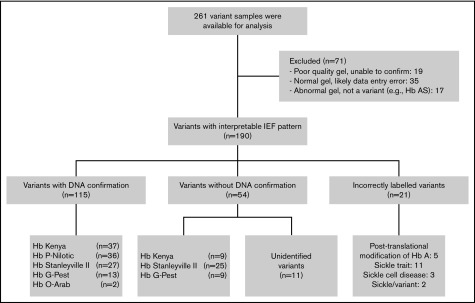
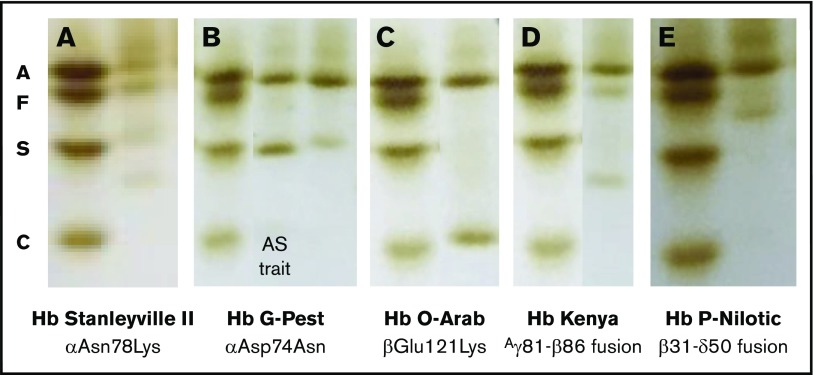
During the study period, 458 samples were identified as an Hb variant (Figure 2). After study completion, 261 variants were available for analysis, with 71 excluded for several reasons including absent or poor quality IEF image, database errors, or transcription errors (eg, mismatch of the sample number or not scored as a variant on the IEF worksheet). A total of 190 DBS samples with variant Hb bands on IEF were located, retrieved, and then evaluated using DNA-based techniques. DNA confirmation of the Hb variant was obtained in 135 samples, but was not possible in another 43 because of sample degradation; as a result, their classification was based on IEF alone. Five common IEF patterns were observed and investigated further (Figure 3).
Figure 2.
Flow diagram depicting the flow of samples through analysis.
Figure 3.
Composite of isoelectric focusing images of 5 predominant hemoglobin variants. Each sample is paired with the AFSC standard. (A) Hb Stanleyville II; (B) sickle trait (middle lane), Hb G-Pest (right lane); (C) Hb O-Arab; (D) Hb Kenya; (E) Hb P-Nilotic.
The first variant pattern, observed in 30% of the samples, included a variant IEF band located above Hb S with reduced intensity compared with Hb A. When these variant samples also contained Hb F, an additional band was observed below Hb S (Figure 3A). HPLC analysis included a new peak between Hb A and Hb A2 as a broad peak (data not shown). DNA sequencing revealed a heterozygous A>C mutation within exon 2 of the α-2 gene locus, corresponding to missense Asn78Lys (Hb Stanleyville II), a known α-chain variant. For more rapid diagnosis, PCR amplification of the exon followed by digestion with the AfeI restriction enzyme yielded a distinct pattern for detection of both heterozygotes and homozygotes (data not shown). Hb Stanleyville II was confirmed in 27 samples and presumed based on the IEF pattern in 25 samples.
The second variant pattern, observed in 10% of samples, included a new IEF band located just above Hb S, with reduced intensity compared with Hb A (Figure 3B). In samples containing substantial amounts of Hb F, an additional faint band was observed below Hb S (not shown). HPLC analysis included a peak with the same retention time as Hb S and in a ratio to Hb A typically observed with α-chain variants (supplemental Figure 1A). DNA sequencing revealed a heterozygous G>A mutation within exon 2 of the α-1 gene locus, corresponding to missense Asp74Asn (Hb G-Pest), a known α-chain variant. For rapid diagnosis, PCR primers and a TaqMan probe were designed to detect this specific mutation. Hb G-Pest was confirmed in 13 samples and presumed based on IEF pattern in 9 samples; all presumed samples were confirmed to be negative for sickle cell trait.
The third variant pattern, observed in only 1% of the samples, included a new IEF band located just above Hb C, but with equivalent intensity as Hb A (Figure 3C). HPLC analysis demonstrated a peak with the same retention time as Hb C (supplemental Figure 1B). DNA sequencing revealed a heterozygous G>A mutation within exon 3 of the β-globin gene locus, corresponding to missense Glu121Lys (Hb O-Arab), a known β-chain variant. For rapid diagnosis, PCR primers and an EcoRI digest was designed. Two variant samples were confirmed as Hb O-Arab.
The fourth variant pattern, observed in 27% of the IEF samples, was a distinct band between Hb S and Hb C, and always less intense than Hb A (Figure 3D). All of the samples with this pattern had identifiable Hb F. On HPLC, the variant Hb had the same retention time as Hb A (supplemental Figure 1C). The fusion gene Aγ81Leu-β86Ala (Hb Kenya) was identified via gap PCR4; this Hb is a known fusion product between the γ-globin and β-globin gene locus. Hb Kenya was confirmed in 36 samples and presumed based on IEF in 9 additional samples.
The fifth variant pattern, observed in 21% of IEF samples, had a single IEF band below HbF and slightly decreased in intensity compared with Hb A (Figure 3E). On HPLC, the variant eluted as a small peak between Hb A and Hb A2 (supplemental Figure 1D). Complete sequencing of the α- and β-globin genes revealed no missense mutations. PCR primers were then prepared to amplify fusion genes, and products were identified and sequenced. A fusion product corresponding to β31-δ50 was identified (Hb P-Nilotic), which is a recognized hybrid variant between the β-globin and δ-globin locus. A gap PCR method was designed for rapid diagnosis. A total of 36 samples were DNA-confirmed as Hb P-Nilotic.
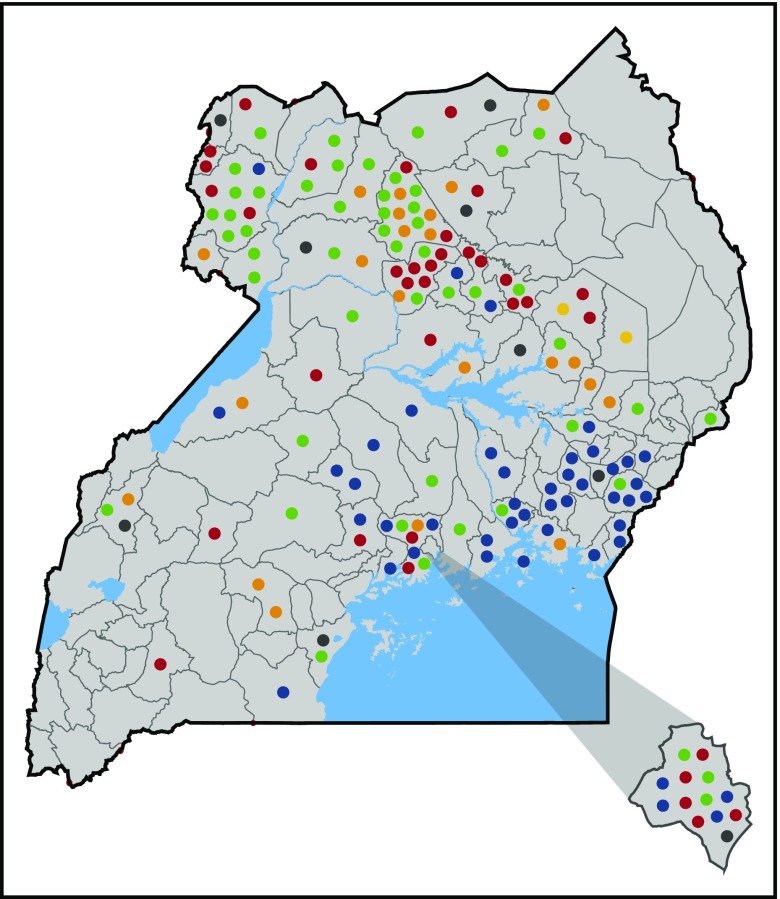
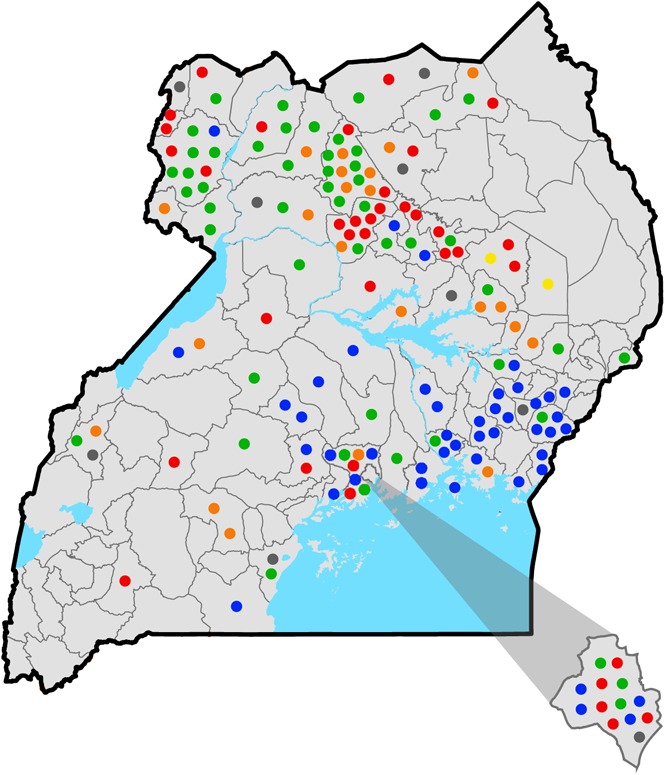
These 5 Hb variants accounted for 83% of the tested DBS samples. In most cases, their location in the country was nonuniform but clustered geographically (Figure 4). For example, Hb P-Nilotic was found primarily in the northern districts of Uganda, whereas Hb Kenya and Hb O-Arab were primarily observed in the eastern districts. In contrast, Hb Stanleyville II and Hb G-Pest were identified throughout the country. In the West Nile region, which had the highest prevalence of Hb variants, Hb Stanleyville II and Hb P-Nilotic were the most predominant, accounting for 86% of variants in this region.
Figure 4.
District map of Uganda illustrating type and distribution of hemoglobin variants. Each circle represents an individual variant. The district of Kampala is depicted in the lower right corner. Blue circles, Hb Kenya; red circles, Hb P-Nilotic; orange circles, Hb G-Pest; green circles, Hb Stanleyville II; yellow circles, Hb O-Arab; gray circles, unidentified variants.
Additional DBS samples that contained potential Hb variants were investigated, but specific mutations could not be identified (Figure 2). There were 16 samples incorrectly labeled as variant, including 11 that were confirmed as sickle cell trait, 3 as homozygous SS disease, and 5 with a band reflecting posttranslational modifications of Hb A. Two samples contained Hb S plus a variant and should have been designated as disease. Eleven variants remain unidentified, including several suspected γ-chain variants; however, their identity could not be confirmed because of degraded Hb and DNA. These unidentified variants were dispersed geographically.
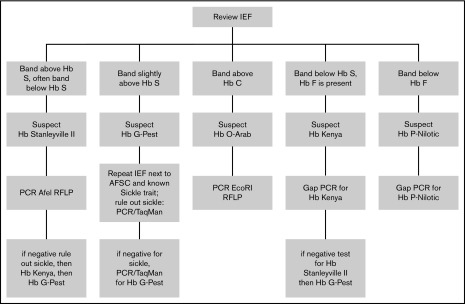
After characterizing the most common variants, a diagnostic algorithm was created to aid the recognition and confirmation of Hb variants (Figure 5). This algorithm was designed to incorporate exportable techniques including gap PCR, RFLP, and TaqMan that may be available in a developing molecular laboratory, rather than more advanced techniques used by a clinical hemoglobinopathy laboratory.
Figure 5.
Diagnostic algorithm for confirming hemoglobin variants.
Discussion
With increasing awareness of the contribution of SCD to infant and under-5 mortality rates, hemoglobinopathy screening pilot programs have now been initiated in several African countries, with the primary goal of identifying affected children for early intervention. Programs in Burkina Faso, Benin, Liberia, Angola, Democratic Republic of Congo, and Uganda have used IEF as the primary method of detecting pathological Hb variants, especially Hb S and Hb C. Variant Hb variants are inevitably identified during screening, although there have been no studies published regarding the types and frequency of these non-sickle Hb variants.2,5-8 In a prospective newborn screening cohort in Luanda, Angola, variant Hb variants (not including Hb C) were detected in 0.07% of samples, although specific variants were not elucidated.2 A screening program in the Democratic Republic of Congo included 31 204 infants but did not report any variants by IEF.8 Variants appear similarly rare in West Africa, with variants detected in 3/2341 screened individuals in Burkina Faso (1 Hb O, 1 Hb E, 1 other variant),5 and 5/2785 screened individuals in Liberia (all suspected but unproven α-chain variants).7 A retrospective review of Hb electrophoresis performed on 27 530 individuals in Togo between 1996 and 2010 identified 20 variants (10 Hb K-Woolwich, 7 Hb Korle-Bu, 1 Hb J-Lome, 1 Hb Lepore, 1 Hb G-Philadelphia).9 Other studies have also reported a small number of Hb variants.10-12
Hb variants are probably relatively common in Africa and several hundred have been described in published studies. The largest study of Hb variants in sub-Saharan Africa was an analysis of Hb variants from 1800 individuals in western Kenya; this nonrandom study population included hospitalized patients, medical staff, and hematology clinic outpatients.13 Using cellulose acetate and citrate agar electrophoresis, numerous Hb variants were identified, including Hb Stanleyville II, Hb P-Nilotic, Hb Kenya, Hb O-Arab, Hb J-Nyanza (αAla21Asp), and δ-globin variants Hb Babinga (Gly136Asp), Hb A2′ (Gly16Arg), and Hb Flatbush (Ala22Glu); genotype frequencies were not reported because it was a nonrandom population.13 It is likely that Hb variants may be found at higher frequencies in individuals from particular tribes; for example, investigations of the Hawazma tribe in Western Sudan identified Hb O-Arab at 1% and Hb Khartoum at 3% frequency, whereas the same variants were not present in the Nubu tribe.14 Hb E has been described sporadically in Congo15 and in individuals of mixed African-Asian heritage in South Africa and other nations.16 The γ-chain variants are expected to be common in neonates, with Hb F-Sardinia approaching a frequency of 7.5% in the Republic of Congo.17
Five predominant patterns of Hb variants were identified in the Ugandan population. Identification and geospatial mapping of variants confirmed our hypothesis that the distribution of Hb variants was nonuniform across regions of Uganda. Our findings confirm that Hb Kenya is primarily found in the eastern part of Uganda and around Lake Victoria (Figure 4).4,13 Samples collected in major cities, including the capital city of Kampala, tended to have numerous variants, reflecting migration from rural regions to the urban setting. There was not a direct correlation between districts with the highest prevalence of SCD and trait and prevalence of Hb variants.1 It is unclear, therefore, why these Hb variants exist at such a high prevalence, and what, if any, survival advantage or risk they offer.
Hb Stanleyville II is a structural α-globin chain variant caused by a single amino acid substitution (Asn78Lys) in the second exon of α-2. Its geographic distribution encompasses many regions of Africa including Uganda, the Democratic Republic of Congo, Sudan, Kenya, and Angola, but is not restricted to these areas, reflecting worldwide African migration.18,19 It has been described in non-African individuals as well, suggesting several points of origin.19,20 In many cases, this Hb variant is found in association with –α3.7-thalassemia (rightward) deletion.19 Historically, Hb Stanleyville II has not been shown to impact hematological indices or clinical phenotype when occurring in isolation.19,21
Hb G-Pest is an α-chain variant that is the result of a single base substitution (Asp74Asn) in the second exon of α-1. Hb G-Pest was first identified in conjunction with another α-chain variant—Hb J-Buda—and helped demonstrate the presence of 2 α-globin genes.22 This is the first report of its occurrence in sub-Saharan Africa, having previously described in Brazil, Hungary, and India.22,23 Previous case reports have not identified any hematological or clinical aberrations.23
Hb O-Arab accounted for 1% of variant samples in our study and has previously been described throughout northern, eastern, and western Africa; the Middle East; and the Balkans.24 Heterozygotes are asymptomatic with mild microcytosis and anemia, but disease manifestations may occur when coinherited with Hb S, Hb C, or β-thalassemia.25,26 Individuals who are homozygous for Hb O-Arab may have mild microcytic anemia, although those with symptomatic recurrent anemia and jaundice have been described.25,27
Hb Kenya accounted for 27% of all variants and predominates in the eastern regions of Uganda. Hb Kenya was first described in the Luo people in western Kenya in 1972, with an estimated prevalence of up to 1% in the Lake Victoria region.13,28 Several cases have previously been reported in Uganda.4,13,29 The reason for the relatively high prevalence of this mutation is unclear. Hb Kenya is made of 2 α-globin chains and 2 non–α-variant chains and is the result of a 22.7-kb deletion from the 3′ end of the Aγ-globin gene to the 5′ end of the β-globin gene, which reflects nonhomologous crossover. Hb Kenya is considered a form of hereditary persistence of fetal Hb resulting from elevated Hb F levels.13 In the largest cohort of Hb Kenya heterozygotes, individuals had varying levels of Hb F (5%-28%; mean, 10.2%) and Hb Kenya (5.7%-23.4%; mean, 13.4%).30 Heterozygotes are typically asymptomatic; however, further correlation regarding impact on hematologic indices is needed because many previously studied individuals had concomitant iron deficiency and α-thalassemia. To date, neither a homozygote for Hb Kenya nor an individual with the proposed “anti-Kenya” β-γ fusion has been identified.13,28
Hb P-Nilotic, an anti-Lepore Hb, has been described in individuals in Kenya, the Sudan, and the former Belgian Congo as well as kinships in Mexico and Turkey.31-33 Hb P-Nilotic is a βδ fusion that results from a 54-bp nondeletional crossover event between β31 and δ50, creating a fusion gene. Heterozygotes are asymptomatic.31 In a cohort of 7 individuals heterozygous for Hb P-Nilotic, the mean variant Hb was 17% to 18% of total Hb.31 No homozygotes have been reported.
Variants that have isoelectric points similar to Hb S deserve special attention because they can lead to false diagnosis of SCD or trait. Given the proximity to the Hb S band on IEF, it is quite possible that many individuals with Hb Stanleyville II or Hb G-Pest are misdiagnosed as having sickle cell trait (Figure 2).34 On HPLC, Hb G-Pest has the same retention time as Hb S (supplemental Figure 1A), illustrating the need for DNA-based confirmation and the advantage of using complementary methods. In lieu of DNA-based confirmation, we advise IEF samples with an Hb variant be repeated adjacent to a confirmed sickle cell trait sample and standard controls with HbA, HbF, HbS, and HbC to guide the identification.
Compound heterozygosity with variant Hb and the Hb S mutation can be expected, with the resulting hematological phenotype to be determined in most cases.31 Although not included in our analysis, we identified several individuals with compound heterozygosity with Hb S/O-Arab and Hb S/Kenya. Individuals with compound heterozygotes for Hb S/O-Arab have disease manifestations and complications similar to homozygous Hb SS disease.26 Individuals with Hb S/Kenya may be asymptomatic because of the antisickling effect of Hb F.30,31 The combined amounts of Hb Kenya and Hb F in Hb S/Kenya heterozygotes is 30% or greater and might account for their asymptomatic phenotype.30 This protective effect may be reduced in the setting of iron deficiency, in which there is preferential production of Hb S over Hb F and Hb Kenya, which may lead to symptoms.35 There is significant variability in Hb F production in individuals with Hb Kenya,30 and it is likely that the clinical phenotype reflects that variability, and this rare compound heterozygous state needs further study. Compound heterozygosity for Hb S and Hb P-Nilotic has been reported in a Ugandan child, with Hb S levels of 39%, similar to other S heterozygotes.31 Although not identified in our analysis, Hb Stanleyville II has been reported in association with Hb SS, showing 3 major bands in addition to Hb A and F: a band in the position of Hb S (αβS + αStanleyville IIβA), a second band between S and C (αStanleyville IIγA), and a faint band at the C position (αStanleyville IIβS).19 Hb Stanleyville II occurring with homozygous SS disease may moderate the disease phenotype by reducing Hb polymerization and increased mechanical stability18,36; however, extrapolations regarding hematological or clinical significance are premature.18,34,37
This study had several limitations, including inability to confirm all variants by DNA analysis because of sample degradation, and lack of accompanying red cell indices, clinical information, and family demographic information. In general, the quality of HPLC from DBS samples compared with whole blood controls was reduced, and no δ-globin variants, commonly identified based on HPLC alone, were identified.13 Because variants that contained sickle Hb were designated as “disease” in the database, we cannot extrapolate prevalence of variants occurring in conjunction with Hb S. Finally, Hb variants identified in Uganda cannot be generalized across all of sub-Saharan Africa; however, it is likely that similar variants are present in neighboring countries.
As newborn screening efforts for SCD increase in sub-Saharan Africa, recognition and correct identification of common Hb variants, particularly those that may be mistaken for Hb S, will reduce repetitive testing and improve testing accuracy. Our diagnostic algorithm can help identify the most common variants, recognizing its limitations for infants who have high levels of HbF and numerous aberrant bands. This algorithm should serve as a useful reference for Uganda and other emerging screening programs across sub-Saharan Africa.
Supplementary Material
The full-text version of this article contains a data supplement.
Acknowledgments
The authors thank Raymond Mugabe, Priscilla Khainza, Stephen Aeko, Mercy Nabunnya, Monirah Namutebi, Maria Apollo, the US3 clinical investigators and research staff, the staff of the Cincinnati Children’s Hospital Medical Center Erythrocyte Diagnostic Laboratory, Matt Wollman for geospatial mapping, and Justin McAdams for assistance with images.
The Uganda Sickle Surveillance Study was supported by the Cincinnati Children’s Research Foundation. This work was supported by grants from the National Institutes of Health Center Cores National Institute of Diabetes and Digestive and Kidney Diseases (grant P30 DK090971) and the Doris Duke Charitable Foundation (grants 2015132 and 2010036) (R.E.W.).
Authorship
Contribution: B.A.S and T.A.H. performed experiments and wrote the manuscript. B.A.S performed data analysis and prepared figures. M.C.P. helped with high-performance liquid chromatography analysis and wrote the manuscript. C.K., G.N., A.G.H., J.R.A., C.M.N., and I.S. designed the study and reviewed the manuscript. R.E.W. supervised the study and wrote the manuscript.
Conflict-of-interest disclosure: R.E.W. is a consultant for Bayer Pharmaceuticals, Nova Laboratories, and Global Blood Therapeutics and receives research support from Bristol-Myers Squibb, Addmedica, and Biomedomics Inc.
Correspondence: Russell E. Ware, Cincinnati Children’s Hospital Medical Center, 3333 Burnet Ave, Cincinnati OH 45229; e-mail: russell.ware@cchmc.org.
References
- 1.Ndeezi G, Kiyaga C, Hernandez AG, et al. . Burden of sickle cell trait and disease in the Uganda Sickle Surveillance Study (US3): a cross-sectional study. Lancet Glob Health. 2016;4(3):e195-e200. [DOI] [PubMed] [Google Scholar]
- 2.McGann PT, Ferris MG, Ramamurthy U, et al. . A prospective newborn screening and treatment program for sickle cell anemia in Luanda, Angola. Am J Hematol. 2013;88(12):984-989. [DOI] [PubMed] [Google Scholar]
- 3.Ou CN, Rognerud CL. Rapid analysis of hemoglobin variants by cation-exchange HPLC. Clin Chem. 1993;39(5):820-824. [PubMed] [Google Scholar]
- 4.Han ZJ, Lapuz C, Rovenger JF, et al. . Compound heterozygosity for Hb S [β6(A3)Glu→Val] and Hb Kenya (Aγ81Leu-β86Ala) in a Ugandan woman. Hemoglobin. 2012;36(3):270-275. [DOI] [PubMed] [Google Scholar]
- 5.Kafando E, Nacoulma E, Ouattara Y, et al. . Neonatal haemoglobinopathy screening in Burkina Faso. J Clin Pathol. 2009;62(1):39-41. [DOI] [PubMed] [Google Scholar]
- 6.Rahimy MC, Gangbo A, Ahouignan G, Alihonou E. Newborn screening for sickle cell disease in the Republic of Benin. J Clin Pathol. 2009;62(1):46-48. [DOI] [PubMed] [Google Scholar]
- 7.Tubman VN, Marshall R, Jallah W, et al. . Newborn Screening for Sickle Cell Disease in Liberia: a pilot study. Pediatr Blood Cancer. 2016;63(4):671-676. [DOI] [PMC free article] [PubMed] [Google Scholar]
- 8.Tshilolo L, Aissi LM, Lukusa D, et al. . Neonatal screening for sickle cell anaemia in the Democratic Republic of the Congo: experience from a pioneer project on 31 204 newborns. J Clin Pathol. 2009;62(1):35-38. [DOI] [PubMed] [Google Scholar]
- 9.Kueviakoe MDI, Agbétiafa K, Padaro E, et al. . Rare hemoglobins in Togo: a 15-year study at the Lomé University Campus Hospital Center [in French]. Med Sante Trop. 2013;23(3):294-299. [DOI] [PubMed] [Google Scholar]
- 10.Munyanganizi R, Cotton F, Vertongen F, Gulbis B. Red blood cell disorders in Rwandese neonates: screening for sickle cell disease and glucose-6-phosphate dehydrogenase deficiency. J Med Screen. 2006;13(3):129-131. [DOI] [PubMed] [Google Scholar]
- 11.North ML, Piffaut MC, Duwig I, Locoh-Donou AG, Locoh-Donou AM. Detection of haemoglobinopathies at birth in Togo. Nouv Rev Fr Hematol. 1988;30(4):237-241. [PubMed] [Google Scholar]
- 12.Djembo-Taty M, Tchiloemba M, Galacteros F, Rosa J, Lissouba P. Epidemiologic study of hemoglobinopathies in the Congo in 2,257 newborn infants [in French]. Nouv Rev Fr Hematol. 1986;28(4):249-251. [PubMed] [Google Scholar]
- 13.Kendall AG, de Leeuw NK, Ouna N, Hira P. Hemoglobin variants in western Kenya. Hum Biol. 1980;52(1):53-61. [PubMed] [Google Scholar]
- 14.Bayoumi RA, Saha N. Some blood genetic markers of the Nuba and Hawazma tribes of western Sudan. Am J Phys Anthropol. 1987;73(3):379-388. [DOI] [PubMed] [Google Scholar]
- 15.Gatti F, Vandepitte J, Lehmann H, Gaffney PJ. Hemoglobin E in a Congolese family [in French]. Ann Soc Belges Med Trop Parasitol Mycol. 1968;48(5):527-534. [PubMed] [Google Scholar]
- 16.Bird AR, Ellis P, Wood K, Mathew C, Karabus C. Inherited haemoglobin variants in a South African population. J Med Genet. 1987;24(4):215-219. [DOI] [PMC free article] [PubMed] [Google Scholar]
- 17.Lallemant M, Galacteros F, Lallemant-Lecoeur S, et al. . Hemoglobin abnormalities. An evaluation on new-born infants and their mothers in a maternity unit close to Brazzaville (P.R. Congo). Hum Genet. 1986;74(1):54-58. [DOI] [PubMed] [Google Scholar]
- 18.Burchall G, Maxwell E. Haemoglobin Stanleyville II modifies sickle disease phenotype. Pathology. 2010;42(3):310-312. [DOI] [PubMed] [Google Scholar]
- 19.Silva MR, Sendin SM, Pimentel FS, Velloso-Rodrigues C, Romanha ÁJ, Viana MB. Hb Stanleyville-II [α78(EF7)Asn→Lys (α2); HbA2: c.237C>A]: incidence of 1:11,500 in a newborn screening program in Brazil. Hemoglobin. 2012;36(4):388-394. [DOI] [PubMed] [Google Scholar]
- 20.North ML, Darbre PD, Juif JG, Stoll C, Lehmann H. [Hemoglobin Stanleyville II and mucoviscidosis in an Alsatian family [in French]. Nouv Rev Fr Hematol. 1975;15(4):447-453. [PubMed] [Google Scholar]
- 21.Dherte P, Vandepitte J, Ager JA, Lehmann H. Stanleyville I and II: two new variants of adult haemoglobin. BMJ. 1959;2(5147):282-284. [DOI] [PMC free article] [PubMed] [Google Scholar]
- 22.Hollán SR, Szelenyi JG, Brimhall G, et al. . Multiple alpha chain loci for human haemoglobins: Hb J-Buda and Hb G-Pest. Nature. 1972;235(5332):47-50. [DOI] [PubMed] [Google Scholar]
- 23.Wenning MR, Kimura EM, Jorge SB, Costa FF, Sonati MF. Molecular characterization of hemoglobins Kurosaki [alpha7 Lys-->Glu], G-Pest [alpha74 Asp-->Asn], Stanleyville-II [alpha78 Asn-->Lys] and J-Rovigo [alpha53 Ala-->Asp]. [alpha53 Ala→Asp] Acta Haematol. 1999;102(4):203-205. [DOI] [PubMed] [Google Scholar]
- 24.Heard SE, Pearson TC, Westwood NB. Homozygous haemoglobin O Arab disease and conjugated hyperbilirubinaemia. BMJ. 1992;304(6824):446-447. [PubMed] [Google Scholar]
- 25.Dror S. Clinical and hematological features of homozygous hemoglobin O-Arab [beta 121 Glu → Lys]. Pediatr Blood Cancer. 2013;60(3):506-507. [DOI] [PubMed] [Google Scholar]
- 26.Zimmerman SA, O’Branski EE, Rosse WF, Ware RE. Hemoglobin S/O(Arab): thirteen new cases and review of the literature. Am J Hematol. 1999;60(4):279-284. [DOI] [PubMed] [Google Scholar]
- 27.Ibrahim SA, Mustafa D, Mohamed AO, Mohed MB. Homozygous haemoglobin O disease and conjugated hyperbilirubinaemia in a Sudanese family. BMJ. 1992;304(6818):26-27. [DOI] [PMC free article] [PubMed] [Google Scholar]
- 28.Kifude CM, Polhemus ME, Heppner DG Jr, Withers MR, Ogutu BR, Waitumbi JN. Hb Kenya among Luo adults and young children in malaria holoendemic Western Kenya: screened by high performance liquid chromatography and confirmed by polymerase chain reaction. Hemoglobin. 2007;31(4):401-408. [DOI] [PubMed] [Google Scholar]
- 29.Nute PE, Wood WG, Stamatoyannopoulos G, Olweny C, Failkow PJ. The Kenya form of hereditary persistence of fetal haemoglobin: structural studies and evidence for homogeneous distribution of haemoglobin F using fluorescent anti-haemoglobin F antibodies. Br J Haematol. 1976;32(1):55-63. [DOI] [PubMed] [Google Scholar]
- 30.Wilcox I, Boettger K, Greene L, et al. . Hemoglobin Kenya composed of α- and ((A)gammabeta)-fusion-globin chains, associated with hereditary persistence of fetal hemoglobin. Am J Hematol. 2009;84(1):55-58. [DOI] [PubMed] [Google Scholar]
- 31.Huisman TH. Compound heterozygosity for Hb S and the hybrid HbS Lepore, P-Nilotic, and Kenya; comparison of hematological and hemoglobin composition data. Hemoglobin. 1997;21(3):249-257. [DOI] [PubMed] [Google Scholar]
- 32.Moo-Penn WF, Bechtel KC, Therrell BL Jr. Hemoglobin P Nilotic in a Mexican-American family. Hemoglobin. 1978;2(1):65-69. [DOI] [PubMed] [Google Scholar]
- 33.Altay C, Kutlar A, Wilson JB, Webber BB, Huisman TH. Hb P-Nilotic or alpha 2(beta delta)2 in a Turkish family. Hemoglobin. 1987;11(4):395-399. [DOI] [PubMed] [Google Scholar]
- 34.Serjeant GR, Wild B, Tebasulwa S, Mason KP, Serjeant BE, Ndugwa CM. Sickle haemoglobin and haemoglobin Stanleyville II: possible confusion with sickle cell-haemoglobin C disease. East Afr Med J. 2005;82(7):367-370. [PubMed] [Google Scholar]
- 35.Waye JS, Cai SP, Eng B, Chui DH, Francombe WH. Clinical course and molecular characterization of a compound heterozygote for sickle hemoglobin and hemoglobin Kenya. Am J Hematol. 1992;41(4):289-291. [DOI] [PubMed] [Google Scholar]
- 36.Rhoda MD, Martin J, Blouquit Y, Garel MC, Edelstein SJ, Rosa J. Sickle cell hemoglobin fiber formation strongly inhibited by the Stanleyville II mutation (alpha 78 Asn leads to Lys). Biochem Biophys Res Commun. 1983;111(1):8-13. [DOI] [PubMed] [Google Scholar]
- 37.Hall-Craggs M, Marsden PD, Raper AB, Lehmann H, Beale D. Homozygous sickle cell anaemia arising from two different haemoglobins S. interaction of haemoglobins S and Stanleyville II. BMJ. 1964;2(5401):87-89. [DOI] [PMC free article] [PubMed] [Google Scholar]
Associated Data
This section collects any data citations, data availability statements, or supplementary materials included in this article.


