

Abstract
Importance
Despite lack of evidence of their utility, biomarkers of ovarian reserve are being promoted as potential markers of reproductive potential or “fertility tests.”
Objective
To determine the extent to which biomarkers of ovarian reserve are associated with reproductive potential among late-reproductive age women.
Design, Setting, and Participants
Prospective, time-to-pregnancy cohort study (2008-March 2016) of women (N=981) 30–44 years of age without a history of infertility who had been trying to conceive for 3 months or less were recruited from the community in the Raleigh-Durham area.
Exposures
Early follicular phase serum level of antimüllerian hormone (AMH), follicle stimulating hormone (FSH), and inhibin B, and urinary level of FSH.
Main Outcomes and Measures
The primary outcomes were the cumulative probability of conception by 6 and 12 cycles of attempt and relative fecundability, the probability of conception in a given menstrual cycle. Conception was defined as a positive pregnancy test.
Results
750 women (33.3[3.2] years of age; 77% white; 36% overweight or obese), provided a blood and urine sample and were included in the analysis. After adjusting for age, body mass index, race, current smoking status and recent hormonal contraceptive use, women with low AMH values (<0.7ng/ml, N=84) did not have a significantly different predicted probability of conceiving by 6 cycles of attempt (65%; 95% Confidence Interval (CI): 50–75%) compared to women (N=579) with normal values (62%; 95% CI: 57–66%) nor by 12 cycles of attempt (84%; 95% CI: 70–91% versus 75%; 95% CI: 70–79%, respectively). Women with high serum FSH values (>10mIU/ml, N=83) did not have a significantly different predicted probability of conceiving after 6 cycles of attempt (63%; 95% CI: 50–73%) compared to women (N=654) with normal values (62%; 95% CI: 57–66%) nor after 12 cycles of attempt (82%; 95% CI: 70–89 versus 75%; 95% CI: 70–78%). Women with high urinary FSH values (>11.5mIU/mgcr, N=69) did not have a significantly different predicted probability of conceiving after 6 cycles of attempt (61%; 95% CI: 46–74%) compared to women (N=660) with normal values (62%; 95% CI: 58–66%) nor after 12 cycles of attempt (70%; 95% CI: 54–80% versus 76%; 95% CI: 72–80%). Inhibin b levels (N=737) were not associated with the probability of conceiving in a given cycle (Hazard Ratio [per 1pg/ml increase] = 0.999; 95% CI: 0.997–1.001).
Conclusions
Among women age 30–44 years of age without a history of infertility, who had been trying to conceive for 3 months or less, biomarkers indicating diminished ovarian reserve, compared to normal ovarian reserve, were not associated with reduced fertility. These findings do not support the use of urinary or blood FSH tests or AMH levels to assess natural fertility for women with these characteristics.
INTRODUCTION
Women are delaying their attempts to conceive to older ages.1 As a woman ages, her oocyte and follicular pool declines.2 As the oocyte and follicular pool declines, granulosa cells secrete less inhibin B and antimüllerian hormone (AMH).3,4 Lower inhibin B levels lead to an earlier and more rapid rise in follicle stimulating hormone (FSH) during the follicular phase.5 Collectively, AMH and early follicular phase FSH and inhibin B have been referred to as biomarkers of ovarian reserve.
The ability of these biomarkers to predict reproductive potential is uncertain. AMH has been associated with time to menopause in a number of cohorts.6,7 Among women with infertility undergoing controlled ovarian hyperstimulation for in vitro fertilization (IVF), AMH is an excellent predictor of oocyte yield.8 Studies on the ability of these biomarkers to predict those women who will conceive with IVF have had inconsistent findings.9–11 Despite lack of evidence of their utility, biomarkers of ovarian reserve are being used as markers of reproductive potential or “fertility tests.” Home fertility tests based on day 3 urinary FSH levels are commercially available. Additionally, clinicians use these tests, when counseling about elective oocyte cryopreservation.
The objective of this study was to determine the extent to which biomarkers of ovarian reserve (early follicular phase serum AMH, serum FSH, serum inhibin B, and urinary FSH) were associated with reproductive potential, as measured by the probability of conceiving naturally, in an older reproductive-age cohort of women recruited from the community. It was hypothesized that women with biomarker values suggesting diminished ovarian reserve would have a lower probability of conceiving in a given cycle (fecundability), by 6 cycles, and by 12 cycles of trying to conceive.
Methods
A prospective, time-to-pregnancy cohort study was conducted from April 2008 to March 2016. Women were eligible to participate if they were between 30 and 44 years of age, had been attempting to conceive for 3 or fewer months, and were cohabitating with a male partner. Women were excluded if they had known fertility problems (history of sterilization, diagnosis of polycystic ovarian syndrome (PCOS), previous or current use of fertility treatments, known tubal blockage, surgically diagnosed endometriosis) or a partner with a history of infertility. Women who were currently breastfeeding or had used injectable hormonal contraception in the preceding year were also excluded. This study was approved by the Institutional Review Board of the University of North Carolina; all participants provided written consent.
Women were recruited through flyers in the community, radio and print ads, informational letters, and mass emails. They were screened for eligibility over the phone using a standardized questionnaire. Women, who met eligibility criteria, completed a questionnaire including demographics and information on factors potentially related to fertility. To characterize the study population, this questionnaire included a question about race. Women self-selected their race from categories provided. Women were instructed to contact the study coordinator with their subsequent menses. They were scheduled for a study visit on cycle day 2, 3, or 4 of their menstrual cycle. Women were mailed a urine collection kit and instructed to collect a first-morning urine sample on the day of their study visit. At that visit, a blood sample and urine sample (if not collected at home) was obtained from the participant. Women were provided with home urine pregnancy tests (sensitivity: 20 mIU HCG/ml). For the first 3 years of the study, women were instructed to perform the pregnancy test with missed menses; subsequently women were instructed to test starting on menstrual cycle day 28 and every 3 days thereafter.
While attempting to conceive, women completed a daily diary in which they recorded bleeding, intercourse, medications, and results of pregnancy tests. Women completed these diaries for up to 4 months and then subsequently completed monthly questionnaires. Initial versions of the questionnaires were on paper, and later versions were web-based. Women were instructed to contact study personnel if they tested positive for pregnancy. They were provided a free pregnancy ultrasound between 6 and 8 weeks gestation to encourage communication of results. Women were initially followed for up to 6 months, but the protocol was subsequently modified in March 2010 to follow all women for up to 12 months of pregnancy attempt. They were withdrawn from the study at initiation of fertility medication, upon request (most commonly because they were moving or stopped trying to conceive), or when lost to follow up.
Serum Analysis
Serum samples were stored at -30°C until analysis. Samples were shipped frozen in a single batch to the University of Southern California Reproductive Endocrinology Laboratory. There they were assayed using sensitive and specific assays for FSH (Immulite analyzer, Siemens, Deerfield, IL), inhibin B (ELISA, Ansh Labs, Webster, TX), and AMH (Ultrasensitive AMH ELISA, Ansh, lower limit of detection 0.078 ng/ml). Interassay coefficients of variation ranged from and 4–5% for FSH, 5–8% for inhibin B, and 9–11% for AMH.
Urine Analysis
Urine was stored and shipped frozen to the National Institute for Occupational Safety and Health Reproductive Endocrinology Laboratory. There they were assayed for FSH and creatinine as described previously.12 To adjust for urine flow rate, urinary FSH values were divided by the respective creatinine concentration. Results are presented as mIU of FSH per mg of creatinine (mIU/mgcr). Intra-assay coefficients of variation were 3.5% for FSH and 1.5% for creatinine.
Statistical Analysis
The primary outcome measures for the study were the cumulative probability of conception by 6 menstrual cycles, by 12 menstrual cycles, and relative fecundability. There were no secondary outcomes, but planned exploratory analyses examined associations between levels of AMH and the primary outcomes among age subgroups and between parity subgroups.
The biomarkers of ovarian reserve were considered as categorical variables where informed choices for cut-points were available. It was hypothesized that the relationship between AMH and fertility would be non-linear. After exploring clinical AMH cut off values of 0.4ng/ml, 0.7ng/ml, and 1.0ng/ml, the middle cut-off value of 0.7ng/ml was selected based on previous research.13 The 90th percentile was selected as the upper level AMH cut-off value (8.5 ng/ml). The clinical value of 10mIU/ml was selected a priori as the serum FSH cut-off value.14 For urine, the corresponding FSH value is 11.5 mIU/mg creatinine, as documented previously.13 Inhibin B was modeled as a continuous variable, as no clinical cut-off values were available.
Non-parametric bivariate analyses were used to compare median biomarker levels by participant characteristics. Because women did not all enter at the same point during their attempts to conceive and some women withdrew, started fertility medications, or were lost to follow up, the cohort was analyzed using a discrete-time Cox proportional hazards model. Time was menstrual cycles at risk for pregnancy (pregnancy attempt cycle). Pregnancy attempt cycle was determined from the time a woman started trying to conceive, not from the time of enrollment. Attempt cycle at enrollment was defined by the pregnancy attempt cycle (usually cycle 1, 2, or 3) in which the woman began participation (completed diaries or baseline questionnaire). Women were censored at the time they withdrew, started fertility medications, or were lost to follow up. Thus, cycles from enrollment to censoring were included in the analysis. As time in these models is measured by menstrual cycles (and not chronologic time) the hazard ratios (HRs) are commonly referred to as fecundability ratios, which are the relative probability of pregnancy in a given cycle for the exposed relative to the reference group. In such models an HR less than one suggests reduced fecundability in the exposed (or non-referent) group.
The Cox proportional hazard models were then used to calculate the cumulative probability of conceiving (with 95% confidence intervals) at 6 and 12 cycles of attempt for each biomarker level. All models adjusted for age (3 categories: <35, 35–37, 38–44)15, body mass index (4 categories: <18.5, 18.5–24.9, 25–29.9, ≥30 kg/m2)16, race (White: yes/no), current smoking status (yes/no), and hormonal contraceptive use in the preceding year (yes/no). Adjusted Kaplan Meier curves with 95% confidence intervals were also constructed. The predicted probabilities and Kaplan Meier curves were calculated by setting all of the covariates to the mean of the cohort. Planned subgroup analyses were conducted by age and parity. To test for interaction by age and parity, a likelihood ratio test was used to compare the fit for the model without the interaction term to the model including the interaction term. In addition, post hoc sensitivity analyses were conducted by creating additional Cox models to assess different cut-off values and to evaluate potential biases.
A sample size of 750 women was selected based on an a priori power analysis. A 10% loss to follow-up, 70% pregnancy rate in the control group, a 57% pregnancy rate by 6 months in the diminished ovarian reserve group, and 80% power at a type I error rate of 0.05 was conservatively presumed based on the pilot study. 13 SAS (version 9.3) and R (version 3.3.0) were used for statistical analysis. All testing was two-sided. P-values less than 0.05 were considered statistically significant; there was no adjustment for multiple comparisons.
Results
Study flow is presented in Figure 1; 981 women were enrolled in the Time to Conceive study; 770 of these women had a study visit; 750 women would ultimately be included in the analysis. Of these, 37 (5%) withdrew, 47 (6%) started fertility medications, 56 (7%) were lost to follow up, 487 (65%) conceived, and 123 (17%) completed the study but did not conceive. Of the analyzed cohort, 69% of participants were 30 to 34 years of age; 19% were between 35 and 37 years of age, and 12% were 38 years or older. Most participants were White (77%) and highly educated (62% with a graduate degree). The majority of women had a normal BMI (62%), while 3% were underweight and 36% were overweight or obese. Cox analysis showed that the probability of conception was 65% by 6 cycles of attempt and 77% by 12 cycles of attempt. Fecundability over each attempt cycle is presented in Table 1.
Figure 1.
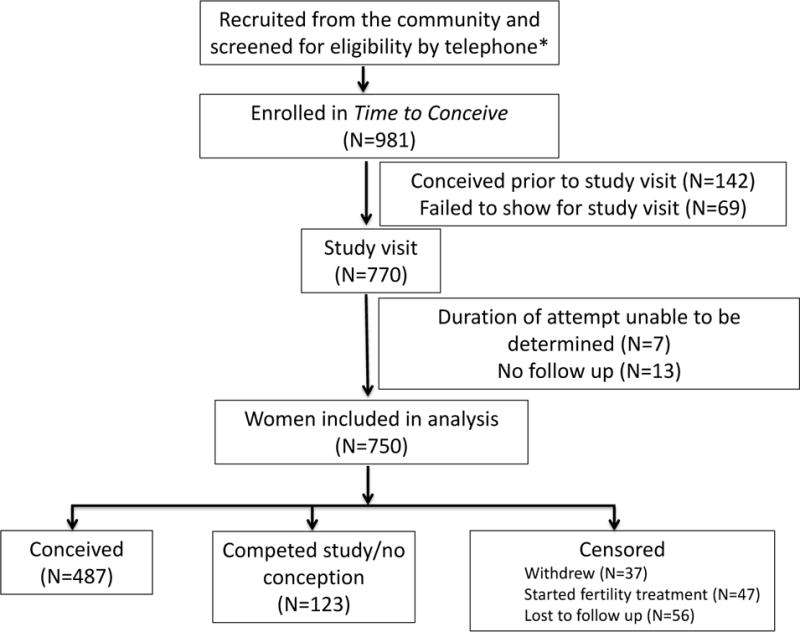
Study flow chart of participants in the cohort
*Number screened and reasons and numbers for exclusions are not available
Table 1.
Flow of participants throughout study, which shows the attempt cycle participants entered the study, the number that conceived in each cycle (fecundability), and the number of women, who were censored (withdrew, started fertility medications, lost-to-follow up, or completed the study) in each cycle. Only data from the first 12 attempt cycles are presented.
| Cycle of pregnancy attempt | Number entered study | Women at risk* | Number (%) conceived | # Censored in this cycle |
|---|---|---|---|---|
| 1 | 388 | 388 | 54 (14%) | 9 |
| 2 | 191 | 516 | 84 (16%) | 10 |
| 3 | 105 | 527 | 103 (20%) | 22 |
| 4 | 39 | 441 | 77 (17%) | 15 |
| 5 | 12 | 361 | 49 (14%) | 24 |
| 6 | 4 | 292 | 47 (16%) | 21 |
| 7 | 1 | 225 | 25 (11%) | 29 |
| 8 | 0 | 171 | 16 (9%) | 24 |
| 9 | 2 | 133 | 12 (9%) | 17 |
| 10 | 0 | 104 | 3 (3%) | 16 |
| 11 | 0 | 85 | 5 (6%) | 9 |
| 12 | 1 | 72 | 2 (3%) | 12 |
Includes all the women that entered into the study during this attempt cycle or entered in a preceding cycle and did not conceive and were not censored (for starting a fertility medication, withdrawal, or lost to follow up).
Women at risk in cycleX= number entered study at cyclex + number at risk in cyclex−1 − (number conceivedx−1+number censoredx−1).
For example, number at risk in cycle 3=105+516−(84+10)=527.
The distributional statistics for the observed biomarkers of ovarian reserve are as follows. Serum AMH, inhibin B, and FSH values were missing for 13 (2%) of study participants, and were excluded from AMH, inhibin b, and FSH analyses accordingly. Urinary FSH values were missing for 21 (3%) of the participants and were excluded from the analyses of urinary FSH. Each participant had at least one biomarker value. Eleven percent of women had an AMH value of 0.7ng/ml or less; 10% (by design) had an AMH value of 8.5ng/ml or higher. 11% had a serum FSH value of 10mIU/ml or higher; 9% had a urine creatinine corrected FSH value of 11.5 mIU/mg creatinine or higher. The median value for inhibin B was 70 pg/ml (Interquartile range: 38–102).
Table 2 presents the unadjusted median values of each biomarker (with interquartile range) by participant characteristics. As expected, AMH levels decreased and urinary FSH values increased with female age. Compared to non-obese women, obese women had lower AMH (p=0.007) and inhibin B values (p=0.005). Biomarker values did not significantly differ by education level, race, smoking status, hormonal contraceptive use in the preceding year, or cycle of pregnancy attempt in which the study participant was enrolled. Women who had previously been pregnant had significantly lower AMH values and higher urinary FSH values in this unadjusted analysis.
Table 2.
Median (Interquartile Range) values for each biomarker by participant characteristic in the Time to Conceive Cohort
| Number N=750 |
Antimüllerian Hormone (ng/ml) |
Serum Follicle Stimulating Hormone (mIU/ml) |
Urinary Follicle Stimulating Hormone (mIU/mg creatinine) |
Inhibin B (ng/ml) |
|
|---|---|---|---|---|---|
| Age (years) | |||||
| 30–34 | 517 (69%) | 3.27 (1.7,5.8) | 6.57 (5.2,8.0) | 5.44 (3.6, 7.8) | 71.7 (41.5,102.2) |
| 35–37 | 141 (19%) | 1.90 (0.9,3.7) | 6.88 (5.4,9.1) | 6.29 (3.9, 9.0) | 67.7 (32.2,108.3) |
| 38–44 | 92 (12%) | 1.27 (0.6,2.8) | 6.60 (5.5,9.1) | 6.55 (4.6,10.1) | 62.1 (28.2, 91.0) |
| P-valuea | <0.0001 | 0.12 | 0.001 | 0.18 | |
| Education | |||||
| Less than college degree | 56 (7%) | 3.12 (1.6,5.3) | 6.51 (5.1,7.5) | 5.66 (4.2,8.7) | 64.3 (34.9,105.6) |
| College degree | 157 (21%) | 2.16 (1.3,4.6) | 6.84 (5.3,8.0) | 5.62 (4.3,7.7) | 67.1 (38.9, 98.5) |
| Some graduate work | 70 (10%) | 3.04 (1.6,6.1) | 6.50 (5.7,8.0) | 5.44 (3.5,8.4) | 71.7 (51.0,109.2) |
| Graduate degree | 467 (62%) | 2.81 (1.4,5.2) | 6.64 (5.2,8.4) | 5.85 (3.8,8.2) | 72.1 (36.7,102.2) |
| P-valuea | 0.18 | 0.73 | 0.88 | 0.48 | |
| Body Mass Index (kg/m2) | |||||
| <18.5 (underweight) | 19 (3%) | 2.83 (1.7,5.1) | 6.08 (5.5,6.8) | 7.04 (4.5,8.4) | 82.7 (44.2,117.5) |
| 18.5–24.9 (normal) | 461 (61%) | 2.85 (1.5,5.5) | 6.72 (5.3,8.4) | 5.90 (3.7,8.2) | 74.3 (39.6,104.8) |
| 25–29.9 (overweight) | 155 (21%) | 2.92 (1.4,4.8) | 6.39 (5.2,7.8) | 5.44 (4.1,7.8) | 70.2 (43.0,101.5) |
| ≥30 (obese) | 114 (15%) | 2.20 (0.9,4.0) | 6.98 (5.2,8.4) | 5.35 (3.6,8.4) | 57.4 (30.3, 84.1) |
| Missing | 1 (<1%) | ||||
| P-valuea | 0.06 | 0.19 | 0.66 | 0.005 | |
| Race | |||||
| White | 576 (77%) | 2.78 (1.4,5.2) | 6.64 (5.2,8.2) | 5.55 (3.7,8.0) | 70.3 (38.9,101.6) |
| Non-white | 174 (23%) | 2.70 (1.6,5.2) | 6.57 (5.7,8.1) | 6.13 (4.1,8.6) | 68.6 (33.3,103.2) |
| P-valuea | 0.72 | 0.60 | 0.08 | 0.56 | |
| Current smoker | |||||
| Yes | 13 (2%) | 1.45 (1.0,2.3) | 6.11 (4.8,9.9) | 5.08 (3.6,7.5) | 58.9 (22.1, 78.3) |
| No | 737 (98%) | 2.78 (1.4,5.2) | 6.63 (5.3,8.2) | 5.69 (3.8,8.2) | 70.2 (38.0,102.0) |
| P-valuea | 0.12 | 0.79 | 0.71 | 0.35 | |
| History of prior pregnancy | |||||
| Yes | 383 (51%) | 2.42 (1.1,4.3) | 6.63 (5.2,8.2) | 6.03 (4.1,8.9) | 70.0 (37.2,102.3) |
| No | 367 (49%) | 3.24 (1.6,5.9) | 6.62 (5.4,8.2) | 5.44 (3.7,7.8) | 70.3 (39.5,101.5) |
| P-value | <0.0001 | 0.77 | 0.003 | 0.83 | |
| Hormonal contraceptive use in the preceding year | |||||
| Yes | 336 (45%) | 2.77 (1.5,5.7) | 6.67 (5.3,8.2) | 5.44 (3.7,8.0) | 70.3 (36.9,103.5) |
| No | 414 (55%) | 2.78 (1.3,4.7) | 6.60 (5.3,8.2) | 5.99 (3.9,8.5) | 70.0 (38.5,100.0) |
| P-valuea | 0.18 | 0.29 | 0.05 | 0.72 | |
| Cycle of pregnancy attempt when enrolled | |||||
| 1 | 388 (52%) | 2.85 (1.4,5.3) | 6.50 (5.2,8.2) | 5.48 (3.6, 7.9) | 71.3 (36.8,102.8) |
| 2 | 191 (25%) | 2.78 (1.5,5.4) | 6.55 (5.5,7.9) | 5.54 (3.8, 8.0) | 66.5 (38.0, 95.8) |
| 3 | 105 (14%) | 2.43 (1.2,4.7) | 7.15 (5.2,9.4) | 6.46 (4.3, 9.8) | 70.2 (35.4, 99.0) |
| >6 | 11 (2%) | 1.83 (0.9,2.6) | 7.24 (5.7,8.7) | 6.05 (5.2, 7.3) | 66.4 (41.0,108.6) |
| P-valuea | 0.41 | 0.31 | 0.20 | 0.56 | |
| Partner Age (years) | |||||
| Less than 35 | 424 (56%) | 3.15 (1.7,5.7) | 6.66 (5.2,8.1) | 5.69 (3.8,8.0) | 70.1 (39.4,101.6) |
| 35–45 | 298 (40%) | 2.27 (1.1,4.4) | 6.64 (5.4,8.6) | 5.68 (3.8,8.1) | 70.3 (38.0,102.5) |
| 45 and older | 27 (4%) | 2.33 (0.9,3.9) | 5.91 (5.2,7.5) | 6.92 (4.0,9.2) | 62.9 (24.4,102.3) |
| Missing | 1 (<1%) | ||||
| P-valuea | <0.0001 | 0.49 | 0.55 | 0.62 | |
| Partner Body Mass Index (kg/m2) | |||||
| <18.5 (underweight) | 2 (<1%) | 2.15 (1.7,2.6) | 6.91 (5.8,8.0) | 6.44 (4.5,8.4) | 41.0 (23.7, 58.3) |
| 18.5–24.9 (normal) | 316 (42%) | 2.77 (1.5,5.6) | 6.62 (5.4,8.2) | 5.85 (3.7,8.0) | 73.5 (38.7,106.7) |
| 25–29.9 (overweight) | 297 (40%) | 2.78 (1.4,5.1) | 6.62 (5.2,8.5) | 5.95 (4.1,8.7) | 70.6 (37.4, 98.3) |
| ≥30 (obese) | 135 (18%) | 2.74 (1.3,4.6) | 6.70 (5.3,7.8) | 5.18 (3.8,7.5) | 62.9 (36.5, 89.8) |
| P-valuea | 0.82 | 0.88 | 0.34 | 0.09 |
Kruskal-Wallis rank sum test was used to compare biomarker values within each category.
AMH values were not statistically different across years of sample collection (Kruksal-Wallis test, p=0.83) suggesting that AMH levels, as measured using the Ansh assay, are stable over prolonged storage at −30°C. A subset (N=99) of samples were analyzed for AMH using the Diagnostic Systems Laboratory (DSL) Assay, Gen II Assay (Beckman Coulter), and Ansh Assay. There was high pairwise correlation between assay values (Pearson’s r=0.96–0.97, p<0.001).
Results for Primary Outcomes
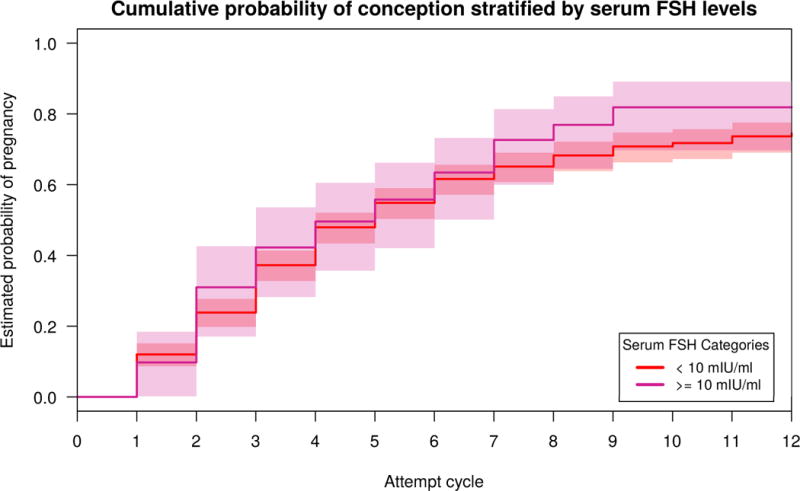
The predicted probability of conceiving by 6 cycles or 12 cycles of attempt, as calculated from the Cox models, was not lower for women with low AMH or high FSH, as had been hypothesized (Table 2). Women with low AMH values (<0.7ng/ml) did not have a significantly different cumulative probability of conceiving by 6 cycles of attempt (65%; 95% Confidence Interval (CI): 50–75%) compared to women with normal values (62%; 95% CI: 57–66%) nor by 12 cycles of attempt (84%; 95% CI: 70–91% versus 75%; 95% CI: 70–79%, respectively). Women with high serum FSH values (>10mIU/ml) did not have a significantly different cumulative probability of conceiving after 6 cycles of attempt (63%; 95% CI: 50–73%) compared to women with normal values (62%; 95% CI: 57–66%) nor after 12 cycles of attempt (82%; 95% CI: 70–89% versus 75%; 95% CI: 70–78%). Kaplan Meier curves, comparing adjusted cumulative probabilities of conception by categories of ovarian reserve biomarkers, are presented in Figures 2, 3, and 4. Though the curves suggest longer times to pregnancy in women with higher AMH values and for those with lower FSH values, confidence intervals are overlapping for both biomarkers. High and normal urinary FSH value curves are almost indistinguishable from one another.
Figure 2.

Adjusted Kaplan Meier Curves for time to pregnancy with 95% confidence intervals by AMH. Model adjusted for age, body mass index, race, current smoking status, history of prior pregnancy, and hormonal contraceptive use in the preceding year. The number of women at risk during each cycle of attempt are provided in supplemental table 1. The median (interquartile range) number of cycles each woman contributed was 4 cycles (2–6).
Figure 3.

Adjusted Kaplan Meier Curves for time to pregnancy with 95% confidence intervals by early follicular phase serum FSH. Model adjusted for age, body mass index, race, current smoking status, history of prior pregnancy, and hormonal contraceptive use in the preceding year. The number of women at risk during each cycle of attempt are provided in supplemental table 1. The median (interquartile range) number of cycles each woman contributed was 4 cycles (2–6).
Figure 4.
Adjusted Kaplan Meier Curves for time to pregnancy with 95% confidence intervals by early follicular phase, creatinine-corrected, urinary FSH. Model adjusted for age, body mass index, race, current smoking status, history of prior pregnancy, and hormonal contraceptive use in the preceding year. The number of women at risk during each cycle of attempt are provided in supplemental table 1. The median (interquartile range) number of cycles each woman contributed was 4 cycles (2–6).
Relative fecundability (HRs) according to biomarker values as calculated from the discrete-time Cox models are presented in Table 3. Women with low AMH values or high serum FSH values, which suggest diminished ovarian reserve, did not have reduced fecundability, as had been hypothesized. Inhibin b levels (N=737) were also not associated with the probability of conceiving in a given cycle (Hazard Ratio [per 1pg/ml increase] = 0.999; 95% CI: 0.997–1.001).
Table 3.
Association between biomarkers of ovarian reserve and predicted probability of conceiving in the Time to Conceive cohort study.
| Biomarker | Number | Conceived during studye Number (%) | Cumulative probability of conceptionb (95% Confidence Interval) | Hazard Ratioa (95% Confidence Interval) | ||
|---|---|---|---|---|---|---|
| By 6 cycles | By 12 cycles | Unadjusted | Adjustedb | |||
| Antimϋllerian hormone | ||||||
| < 0.7 ng/ml | 84 | 53 (63%) | 65% (50,75) | 84% (70,91) | 0.96 (0.72–1.28) | 1.19 (0.88–1.61) |
| 0.7–8.4 ng/ml | 579 | 381 (66%) | 62% (57,66) | 75% (70,79) | Referent | Referent |
| ≥ 8.5 ng/ml | 74 | 44 (59%) | 59% (45,69) | 66% (57,77) | 0.97 (0.71–1.33) | 0.88 (0.64–1.21) |
| Follicle stimulating hormone, serum | ||||||
| <10 mIU/ml | 654 | 420 (64%) | 62% (57,66) | 75% (70,78) | Referent | Referent |
| ≥ 10 mIU/ml | 83 | 58 (70%) | 63% (50,73) | 82% (70,89) | 1.09 (0.83–1.44) | 1.22 (0.92–1.62) |
| Inhibin (pg/ml) | 737 | 478 (65%) | 0.9996 (0.998–1.002)c | 0.999 (0.997–1.001)c | ||
| Follicle stimulating hormone, urine | ||||||
| <11.5 mIU/mgcrd | 660 | 432 (65%) | 62% (58,66) | 76% (72,80) | Referent | Referent |
| ≥11.5 mIU/mgcrd | 69 | 41 (59%) | 61% (46,74) | 70% (54,80) | 0.94 (0.68–1.30) | 1.07 (0.77–1.49) |
A hazard ratio less than one suggests a lower probability of conception in the exposed group compared to the referent group in a given attempt cycle. A hazard ratio greater than one suggests a higher probability of conception in the exposed group compared to the referent group in a given attempt cycle.
Predicted from the cox models, which adjusted for age, body mass index, race, current smoking status and recent hormonal contraceptive use by setting them to the mean of the cohort.
per 1 pg/ml increase in inhibin
mgcr= milligrams of creatinine
Women were followed for up to 12 months in the study (independent of the number of menstrual cycles of attempt at enrollment or during enrollment). This includes any pregnancies conceived while enrolled in the study.
Results of Secondary Analyses
Planned subgroup analyses by age and parity were conducted (Table 4). In every age group, low AMH was not associated with diminished fecundability. Point estimates suggested higher fecundability among women with low AMH at any age. The relationship between high AMH and fecundability appeared to differ by a woman’s age. In younger women, high AMH suggested reduced fecundability. However, among older women, high AMH suggested higher fecundability. Though these point estimates differed, the confidence intervals overlap, and the age-interaction was not found to be statistically significant (p=0.35). Subsequent subgroup analysis by pregnancy history also did not reveal significant effect modification by pregnancy history (Table 4).
Table 4.
Associations between antimüllerian hormone and probability of conceiving by age and by prior pregnancy history in the Time to Conceive cohort study
| Number (%) |
Conceived during studyc Number (%) |
Cumulative Probability of Conceptiona (95% Confidence Interval) |
Adjusteda Hazard Ratiob (95% Confidence Interval) |
||
|---|---|---|---|---|---|
| Among women 30-34 years of age | By 6 cycles | By 12 cycles | |||
| < 0.7 ng/ml | 32 (6%) | 22 (69%) | 71% (48, 84) | 87% (60, 96) | 1.16 (0.75–1.81) |
| 0.7–8.4 ng/ml | 414 (81%) | 296 (71%) | 68% (63, 73) | 83% (78, 87) | Referent |
| ≥ 8.5 ng/ml | 64 (13%) | 39 (61%) | 63% (48, 74) | 73% (57,83) | 0.87 (0.62–1.22) |
| Among women 35–37 years of age | |||||
| < 0.7 ng/ml | 24 (18%) | 16 (67%) | 53% (26, 71) | 75% (45, 89) | 1.33 (0.76–2.33) |
| 0.7–8.4 ng/ml | 104 (77%) | 60 (58%) | 58% (45, 67) | 64% (52, 74) | Referent |
| ≥ 8.5 ng/ml | 7 (5%) | 4 (57%) | 68% (0, 91) | N/a | 1.14 (0.40–3.25) |
| Among women 38- 44 years of age | |||||
| < 0.7 ng/ml | 28 (31%) | 15 (54%) | 41% (15, 59) | 61% (18, 79) | 1.24 (0.61–2.51) |
| 0.7–8.4 ng/ml | 61 (66%) | 25 (41%) | 32% (16, 49) | 38% (20, 51) | Referent |
| ≥ 8.5 ng/ml | 3 (3%) | 1 (33%) | N/a | N/a | 6.85 (0.71–65.9) |
| Among women with no prior pregnancy | |||||
| < 0.7 ng/ml | 40 (11%) | 22 (55%) | 61% (37,77) | 90% (59, 98) | 1.43 (0.89–2.29) |
| 0.7–8.4 ng/ml | 277 (77%) | 169 (61%) | 55% (48, 62) | 69% (61, 75) | Referent |
| ≥ 8.5 ng/ml | 44 (12%) | 22 (55%) | 51% (32, 64) | N/a | 0.85 (0.55–1.31) |
| Among women with prior pregnancy | |||||
| < 0.7 ng/ml | 44 (12%) | 31 (70%) | 66% (47, 79) | 81% (62, 90) | 1.09 (0.73–1.63) |
| 0.7–8.4 ng/ml | 302 (80%) | 212 (70%) | 66% (60, 72) | 80% (73, 85) | Referent |
| ≥ 8.5 ng/ml | 30 (8%) | 20 (67%) | 69% (47, 82) | N/a | 1.04 (0.65–1.66) |
Predicted from the cox models, which adjusted for age, body mass index, race, nulligravidity, current smoking status, recent hormonal contraceptive use by setting them to the mean of the cohort.
A hazard ratio less than one suggests a lower probability of conception in the exposed group compared to the referent group in a given attempt cycle. A hazard ratio greater than one suggests a higher probability of conception in the exposed group compared to the referent group in a given attempt cycle.
Women were followed for up to 12 months in the study (independent of the number of menstrual cycles of attempt at enrollment or during enrollment). This includes any pregnancies conceived while enrolled in the study.
N/a: small sample size did not allow for predicted values
In sensitivity analyses different cut-off values for AMH were examined. Women with AMH values ≤0.4ng/ml had a HR of 1.40 (95%CI: 0.95–2.07) compared to women with AMH values between 0.4 ng/ml and 5.0 ng/ml. Women with AMH values ≤1.0 ng/ml had a HR of 1.16 (95% CI: 0.89–1.50) compared to women with AMH values between 1.0 ng/ml and 5.0 ng/ml. Also after adjusting for hormonal contraception use in the preceding 3 months (information available on 552 women) the HRs were further from the null, but remained statistically non-significant (for low AMH HR 1.30; 95% CI: 0.92–1.86 and for high AMH HR 0.75; 95% CI: 0.51–1.10). Restricting the analysis to women who entered into the study at cycle 1, 2, or 3 of attempt did not change the findings.
Discussion
In this cohort of older reproductive-age women attempting to conceive naturally, biomarkers of diminished ovarian reserve (low AMH or high FSH) were not associated with reduced fecundability, or a lower cumulative probability of conceiving by 6 or 12 cycles of pregnancy attempt. Early follicular phase inhibin B levels were also not associated with fertility outcomes.
In an earlier, small pilot, Steiner et al. found that low AMH (<0.7 ng/ml) as measured using the DSL assay was associated with a 60% reduction in the day-specific probability of conception.13 Those findings are different from current findings in this larger cohort - most likely due to sample size. Also, the pilot used a day-specific probability analysis. This method utilizes information on intercourse patterns around the time of ovulation that relied on a calendar method that could have led to misclassification. Second, a different AMH assay was used. There is some evidence that the Ansh assay provides higher values compared to other assays. 17 However, a sensitivity analyses with the higher (AMH≤1.0 ng/ml) and lower cut-off values (AMH≤0.4 ng/ml) was conducted, and there was still no evidence of reduced fecundability in either of the “low AMH” groups.
Three other publications examined AMH and fecundability, in women attempting to conceive naturally, and none reported significant associations.18–20 In a prospective study of 186 Danish women, Hagen et al. found that fecundability was not significantly reduced in women with low AMH (≤10pmol/L, approximately ≤1.4 ng/ml) compared to women with normal AMH levels (HR 0.81, 95% CI 0.44–1.40).18 The Hagen cohort included women in their mid-twenties and had a smaller sample size (N=186). A secondary analysis of the EAGER study, which was a randomized clinical trial of aspirin for women (average age 28.7±4.8 years) with a prior pregnancy loss, found no statistically significant association between low AMH and fecundability using the Gen II assay with a cut-off value of 1.0 ng/ml (HR 1.13, 95% CI: 0.85–1.49).19
Given that prior studies were small or based on secondary analyses, the finding in the current large, well designed study that women with diminished ovarian reserve did not have reduced fertility was surprising and contrary to the hypothesis. Although both ovarian reserve and fertility decline with chronologic age when looking at cross-sectional data, there may be little association between a given woman’s ovarian reserve and factors that affect her fertility, such as egg quality. AMH and FSH levels may, however, affect follicular recruitment in those with diminished ovarian reserve. It is possible that low AMH allows for a greater proportion of the remaining primordial follicle pool to activate and become growing follicles. Additionally, high FSH seen in women with low reserve could lead to “superovulation” with multi-follicular ovulation, increasing the odds of pregnancy. It has previously been shown that women of advanced maternal age are at higher risk of dizygotic twins.21
It was hypothesized that younger women with diminished ovarian reserve might not have decreased fertility, but that older women would. However, the exploratory subgroup analysis did not support this. Neither the younger (30–35 years of age) nor older women with diminished ovarian reserve (as measured by AMH) displayed reduced fecundability. However, high AMH was non-significantly associated with reduced fecundability in the younger women and increased fecundability in the older women. Hagen et al. similarly found that young women with high AMH levels had reduced fecundability (HR 0.62; 95% CI: 0.39–0.99).18 AMH is not only a marker of ovarian reserve, but also a potential marker for polycystic ovarian syndrome. While the appropriate AMH cut-off value for PCOS is debated, multiple studies have shown that AMH is elevated in women with PCOS.17,22 In the younger women, high AMH values may suggest undiagnosed polycystic ovarian syndrome. High AMH may inhibit follicle sensitivity to FSH and subsequent follicular recruitment.23 In the older women, high AMH may simply reflect higher than normal ovarian reserve. Further study of women with high AMH across various age groups and over time is warranted.
This study has several strengths. First, it was specifically designed to address the important public health question: Is diminished ovarian reserve a cause of infertility in late-reproductive-age women? Second, the sample size is large enough to detect even relatively small effects. Third, its prospective design allows for biomarker testing at the appropriate time and inclusion of participants with the full range of natural fertility. Fourth, most women were enrolled during their first three menstrual cycles of attempting to conceive. Enrolling women later selects a less fertile cohort, as 50% of women will likely conceive within the first 3 cycles.24 Fifth, the age range studied (30–44 years) focuses on women at risk of diminished ovarian reserve. Sixth, the study protocol standardized the outcome measure (whether or not a woman conceived in any given menstrual cycle). This was done by providing women free pregnancy tests and instructing them on when to test for pregnancy. Thus, the sensitivity of the test was the same for all, and the set timing of testing minimized the potential for differential identification of pregnancies. Seventh, the ovarian reserve markers evaluated include urinary FSH, which is used in the commercially available test kits marketed for women to assess their natural fertility. Thus, the findings relate directly to the usefulness of such tests. Eighth, biomarkers were measured in all study participants during the early follicular phase, minimizing potential variation in biomarkers due to the phase of the menstrual cycle.
This study has several limitations. First, conception, not live birth, was the primary outcome. Fecundity, the capacity to reproduce, is comprised of both the ability to conceive and to carry a fetus to viability. Diminished ovarian reserve could affect fecundity by increasing the risk of miscarriage- perhaps through an effect on egg quality. Prior studies to date have failed to show such an association.25,26 Second, not all women remained in the study for 12 cycles of attempt. This was anticipated, given the older reproductive-age cohort. Current recommendations advise women over the age of 35 to obtain an infertility evaluation after 6 months of attempt. The median attempt cycle at which women started infertility treatment in the study was 8 cycles. For this reason conception by 6 cycles of attempt was calculated and Cox models, which allow participants who initiate fertility medications to contribute time to the analysis until they are censored for their fertility medication use, were constructed. Third, ovulation was not assessed. This information would have allowed us to evaluate the strictest definition of fecundability (the probability of conceiving in a given ovulatory menstrual cycle). Fourth, male partners did not provide a semen sample for analysis. However, there is no reason to think that women with diminished ovarian reserve would be more or less likely to be partnered with a male with abnormal semen parameters. Fifth, not all women were enrolled in their first, second, or third cycle of attempt; however, when the <10% of women who entered after their third cycle of attempt were excluded, the findings did not differ. Sixth, while various AMH cut-off values were explored, the study was not powered to look at very low (0.1ng/ml or lower) AMH values, which reflect diminished ovarian reserve more consistent with the late perimenopause transition. It is possible that in such advanced stages, fecundability may be affected, especially if it results in frequent anovulation.
Conclusions
Among women age 30–44 years of age without a history of infertility, who had been trying to conceive for 3 months or less, biomarkers indicating diminished ovarian reserve, compared to normal ovarian reserve, were not associated with reduced fertility. These findings do not support the use of urinary or blood FSH tests or AMH levels to assess natural fertility for women with these characteristics.
Supplementary Material
Supplemental Table 1. Women at risk during each attempt cycle by biomarker level for Kaplan Meier Curves.
KEY POINTS.
Question
Is diminished ovarian reserve, as measured by low antimüllerian hormone (AMH) associated with infertility among late-reproductive age women?
Findings
In this time-to-pregnancy cohort study of women 30–44 years of age without a history of infertility, women with a low AMH value had an 84% predicted cumulative probability of conception by 12 cycles of pregnancy attempt compared to 75% in women with a normal AMH value, a non-significant difference.
Meaning
For women attempting to conceive naturally, diminished ovarian reserve was not associated with infertility; women should be cautioned against using AMH levels to assess their current fertility.
Acknowledgments
Disclosure of support for study:
NIH/NICHD R21 HD060229 and RO1 HD067683 and the Intramural Research Program of the NIH, National Institute of Environmental Health Sciences (DDBaird salary). The funders of the study had no role in design and conduct of the study; collection, management, analysis, and interpretation of the data; and preparation, review, or approval of the manuscript or the decision to submit for publication.
Footnotes
Trial Registration: clinical trials.gov: NCT01028365
Disclaimers:
The findings and conclusions in this report are those of the author(s) and do not necessarily represent the views of the National Institute for Occupational Safety and Health (NIOSH). Mention of any company or product does not constitute endorsement by the National Institute for Occupational Safety and Health (NIOSH).
Drs. Steiner and Herring had full access to all of the data in the study and take full responsibility for the integrity of the data and the accuracy of the data analysis.
Contributor Information
Anne Z. Steiner, Department of Obstetrics and Gynecology, University of North Carolina, Chapel Hill, NC.
David Pritchard, Department of Biostatistics, University of North Carolina, Chapel Hill, NC.
Frank Z. Stanczyk, Department of Obstetrics and Gynecology and Preventive Medicine, University of Southern California, Los Angeles, CA.
James S. Kesner, National Institute for Occupational Safety and Health, Cincinnati, OH.
Juliana W. Meadows, National Institute for Occupational Safety and Health, Cincinnati, OH.
Amy H. Herring, Department of Statistical Science, Duke University, Durham, NC.
Donna D. Baird, Epidemiology Branch, National Institute of Environmental Health Science/National Institutes of Health, Research Triangle Park, NC.
References
- 1.Mathews TJ, Hamilton BE. Mean Age of Mothers is on the Rise: United States, 2000–2014. National Center for Health Statistics Data Brief. 2016;(232):1–8. [PubMed] [Google Scholar]
- 2.Hansen KR, Knowlton NS, Thyer AC, Charleston JS, Soules MR, Klein NA. A new model of reproductive aging: the decline in ovarian non-growing follicle number from birth to menopause. Hum Reprod. 2008;23(3):699–708. doi: 10.1093/humrep/dem408. [DOI] [PubMed] [Google Scholar]
- 3.Lee MM, Donahoe PK. Mullerian inhibiting substance: a gonadal hormone with multiple functions. Endocr Rev. 1993;14(2):152–164. doi: 10.1210/edrv-14-2-152. [DOI] [PubMed] [Google Scholar]
- 4.Roberts VJ, Barth S, el Roeiy A, Yen SS. Expression of inhibin/activin subunits and follistatin messenger ribonucleic acids and proteins in ovarian follicles and the corpus luteum during the human menstrual cycle. J Clin Endocrinol Metab. 1993;77(5):1402–1410. doi: 10.1210/jcem.77.5.8077341. [DOI] [PubMed] [Google Scholar]
- 5.Santoro N, Isaac B, Neal-Perry G, et al. Impaired folliculogenesis and ovulation in older reproductive aged women. J Clin Endocrinol Metab. 2003;88(11):5502–5509. doi: 10.1210/jc.2002-021839. [DOI] [PubMed] [Google Scholar]
- 6.Freeman EW, Sammel MD, Lin H, Boorman DW, Gracia CR. Contribution of the rate of change of antimullerian hormone in estimating time to menopause for late reproductive-age women. Fertil Steril. 2012;98(5):1254–1259. doi: 10.1016/j.fertnstert.2012.07.1139. [DOI] [PMC free article] [PubMed] [Google Scholar]
- 7.Dolleman M, Faddy MJ, van Disseldorp J, et al. The relationship between anti-Mullerian hormone in women receiving fertility assessments and age at menopause in subfertile women: evidence from large population studies. J Clin Endocrinol Metab. 2013;98(5):1946–1953. doi: 10.1210/jc.2013-3105. [DOI] [PubMed] [Google Scholar]
- 8.Wu CH, Chen YC, Wu HH, Yang JG, Chang YJ, Tsai HD. Serum anti-Mullerian hormone predicts ovarian response and cycle outcome in IVF patients. J Assist Reprod Genet. 2009;26(7):383–389. doi: 10.1007/s10815-009-9332-8. [DOI] [PMC free article] [PubMed] [Google Scholar]
- 9.Broer SL, van Disseldorp J, Broeze KA, et al. Added value of ovarian reserve testing on patient characteristics in the prediction of ovarian response and ongoing pregnancy: an individual patient data approach. Hum Reprod Update. 2013;19(1):26–36. doi: 10.1093/humupd/dms041. [DOI] [PubMed] [Google Scholar]
- 10.Broer SL, Mol BW, Hendriks D, Broekmans FJ. The role of antimullerian hormone in prediction of outcome after IVF: comparison with the antral follicle count. Fertil Steril. 2009;91(3):705–714. doi: 10.1016/j.fertnstert.2007.12.013. [DOI] [PubMed] [Google Scholar]
- 11.Brodin T, Hadziosmanovic N, Berglund L, Olovsson M, Holte J. Antimullerian hormone levels are strongly associated with live-birth rates after assisted reproduction. J Clin Endocrinol Metab. 2013;98(3):1107–1114. doi: 10.1210/jc.2012-3676. [DOI] [PubMed] [Google Scholar]
- 12.Steiner AZ, Long DL, Herring AH, Kesner JS, Meadows JW, Baird DD. Urinary Follicle-Stimulating Hormone as a Measure of Natural Fertility in a Community Cohort. Repro Sci. 2012;20(5):549–556. doi: 10.1177/1933719112459226. [DOI] [PMC free article] [PubMed] [Google Scholar]
- 13.Steiner AZ, Herring AH, Kesner JS, et al. Antimullerian hormone as a predictor of natural fecundability in women aged 30–42 years. Obstet Gynecol. 2011;117(4):798–804. doi: 10.1097/AOG.0b013e3182116bc8. [DOI] [PMC free article] [PubMed] [Google Scholar]
- 14.Jain T, Soules MR, Collins JA. Comparison of basal follicle-stimulating hormone versus the clomiphene citrate challenge test for ovarian reserve screening. Fertil Steril. 2004;82(1):180–185. doi: 10.1016/j.fertnstert.2003.11.045. [DOI] [PubMed] [Google Scholar]
- 15.Centers for Disease Control and Prevention ASfRM, Society for Assisted Reproductive Technology. 2014 Assisted Reproductive Technology National Summary Report. Atlanta (GA): US Dept of Health and Human Services; 2016. [Google Scholar]
- 16.Centers for Disease Control and Prevention. Adult BMI. 2017 www.cdc.gov/healthyweight/assessing/bmi/adult_bmi/index.html. Accessed September 1, 2017.
- 17.Li HW, Wong BP, Ip WK, Yeung WS, Ho PC, Ng EH. Comparative evaluation of three new commercial immunoassays for anti-Mullerian hormone measurement. Hum Reprod. 2016;31(12):2796–2802. doi: 10.1093/humrep/dew248. [DOI] [PubMed] [Google Scholar]
- 18.Hagen CP, Vestergaard S, Juul A, et al. Low concentration of circulating antimullerian hormone is not predictive of reduced fecundability in young healthy women: a prospective cohort study. Fertil Steril. 2012;98(6):1602–1608. doi: 10.1016/j.fertnstert.2012.08.008. [DOI] [PubMed] [Google Scholar]
- 19.Zarek SM, Mitchell EM, Sjaarda LA, et al. Is Anti-Mullerian Hormone Associated With Fecundability? Findings From the EAGeR Trial. J Clin Endocrinol Metab. 2015;100(11):4215–4221. doi: 10.1210/jc.2015-2474. [DOI] [PMC free article] [PubMed] [Google Scholar]
- 20.Depmann M, Broer SL, Eijkemans MJC, et al. Anti-Mullerian hormone does not predict time to pregnancy: results of a prospective cohort study. Gynecol Endocrinol. 2017:1–5. doi: 10.1080/09513590.2017.1306848. [DOI] [PubMed] [Google Scholar]
- 21.Benirschke K, Kim CK. Multiple pregnancy. 1. N Engl J Med. 1973;288(24):1276–1284. doi: 10.1056/NEJM197306142882406. [DOI] [PubMed] [Google Scholar]
- 22.Pigny P, Gorisse E, Ghulam A, et al. Comparative assessment of five serum antimullerian hormone assays for the diagnosis of polycystic ovary syndrome. Fertil Steril. 2016;105(4):1063–1069. doi: 10.1016/j.fertnstert.2015.12.023. [DOI] [PubMed] [Google Scholar]
- 23.Pellatt L, Rice S, Dilaver N, et al. Anti-Mullerian hormone reduces follicle sensitivity to follicle-stimulating hormone in human granulosa cells. Fertil Steril. 2011;96(5):1246–1251. doi: 10.1016/j.fertnstert.2011.08.015. [DOI] [PubMed] [Google Scholar]
- 24.Gnoth C, Godehardt D, Godehardt E, Frank-Herrmann P, Freundl G. Time to pregnancy: results of the German prospective study and impact on the management of infertility. Hum Reprod. 2003;18(9):1959–1966. doi: 10.1093/humrep/deg366. [DOI] [PubMed] [Google Scholar]
- 25.Grande M, Borobio V, Bennasar M, et al. Role of ovarian reserve markers, antimullerian hormone and antral follicle count, as aneuploidy markers in ongoing pregnancies and miscarriages. Fertil Steril. 2015;103(5):1221–1227. doi: 10.1016/j.fertnstert.2015.02.022. [DOI] [PubMed] [Google Scholar]
- 26.Zarek SM, Mitchell EM, Sjaarda LA, et al. Antimullerian hormone and pregnancy loss from the Effects of Aspirin in Gestation and Reproduction trial. Fertil Steril. 2015;105(4):946–952. doi: 10.1016/j.fertnstert.2015.12.003. [DOI] [PMC free article] [PubMed] [Google Scholar]
Associated Data
This section collects any data citations, data availability statements, or supplementary materials included in this article.
Supplementary Materials
Supplemental Table 1. Women at risk during each attempt cycle by biomarker level for Kaplan Meier Curves.