Abstract
Purpose:
The clinical efficacy of Grid therapy has been examined by several investigators. In this project, the hole diameter and hole spacing in Grid blocks were examined to determine the optimum parameters that give a therapeutic advantage.
Methods:
The evaluations were performed using Monte Carlo (MC) simulation and commonly used radiobiological models. The Geant4 MC code was used to simulate the dose distributions for 25 different Grid blocks with different hole diameters and center-to-center spacing. The therapeutic parameters of these blocks, namely, the therapeutic ratio (TR) and geometrical sparing factor (GSF) were calculated using two different radiobiological models, including the linear quadratic and Hug–Kellerer models. In addition, the ratio of the open to blocked area (ROTBA) is also used as a geometrical parameter for each block design. Comparisons of the TR, GSF, and ROTBA for all of the blocks were used to derive the parameters for an optimum Grid block with the maximum TR, minimum GSF, and optimal ROTBA. A sample of the optimum Grid block was fabricated at our institution. Dosimetric characteristics of this Grid block were measured using an ionization chamber in water phantom, Gafchromic film, and thermoluminescent dosimeters in Solid Water™ phantom materials.
Results:
The results of these investigations indicated that Grid blocks with hole diameters between 1.00 and 1.25 cm and spacing of 1.7 or 1.8 cm have optimal therapeutic parameters (TR > 1.3 and GSF~0.90). The measured dosimetric characteristics of the optimum Grid blocks including dose profiles, percentage depth dose, dose output factor (cGy/MU), and valley-to-peak ratio were in good agreement (±5%) with the simulated data.
Conclusion:
In summary, using MC-based dosimetry, two radiobiological models, and previously published clinical data, we have introduced a method to design a Grid block with optimum therapeutic response. The simulated data were reproduced by experimental data.
Keywords: Grid block design, Monte Carlo simulation, radiobiological model, therapeutic ratio
INTRODUCTION
Grid therapy, which is also known as spatially fractionated radiation therapy (SFRT), is a method that has been proven to be beneficial in the management of bulky and advanced tumors.[1] In this technique, an open radiation field is being converted to a set of pencil beam radiation fields using an external block. Commonly, SFRT is performed with a single, large dose of radiation per fraction, followed by additional conventional treatments.[2] The benefits of SFRT have been demonstrated clinically[3,4] and theoretically[5] by different investigators. The theoretical calculations were usually based on linear quadratic (LQ) model for the calculations of the therapeutic ratios (TRs).[5] Normally, the Grid blocks are made of Cerrobend or lead.[6] While some publications have discussed different methods of fabricating Grid blocks.[7,8] Almendral et al.[7] introduced a simple method to construct a hybrid Grid pattern using both block and multileaf collimator (MLC). Zhu et al.[8] investigated the feasibility of fabricating Cerrobend Grid block using 3D printing. Recently, new advancements of technologies such as Tomotherapy and Cyberknife were used for a virtual Grid therapy.[9,10] In addition, the MLC-based Grid approach is widely used, and its feasibility was demonstrated by many authors.[4,11] The MLC-based Grid technique has many advantages, such as the ease of creating the MLC Grid shape and no need for carrying and mounting of the heavy Grid block. However, it has found from clinical experience, that the main drawback of the MLC-based approach is the relatively long delivery time in comparison with the Grid block approach.[12]
A specific design of a physical Grid block may define the fraction of the target volume that will receive the primary radiation through the holes of the block and the fraction of the target volume that will receive scattered and transmitted radiation. The patterns of the radiation distributions over the target volume may affect the therapeutic response of Grid therapy. Several studies were performed on the clinical response of tumors, with different radiosensitivities, using Grid therapy.[4,13,14] It is noteworthy that the majority of the clinical data that was obtained within the past several years were based on the Grid blocks with an arbitrarily selected 1 cm hole diameter. Therefore, the impact of the Grid hole diameter and spacing between the holes on its therapeutic parameters remained unresolved.
In our previous investigations, the effectiveness of the Grid therapy has been evaluated for tumors with different radiation sensitivities. The impact of the geometrical design of the Grid blocks was evident during these experiments.[15] In the present study, we have developed a novel method to investigate the design of an optimal Grid block with maximum TR, minimum geometric sparing factor (GSF), and optimum ratio of the open to blocked area (ROTBA). These investigations were performed by calculating the TRs of different Grid blocks with different hole diameters and hole spacing using Monte Carlo (MC) simulation techniques.
An optimal Grid block was manufactured based on the data from the simulations. Finally, the results of the MC simulated data were validated using experimental dosimetric techniques.
MATERIALS AND METHODS
Dose distributions for 25 Grid blocks with different hole diameters and center-to-center spacing were obtained using MC simulation technique. For each Grid block, the therapeutic and geometric parameters were determined from calculated dose distributions by the following methods.
MONTE CARLO SIMULATION
The Geant4 toolkit (Version 9.6.p02) was used to simulate the head of the Varian 2100C linear accelerator for a 6 MV photon beam based on the vendor's parameters.[16] The simulations were performed in two steps. First, the accelerator head and primary collimator were simulated to create the photon spectrum in a plane, located before the jaws, which will be referred to as the “phase space.” A total number of 109 events were generated from the initial electron source to collect 50 million particles in the phase space as a scored plane with dimensions of 40 cm × 40 cm × 0.2 cm. Second, the phase space file served as a source for simulating the dose distribution in water phantom located after the Grid block. Cross-section libraries from the Livermore physics list[17] were used to create interpolated and tabulated cross-section data for investigating the photon and electron interactions with matter. A 1 mm range cutoff in water, which corresponds to an energy cutoff 350 keV for electrons and positrons, and 5 keV for photons, was selected in these simulations. These cutoff ranges were well covered by a low energy package for electromagnetic interactions.[18] The water phantom used for these simulations had a dimension of 30 cm × 30 cm × 30 cm. The center of the water phantom was modeled to be along the central axis of the beam, and the phantom was divided into a set of voxels with dimensions of 2 mm × 2 mm × 2 mm. The accuracy of the MC simulation was verified by comparison of the simulated and measured percentage depth dose (PDD) and the dose profile at the depth of 5 cm in a water phantom for a 10 cm × 10 cm open field size. The measurements were performed with a calibrated PTW-31010 Semiflex ionization chamber (PTW-Freiburg, Germany).
Next, dose distributions of 25 different patterns of Grid blocks were calculated using the phase space file in MC simulation. The hole diameters of these Grids were 0.5 cm, 0.75 cm, 1.0 cm, 1.25 cm, and 1.5 cm, while the center-to-center distances were 1.7 cm, 1.8 cm, 1.9 cm, 2.0 cm, and 2.1 cm. The Grids were assumed to have a hexagonal pattern[19] with divergent holes. The thicknesses of the Grid blocks were chosen to be 7.5 cm of lead.
Therapeutic parameter calculations
In this study, we considered GSF and TR as the therapeutic parameters and ROTBA as a geometrical parameter of the Grid blocks. A dose profile obtained from MC simulation, across a single hole of the Grid, with 6 MV x-ray beam at 5 cm depth in water phantom was used to calculate the survival fraction (SF) of normal and tumor tissues placed under the Grid block. Recently, some studies have discussed the suitability of the LQ model for describing SFs at high doses (>12 Gy).[20,21,22] However, Kirkpatrick[22] has shown that the LQ model underestimates the surviving fraction in the high-dose range. The Hug–Kellerer (H-K) model is a radiobiological model that was introduced for high-dose range.[23] In this study, both the LQ and the H-K models were used for determination of SF in a nonuniform dose distribution field using the following:

where α and β are radiobiological parameters in LQ model and k1, k2, and k3 are parameters in H-K model. These parameters are interrelated as follows:

In Equation 1, Vi represents the relative number of cells that receive a dose value ranging from Di and Di +1. [Figure 1] shows a schematic diagram for the beam's dose profile under a single Grid hole. Assuming a uniform distribution of the cells within the irradiation volume as a disc with 0.1 mm thickness, Vi is calculated as the ratio of the volume of each disc to the total volume under a Grid hole, where rmax is the radius of the largest circle under one hole.
Figure 1.
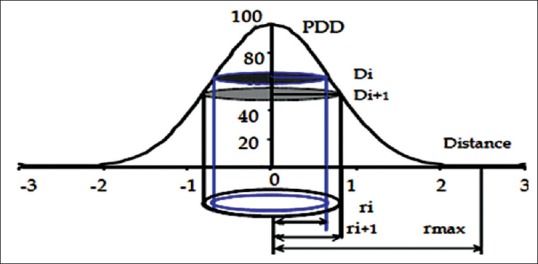
Schematic diagram of the dose profile under a single hole in a Grid field with the related parameters that were considered for therapeutic ratio calculations

This radius is the same as half of the center-to-center distances between the holes. It should be noted that, because of the hexagonal pattern of the Grid holes, the area between the largest circular disc and hexagonal shape was calculated by considering the area of this segment as: area of hexagon- . The tissue cells in these discs are assumed to receive nearly uniform irradiation dose (±1%).
Tumors were categorized into 3 groups based on their SF values for 2 Gy dose (SF2): radiosensitive tumors (SF2 < 0.4), semisensitive tumors (SF2 = 0.4), and radio-resistant tumors (SF2 > 0.4). The value of 0.4 was determined based on clinical data from Bjork-Eriksson.[24] In addition, it was assumed that the SF2 value for normal tissue is constant (SF2 = 0.4). The values of α/β ratios for tumor cells and normal cells were considered to be 10 Gy and 2.5 Gy, respectively.[25] The values of the SF2 and α/β ratios for normal and tumor tissues were used in equations 1 and 2 to determine the α, β and k1, k2, k3 parameters for the two radiobiological models [Table 1]. It is worth to note that, in spite of different radiobiological parameters (i.e., α, β) that were reported in the previous clinical data, since a relative comparison was considered between 25 different patterns of Grid blocks, our tumor cell classification based on the tumor radiosensitivity seems as a comprehensive procedure.
Table 1.
Sample α, β, K1, K2 and K3 values of tumor (T) and normal (N) cells for three different types of tumors cells

The equivalent uniform dose for tumor tissues (EUDTumor) was introduced as the uniform dose that will result in survival of the same number of clonogens as the nonhomogeneously irradiated tumor.[26] This term was also generalized for nonhomogeneously irradiated normal structures as EUDNormal.[27] In Grid therapy, the EUD is defined as the absorbed dose from a single fraction of open field uniform irradiation that creates the same tumor or normal SF as the Grid therapy, as shown below[28]:

Another parameter that has been used for Grid therapy is the geometrical sparing factor (GSF). This parameter identifies the risk of normal tissue complications from Grid therapy. A smaller GSF represents greater normal tissue sparing and higher TR advantage.[29] Although GSF is usually defined for brachytherapy treatments,[30] we have considered it for Grid therapy as a virtual brachytherapy technique.[10] We have investigated the variation of GSF for different Grid designs. The GSF for a Grid block was defined as the ratio of the EUD value of the normal tissue to EUD value of the tumor (equation (5))

The GSF values for 25 different Grid geometries were calculated using the SFs determined from the MC simulated dose distribution and equation 5. For a given hole diameter, the GSF values were calculated from the average GSF for different hole spacings. Similarly, for a given hole spacing, the GSF values were calculated from the average of the GSF for Grids with different hole diameters. To determine the statistical impact of hole diameter and hole spacing on the GSF, two-way ANOVA testing was employed using OriginPro 8 (OriginLab Corporation) software. TR values were calculated for each Grid design. TR was related to increase of the normal tissue SFs as:

SFnormal (Grid) and SFnormal (EUDTumor) are the SF of the normal tissue for the Grid therapy dose and SF of the open field with equivalent uniform dose of the tumor, respectively. Most of the published clinical data are based on Grid blocks with a 1.0 cm hole diameter and a 1.8 cm center-to-center distance at the isocenter.[13,14] Therefore, for comparison between different Grid designs, a similar Grid pattern (i.e., distribution of Grid holes) has been considered as a reference Grid.
Since the prescription dose of 15 Gy per fraction in megavoltage Grid therapy is widely accepted,[13,14,31,32] this dose was considered for comparison of the TR values of different Grid blocks. The EUD for a Grid with a 1.0 cm hole diameter and 1.8 cm center-to-center distance was calculated. As suggested by Zwicker et al.,[33] for all other Grid geometries with different hole diameters and center-to-center distances, the maximum doses for different Grid designs were adjusted such that the EUD value remains the same.
The ROTBA is a geometrical parameter that can be considered for assessment of different Grid block designs. In this study, the ROTBA parameters were calculated from 2D projections of the different Grid designs at the linear accelerator isocenter for a 10 cm × 10 cm Grid field.
Grid manufacturing
To validate the data based on MC simulation, a sample Grid block was fabricated with the characteristics of the optimum Grid block. This Grid was constructed by casting 149 divergent apertures with a hexagonal pattern in a 7.5 cm thick block of lead. Computer numerical control machining was used to fabricate the Grid block from the lead. The Grid support plate has the same dimensions as the wedge plate, but it also has its top surface open. The Grid can provide a maximum field size of 20 cm × 20 cm at the isocenter.
Dosimetric characteristics of this Grid block, such as beam profiles, isodose distributions, output factor, and PDD, were experimentally determined. Measurements were performed for a 6 MV X-ray beam using EBT3 Gafchromic film to obtain dose profiles and thermoluminescent dosimeter (TLD) in Solid Water™ phantom material for the output factor measurements. The PTW 310014 pinpoint ionization chamber was used in water phantom to confirm dose profiles and output factor dosimetry measurements. Gamma analysis[34] was used to evaluate agreement between the PDDs and beam profiles obtained from the ionization chamber measurements and film dosimetry.
Dosimetric characteristics of the optimal Grid block
Ionization chamber measurements
Ionization chamber measurements were performed using a PTW 3D radiation scanning system. The system consisted of a T10001–11350 electrometer, PTW-tbascan1.3 data acquisition/processing software, and a PTW 310014 pinpoint ionization chamber. This ionization chamber was calibrated according to recommendations of the IAEA TRS-398 protocol.[35] The sensitive volume of the chamber is 0.01 cm3, which provides a sufficiently small spatial resolution, relative to the Grid hole diameter. The Grid output at dmax for field size of 10 cm × 10 cm, PDD, in-plane and cross-plane beam profiles were measured in a water tank with dimensions of 50 cm × 50 cm × 70 cm. In addition, dose profiles for different Grid field sizes were measured using pinpoint ionization chamber detector to investigate the dependence of the valley to peak ratio and dose distribution under a single Grid hole on the Grid field size. These parameters were used for determination of the TR for Grid.
Gafchromic film and thermoluminescent dosimeter dosimetry measurements
Gafchromic EBT3 (batch number 04141402) was used to perform film dosimetry for dose profiles within the Grid irradiation field in Solid Water™ phantom. For TLD measurements, GR-207A TLD was used to measure the dose at points of interest. These TLDs were manufactured by Fimel Company (Fimel, Velizy, France). These disk-shaped TLD chips have a dimension of 4.5 mm × 0.8 mm. The details of our dosimetry procedures, for both Gafchromic film and the GR-207A TLD, are described in our previous publications.[36,37] Therefore, they will be described here very briefly.
For both film and TLD dosimetry, calibrations were performed from 1 to 18 Gy with increments of 1 Gy and 3 Gy, respectively. Due to the variable dose rates within the Grid field, the film and TLD response sensitivities to the dose rate were evaluated. These evaluations were performed by calibrating the dosimeters using dose rates of 100 MU/min, 300 MU/min, and 500 MU/min from the linear accelerator. The accuracy of dose calibrations with TLD chips and EBT Gafchromic film dosimeter were confirmed by cross-calibration with a Semiflex ionization chamber (31010, PTW). The dose uncertainty associated with our film dosimetry system was estimated according to the formulas proposed by Devic et al.[38] The output of the Grid at dmax for field size of 10 cm × 10 cm, beam profiles, and PDD were measured in Solid Water™ slabs using EBT Gafchromic film.
Radiation dosimetry was performed with TLD at points of interest in several different depths (dmax, 5 cm and 10 cm) using slabs of Solid Water™ phantom material. These phantoms were carefully machined to accommodate the TLDs at the center of the Grid holes and also in the blocked areas.[5] In these experiments, a total of 9 chips were located at the center of the Grid holes and 9 chips were placed at the blocked areas. The responses of the irradiated TLDs were obtained using the Lecteur de Thermoluminescence Manuel reader system (Fimel, Velizy, France).[39] These responses were then converted to dose, using the calibration of the TLD responses in open field irradiation.
RESULTS
Monte Carlo simulation
Comparing the MC-simulated and experimentally measured PDD and beam profile for a 10 cm × 10 cm open field showed a good agreement between the data sets. More than 90% of the points were passing the gamma comparison to within 3%/3 mm clinical criterion. These results indicate the accuracy of the MC simulations used in this project. The simulations have statistical uncertainties of ±1%. The MC simulated dose profiles of Grid blocks are obtained for hole diameters of 0.5 cm, 0.75 cm, 1.0 cm, 1.25 cm, and 1.5 cm, with a constant center-to-center spacing of 1.8 cm, at a depth of 5 cm, in water phantom. These results indicate that the dose to valley increases as the hole diameter increases.
Therapeutic parameters calculations
Table 2 shows the mean and standard deviation of calculated GSF as a function of tumor radiosensitivity for each Grid hole diameter and hole center-to-center distance. The differences between GSF values from both LQ and H-K models were found to be <1%. The values of EUD used in this project were 4.41 Gy and 4.40 for LQ and H-K models, respectively.
Table 2.
The geometrical sparing factor for the Grids with different hole diameters and hole center-to-center distances as a function of tumor’s radio-sensitivity

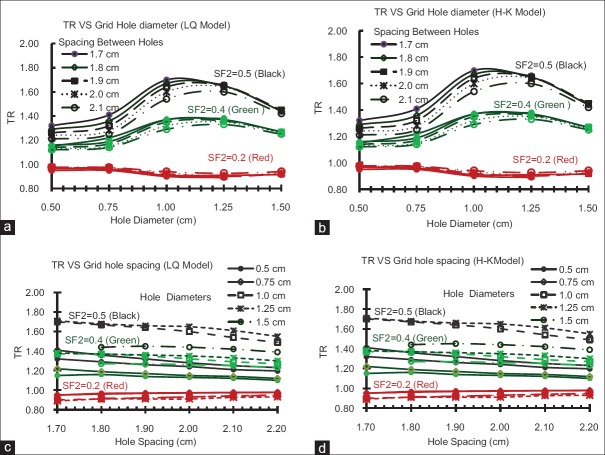
The dependence of GSF value on the hole diameter and spacing of the Grid block was found to be statistically significant (P < 0.01). The impact of the Grid hole diameter and hole center-to-center spacing on TR is shown in Figure 2 for both LQ and H-K models. The difference of the TR values between these models is about 1%. These results indicate that the TR of the Grid block is dependent on the radio-sensitivity of the tumor (i.e., presented here as SF2 value) and size of the Grid holes. For example, with the LQ model, the TR values for radio-resistant tumors (i. e. SF2 >0.4) changes from 1.2 to 1.7 as the hole diameter increases from 0.5 to 1.1 cm. This is a 42% increase on TR. For a given hole diameter, the TR value is changing about (±4%) by changing the spacing between the Grid holes from 1.7 cm to 2.1 cm. Figure 2c shows that TR values may decrease as spacing between the holes increases. Similar results are observed with the H-K model. In addition, as shown in Table 2, a Grid with hole size in this range has a smaller GSF value, which confirms it is potential clinical benefit. Moreover, for this Grid, the calculated ROTBA value for a 10 cm × 10 cm Grid field was found to be close to unity (±10%) as shown in Table 3.
Figure 2.
The influence of the Grid hole-diameter on the therapeutic ratio of the tumors with different radio-sensitivities for (a) linear quadratic model and (b) Hug–Kellerer Model. The influence of the Grid hole center-to-center spacing on the therapeutic ratio of the tumors with different radio-sensitivities for (c) linear quadratic model and (d) Hug–Kellerer model
Table 3.
The ratios of the open to blocked area parameters are shown for a 10×10 cm2 Grid field with different designs
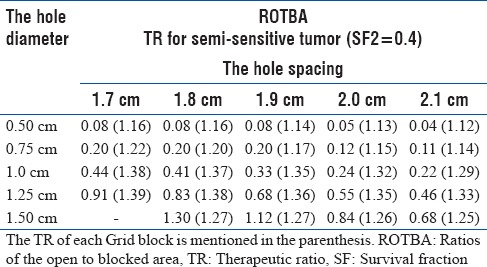
According to the therapeutic and geometric parameter calculations, the optimum Grid block design should include the following: 1-Grid blocks should have a hole diameter >1.0 cm and <1.5 cm. 2-The ROTBA should be close to unity to achieve an optimal TR value, 3-with the least GSF value. Based on these definitions, a Grid block with a hole diameter of 1.25 ± 0.05 cm and a hole center-to-center distance of 1.7 ± 0.05 cm is recommended as an optimal Grid block.
TDosimetric characteristics of the optimal Grid block
The dosimetric parameters of the optimal Grid block have been measured with EBT3 Gafchromic film, TLD, and ionization chamber. Figure 3 shows the calibration curves for TLD dosimetry. Figure 4 shows the EBT3 film calibration for a 6 MV X-ray beam. The film response was obtained as a linear response in red channel (The R2-values was about 0.98). Dose-response dependencies on the dose rate of the linear accelerator were found to be within 1% and 2% for TLD and film dosimetry, respectively. In addition, the total dose uncertainty was found to be up to 4.7% for the red channel calibration curve using film dosimetry.
Figure 3.
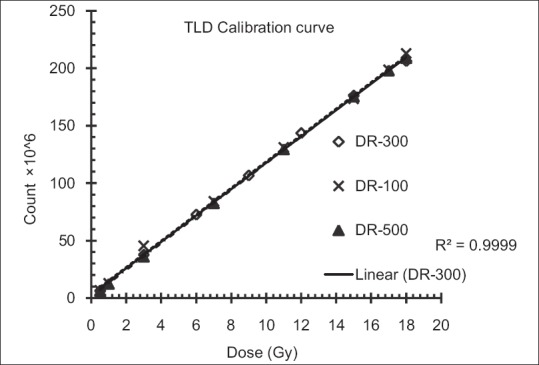
Calibration curves for GR-207A thermoluminescent dosimeter for three different dose rates
Figure 4.
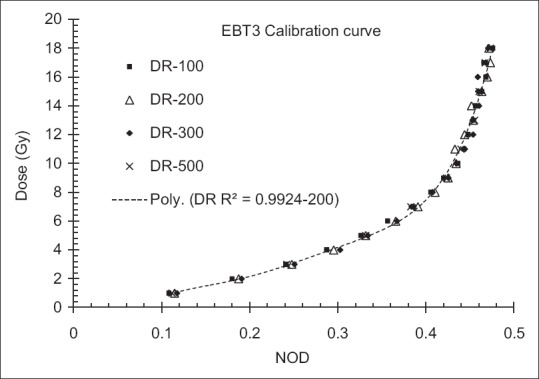
Calibration curve for Gafchromic™ EBT3 film for 6 MV X-ray beam for different dose rates
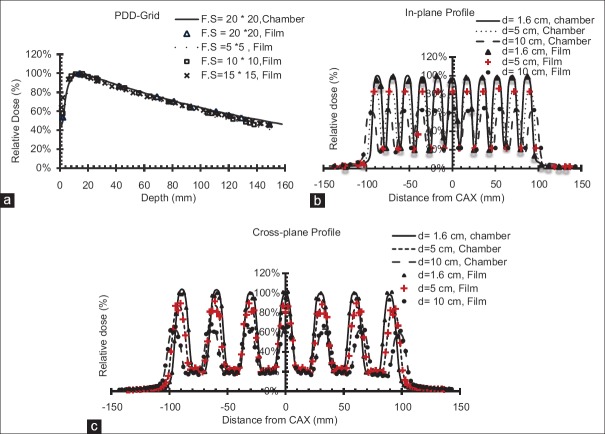
The output of the optimal Grid block at depth of maximum dose was obtained as 0.86 cGy/MU, 0.85 cGy/MU, and 0.83 cGy/MU using TLD, ionization chamber, and film dosimetry, respectively Table 4]. There was <3% difference between measured outputs from different dosimetry techniques. In addition, Table 4 shows the values of the outputs, at different depths, in open and blocked areas of the Grid field. These results indicate a good agreement (±4.4%) between the three techniques. The average of these three outputs was considered to determine the monitor unit required for delivery of a given dose. [Figure 5 represents an excellent agreement (±5%/5 mm) between the different dosimetric techniques in measuring PDD and dose profiles. In addition, there was good symmetry and well-pattern dose profiles for the manufactured Grid block in both in-plane and cross-plane directions [Figure 5]. Figure 6 shows that the dose profile under each Grid hole (i.e., FWHM as well as the Peak to Valley ratio) is independent of the Grid field size. Therefore, the TR and GSF values are not dependent on the Grid field size.
Table 4.
Dose output factor (cGy/MU) for the optimal Grid block, for 10×10 cm2 Grid field size, as a function of depth measured with thermoluminescent dosimeter and film in Solid Water™ and in the ionization chamber in water phantom
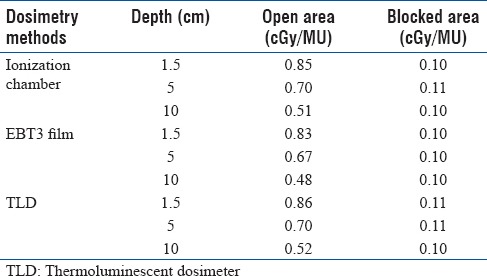
Figure 5.
Comparison between film and ionization chamber measured percentage depth dose as a function of field size for (a) in-plane dose profile, (b) cross-plane dose profile, and (c) as a function of depth
Figure 6.
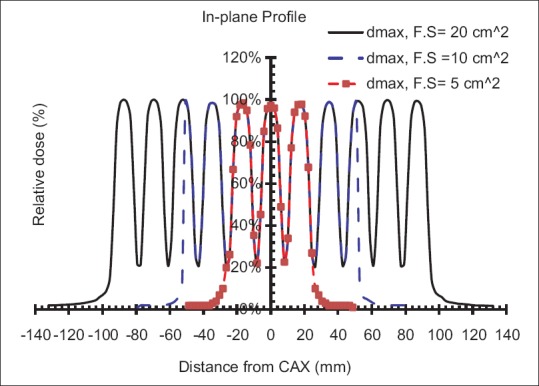
In-plane dose profile from ionization chamber measurements for 20 cm × 20 cm, 10 cm × 10 cm and 5 cm × 5 cm Grid field sizes
Table 5 shows a good agreement (within 5%) between the MC-simulated and the measured therapeutic, geometric, and dosimetric parameters of the Grid. These results demonstrate the power and accuracy of MC simulation methods for guiding Grid block design.
Table 5.
Comparison between dosimetric characteristics of the Grid with Monte Carlo simulation

DISCUSSIONS AND CONCLUSIONS
In this study, we performed a dosimetric simulation of 25 Grid blocks with different hole diameters and hole center-to-center distances for assessment of the therapeutic and geometric parameters of the Grid block using both the LQ and H-K models.
The calculated GSF values show that changing the hole diameter and hole spacing of a Grid block have a significant impact (P < 0.01) on sparing normal tissue in this radiation therapy technique. Figure 2 demonstrates increased therapeutic response with SF2 of tumor for both LQ and H-K radiobiological models. These findings correlate well with previous studies.[13,15] The Grid therapy response for different types of tumor cells with considering different values of α/β ratios was introduced elsewhere.[15] It is worth to note that considering different values of radiobiological parameters (i.e., α, β for LQ model and k1, k2, k3 for H-K model) may lead to different values for TRs, but this effect does not change the results of this study because a relative comparison was performed between 25 Grid block designs to introduce an optimal Grid block.
Moreover, our study shows that for radio-resistant tumors (SF2 > 0.4), appropriate design of the hole diameter and hole spacing may lead to 40% higher clinical response relative to Grid blocks with hole diameters smaller than 1.0 cm or larger than 1.25 cm. However, no significant changes are seen for radio-sensitive tumors. Considering the therapeutic parameters, TR and GSF, Grid blocks with hole diameters between 1 and 1.5 cm and hole spacing between 1.7 and 1.9 cm provide the optimal therapeutic parameters. Since the TR values are independent on the Grid field size [Figure 6], a Grid field size of 10 cm × 10 cm was considered for different Grid designs comparison.
Interestingly, regarding the clinical benefits of Grid therapy, prior publications used Grid blocks with hole diameter and spacing in similar ranges as of our study.[3,4,13,31] In a study by Zwicker et al.,[33] the advantage of Grid therapy was demonstrated theoretically using Grid blocks with hole sizes of 1.3 cm. The optimal Grid hole diameter in our study (1.25 ± 0.05 cm), which was determined from a wider range of Grid designs, was very close to their findings. In addition, Grid blocks with a hole diameter of 1.25 cm and hole spacing of 1.7 cm have ROTBA parameter close to 1:1 within (±10%). This means that the open and blocked areas are approximately equal in our optimal Grid block. This ratio has been previously considered for Grid block manufacturing.[32] ROTBA can be dependent on the Grid field size, but in this study, a constant Grid field size (10 cm × 10 cm) was considered for all simulations to ease of comparisons between different Grid designs.
We have also shown that alternative radiobiological models (i.e., high-dose versus low dose) do not make a difference in the calculation of TR values by more than 1%. This could be attributed to the small volume of tissue that receives high doses of radiation under the Grid hole.[40]
Although we have introduced a calculation model to design a block-based Grid, a similar method can be implemented for virtual-based or MLC-based Grids. An appropriately designed Grid can improve the therapeutic response in SFRT.
Financial support and sponsorship
This research has been supported by Tehran University of Medical Sciences and Health Services with grant number 93-01-30-25092.
Conflicts of interest
There are no conflicts of interest.
REFERENCES
- 1.Tamura M, Monzen H, Kubo K, Hirata M, Nishimura Y. Feasibility of tungsten functional paper in electron Grid therapy: A Monte carlo study. Phys Med Biol. 2017;62:878–89. doi: 10.1088/1361-6560/62/3/878. [DOI] [PubMed] [Google Scholar]
- 2.Zhang H, Johnson EL, Zwicker RD. Dosimetric validation of the MCNPX monte carlo simulation for radiobiologic studies of megavoltage Grid radiotherapy. Int J Radiat Oncol Biol Phys. 2006;66:1576–83. doi: 10.1016/j.ijrobp.2006.08.059. [DOI] [PubMed] [Google Scholar]
- 3.Huhn JL, Regine WF, Valentino JP, Meigooni AS, Kudrimoti M, Mohiuddin M, et al. Spatially fractionated Grid radiation treatment of advanced neck disease associated with head and neck cancer. Technol Cancer Res Treat. 2006;5:607–12. doi: 10.1177/153303460600500608. [DOI] [PubMed] [Google Scholar]
- 4.Peñagarícano JA, Moros EG, Ratanatharathorn V, Yan Y, Corry P. Evaluation of spatially fractionated radiotherapy (Grid) and definitive chemoradiotherapy with curative intent for locally advanced squamous cell carcinoma of the head and neck: Initial response rates and toxicity. Int J Radiat Oncol Biol Phys. 2010;76:1369–75. doi: 10.1016/j.ijrobp.2009.03.030. [DOI] [PubMed] [Google Scholar]
- 5.Meigooni AS, Dou K, Meigooni NJ, Gnaster M, Awan S, Dini S, et al. Dosimetric characteristics of a newly designed Grid block for megavoltage photon radiation and its therapeutic advantage using a linear quadratic model. Med Phys. 2006;33:3165–73. doi: 10.1118/1.2241998. [DOI] [PubMed] [Google Scholar]
- 6.Meigooni AS, Gnaster M, Dou K, Johnson EL, Meigooni NJ, Kudrimoti M, et al. Dosimetric evaluation of parallel opposed spatially fractionated radiation therapy of deep-seated bulky tumors. Med Phys. 2007;34:599–603. doi: 10.1118/1.2431423. [DOI] [PubMed] [Google Scholar]
- 7.Almendral P, Mancha PJ, Roberto D. Feasibility of a simple method of hybrid collimation for megavoltage Grid therapy. Med Phys. 2013;40:051712. doi: 10.1118/1.4801902. [DOI] [PubMed] [Google Scholar]
- 8.Zhu X, Driewer J, Li S, Verma V, Lei Y, Zhang M, et al. Technical note: Fabricating cerrobend Grids with 3D printing for spatially modulated radiation therapy: A feasibility study. Med Phys. 2015;42:6269–73. doi: 10.1118/1.4932223. [DOI] [PubMed] [Google Scholar]
- 9.Wu X, Wright J, Gupta S, Pollack A. On modern technical approaches of three-dimensional high-dose lattice radiotherapy (LRT) Cureus. 2010;2:e9. DOI: 10.7759/cureus9. [Google Scholar]
- 10.Zhang X, Penagaricano J, Yan Y, Sharma S, Griffin RJ, Hardee M, et al. Application of spatially fractionated radiation (Grid) to helical tomotherapy using a novel TOMOGrid template. Technol Cancer Res Treat. 2016;15:91–100. doi: 10.7785/tcrtexpress.2013.600261. [DOI] [PubMed] [Google Scholar]
- 11.Ha JK, Zhang G, Naqvi SA, Regine WF, Yu CX. Feasibility of delivering Grid therapy using a multileaf collimator. Med Phys. 2006;33:76–82. doi: 10.1118/1.2140116. [DOI] [PubMed] [Google Scholar]
- 12.Nobah A, Mohiuddin M, Devic S, Moftah B. Effective spatially fractionated Grid radiation treatment planning for a passive Grid block. Br J Radiol. 2015;88:20140363. doi: 10.1259/bjr.20140363. [DOI] [PMC free article] [PubMed] [Google Scholar]
- 13.Mohiuddin M, Fujita M, Regine WF, Megooni AS, Ibbott GS, Ahmed MM, et al. High-dose spatially-fractionated radiation (Grid): A new paradigm in the management of advanced cancers. Int J Radiat Oncol Biol Phys. 1999;45:721–7. doi: 10.1016/s0360-3016(99)00170-4. [DOI] [PubMed] [Google Scholar]
- 14.Sathishkumar S, Dey S, Meigooni AS, Regine WF, Kudrimoti MS, Ahmed MM, et al. The impact of TNF-alpha induction on therapeutic efficacy following high dose spatially fractionated (Grid) radiation. Technol Cancer Res Treat. 2002;1:141–7. doi: 10.1177/153303460200100207. [DOI] [PubMed] [Google Scholar]
- 15.Gholami S, Nedaie HA, Longo F, Ay MR, Wright S, Meigooni AS, et al. Is Grid therapy useful for all tumors and every Grid block design? J Appl Clin Med Phys. 2016;17:206–19. doi: 10.1120/jacmp.v17i2.6015. [DOI] [PMC free article] [PubMed] [Google Scholar]
- 16.Collaboration G, Agostinelli S. Geant4-a simulation toolkit. Nucl Instrum Methods Phys Res A. 2003;506:250–303. [Google Scholar]
- 17.Cortés-Giraldo MA, Gallardo MI, Arráns R, Quesada JM, Alessio BOCCI, José M. ESPINO, et al. Geant4 simulation to study the sensitivity of a MICRON silicon strip detector irradiated by a SIEMENS PRIMUS Linac. Prog Nucl Sci Technol. 2011;2:191–6. [Google Scholar]
- 18.Didi S, Moussa A, Yahya T, Mustafa Z. Simulation of the 6 MV elekta synergy platform linac photon beam using geant4 application for tomographic emission. J Med Phys. 2015;40:136–43. doi: 10.4103/0971-6203.165077. [DOI] [PMC free article] [PubMed] [Google Scholar]
- 19.Buckey C, Stathakis S, Cashon K, Gutierrez A, Esquivel C, Shi C, et al. Evaluation of a commercially-available block for spatially fractionated radiation therapy. J Appl Clin Med Phys. 2010;11:3163. doi: 10.1120/jacmp.v11i3.3163. [DOI] [PMC free article] [PubMed] [Google Scholar]
- 20.Brenner DJ. In Seminars in Radiation Oncology. Elsevier. 2008;18:234–9. doi: 10.1016/j.semradonc.2008.04.004. [DOI] [PMC free article] [PubMed] [Google Scholar]
- 21.Chapman JD, Gillespie CJ. The power of radiation biophysics-let's use it. Int J Radiat Oncol Biol Phys. 2012;84:309–11. doi: 10.1016/j.ijrobp.2012.04.020. [DOI] [PubMed] [Google Scholar]
- 22.Kirkpatrick JP, Meyer JJ, Marks LB. 4. Vol. 18. Elsevier; 2008. In Seminars in Radiation Oncology; pp. 240–3. [DOI] [PubMed] [Google Scholar]
- 23.Ekstrand KE. The hug-kellerer equation as the universal cell survival curve. Phys Med Biol. 2010;55:N267–73. doi: 10.1088/0031-9155/55/10/N01. [DOI] [PubMed] [Google Scholar]
- 24.Björk-Eriksson T, West C, Karlsson E, Mercke C. Tumor radiosensitivity (SF2) is a prognostic factor for local control in head and neck cancers. Int J Radiat Oncol Biol Phys. 2000;46:13–9. doi: 10.1016/s0360-3016(99)00373-9. [DOI] [PubMed] [Google Scholar]
- 25.Thames HD, Bentzen SM, Turesson I, Overgaard M, Van den Bogaert W. Time-dose factors in radiotherapy: A review of the human data. Radiother Oncol. 1990;19:219–35. doi: 10.1016/0167-8140(90)90149-q. [DOI] [PubMed] [Google Scholar]
- 26.Niemierko A. Reporting and analyzing dose distributions: A concept of equivalent uniform dose. Med Phys. 1997;24:103–10. doi: 10.1118/1.598063. [DOI] [PubMed] [Google Scholar]
- 27.Niemierko A. A generalized concept of equivalent uniform dose (EUD) Med Phys. 1999;26:1100. [Google Scholar]
- 28.Zhang H, Zhong H, Barth RF, Cao M, Das IJ. Impact of dose size in single fraction spatially fractionated (Grid) radiotherapy for melanoma. Med Phys. 2014;41:021727–9. doi: 10.1118/1.4862837. [DOI] [PubMed] [Google Scholar]
- 29.Chen SW, Liang JA, Hung YC, Yeh LS, Chang WC, Lin WC, et al. Does initial 45Gy of pelvic intensity-modulated radiotherapy reduce late complications in patients with locally advanced cervical cancer? A cohort control study using definitive chemoradiotherapy with high-dose rate brachytherapy. Radiol Oncol. 2013;47:176–84. doi: 10.2478/raon-2013-0011. [DOI] [PMC free article] [PubMed] [Google Scholar]
- 30.Chen SW, Liang JA, Hung YC, Yeh LS, Chang WC, Yang SN, et al. Geometrical sparing factors for the rectum and bladder in the prediction of grade 2 and higher complications after high-dose-rate brachytherapy for cervical cancer. Int J Radiat Oncol Biol Phys. 2009;75:1335–43. doi: 10.1016/j.ijrobp.2008.12.018. [DOI] [PubMed] [Google Scholar]
- 31.Mohiuddin M, Stevens JH, Reiff JE, Huq MS, Suntharalingam N. Spatially fractionated (Grid) radiation for palliative treatment of advanced cancer. Radiat Oncol Investig. 1996;4:41–7. [Google Scholar]
- 32.Reiff JE, Huq MS, Mohiuddin M, Suntharalingam N. Dosimetric properties of megavoltage Grid therapy. Int J Radiat Oncol Biol Phys. 1995;33:937–42. doi: 10.1016/0360-3016(95)00114-3. [DOI] [PubMed] [Google Scholar]
- 33.Zwicker RD, Meigooni A, Mohiuddin M. Therapeutic advantage of Grid irradiation for large single fractions. Int J Radiat Oncol Biol Phys. 2004;58:1309–15. doi: 10.1016/j.ijrobp.2003.07.003. [DOI] [PubMed] [Google Scholar]
- 34.Low DA, Dempsey JF. Evaluation of the gamma dose distribution comparison method. Med Phys. 2003;30:2455–64. doi: 10.1118/1.1598711. [DOI] [PubMed] [Google Scholar]
- 35.Andreo P, Burns DT, Hohlfeld K, Huq M S, Kanai T, Laitano F. Absorbed dose determination in external beam radiotherapy: An international code of practice for dosimetry based on standards of absorbed dose to water. Technical Report No. TRS 398, (International Atomic Energy Agency, Vienna, Austria, 2000) [Google Scholar]
- 36.Banaee N, Nedaie H. Evaluating the effect of energy on calibration of thermo-luminescent dosimeters 7-LiF: Mg, Cu, P (GR-207A) Int J Radiat Res. 2013;11:51–4. [Google Scholar]
- 37.Gholami S, Mirzaei HR, Jabbary Arfaee A, Jaberi R, Nedaie HA, Rabi Mahdavi S. Dose distribution verification for GYN brachytherapy using EBT gafchromic film and TG-43 calculation. Rep Pract Oncol Radiother. 2016;21:480–6. doi: 10.1016/j.rpor.2016.06.005. [DOI] [PMC free article] [PubMed] [Google Scholar]
- 38.Devic S, Seuntjens J, Hegyi G, Podgorsak EB, Soares CG, Kirov AS, et al. Dosimetric properties of improved gafChromic films for seven different digitizers. Med Phys. 2004;31:2392–401. doi: 10.1118/1.1776691. [DOI] [PubMed] [Google Scholar]
- 39.Platoni K, Diamantopoulos S, Panayiotakis G, Kouloulias V, Pantelakos P, Kelekis N, et al. First application of total skin electron beam irradiation in Greece: Setup, measurements and dosimetry. Phys Med. 2012;28:174–82. doi: 10.1016/j.ejmp.2011.03.007. [DOI] [PubMed] [Google Scholar]
- 40.Gholami S, Nedaie H, Meigooni A, Longo F. In World Congress on Medical Physics and Biomedical Engineering, 7.12 June, 2015, Toronto, Canada. Springer. 2015:487–9. [Google Scholar]


