Abstract
Purpose
To compare ablation boundary sharpness after percutaneous radiofrequency (RFA), cryo (CA), microwave ablation (MWA) and irreversible electroporation (IRE) ablation in normal swine liver and kidney.
Material and Methods
Percutaneous CT-guided RFA (n=5), CA (n=5), MWA (n=5) and IRE (n=5) were performed in the liver and kidney of 4 Yorkshire pigs. Parameters were chosen to produce ablations 2–3cm in diameter with a single ablation probe. Contrast-enhanced CT imaging was performed 24 hours after ablation and animals were sacrificed. Treated organs were removed and processed for histologic analysis with hematoxylin and eosin, and terminal deoxynucleotidyl transferase dUTP nick end labeling (TUNEL). Three readers independently analyzed CT, H&E and TUNEL stained images of the ablation boundary to delineate regions of 1) viable cells, 2) complete necrosis, or 3) mixture of viable and necrotic cells which was defined as the transition zone (TZ). The width of TZ was compared across the techniques and organs.
Results
Ablations appeared as non-contrast-enhancing regions on CT with sharp transition to enhancing normal tissue. On TUNEL stained slides, the mean width (μm) of the TZ after MWA was 319 ± 157 in liver and 267 ± 95 in kidney, which was significantly lower than RFA (811 ± 477 and 938 ± 429); CA (452 ± 222 and 700 ± 563); and IRE (1319 ± 682 and 1570 ± 962) (all p<0.01). No significant differences were observed between the organs.
Conclusion
Under similar conditions, the width of the TZ at the ablation boundary varies significantly between different ablation techniques.
Keywords: ablation boundary, irreversible electroporation, radiofrequency ablation, microwave ablation, cryoablation
Introduction
In current practice, image-guided tissue ablations are extended into radiographically normal parenchyma surrounding tumor in order to completely encompass the tumor within the treatment zone for optimal treatment efficacy [1–6]. Without surgically resected tissues that can be interrogated to confirm complete tumor eradication, sufficient ablation margins are considered essential to destroy malignant cells that may have infiltrated into the healthy parenchyma and may not be radiographically apparent [7]. An ablation margin of 5mm or greater has been associated with improved local tumor control [6,8,9].
Following image-guided ablation procedures, evaluation of the region of cytotoxic treatment zone and the ablation margin is typically assessed with post-treatment contrast-enhanced CT imaging [9,10]. Ablated tissue does not enhance after intravenous contrast injection, and is therefore assumed to be successfully treated and undergoing necrosis. Transition to viable tissue often appears sharply demarcated, and sometimes is circumscribed by an enhancing rim [11]. This enhancing rim may represent tissue that has been transiently injured but is expected to recover viability [10].
All ablation techniques are predicated on delivery of non-ionizing energy into tissues using ablation applicators [12,13]. Energy dissipates with increasing distance from the applicator [14]. Therefore, the probability of cell death within the tissue receiving treatment can be non-uniform depending on the ablation technique or relevant properties of the ablated tissue. We hypothesize that there may exist a transition zone (TZ) that mixes viable and necrotic tissue at the ablation boundary [14–16], which may vary in thickness among the techniques used. The goal of this study was therefore to examine and compare ablation boundary sharpness after percutaneous radiofrequency (RFA), cryo (CA), microwave ablation (MWA) and irreversible electroporation (IRE) ablation in normal swine liver and kidney.
Material and Methods
Experimental Design
Each ablation technique was evaluated with treatment parameters commonly used in human patients to produce an ablation zone of 2–3 cm in diameter (10–14cm3 in volume) of healthy tissue using a single ablation applicator. Each ablation technique was evaluated in duplicate (kidney) or triplicate (liver) in a single animal.
Animal Model
This study was approved by the Institutional Animal Care and Use Committee and animals were housed in an Association for Assessment and Accreditation of Laboratory Animal Care accredited facility. Four male Yorkshire pigs (3–4 months old; weight range, 50–70 kg) from one supplier (Archer Farms, Darlington, Maryland) underwent percutaneous CT-guided RFA, CA, MWA and IRE. Animals were induced and maintained on continous inhaled isoflurane during the procedures according to a protocol detailed in [17]. A neuromuscular paralytic, rocuronium (0.7–0.12 mg/kg), was administered before delivering IRE pulses. Euthanasia was performed with an intravenous injection of pentobarbital sodium (87 mg/kg) and phenytoin sodium (11 mg/kg) (Euthasol; Virbac AH, Fort Worth, Texas) 24 hours after ablation.
Ablation Protocol
Following induction of anesthesia, the overlying skin was shaved and prepared with iodine, and a total of 20 percutaneous ablations were performed in the 4 swine (5 ablations per animal) under CT-fluoroscopic guidance. Percutaneous CT-guided RFA (n=5), CA (n=5), MWA (n=5) and IRE (n=5), ablations were performed in the liver (3 ablations) and in one kidney (2 ablations). Treatment sites were selected based on CT images obtained at the time of procedure, with a minimum spacing of 2–3 cm between ablation zones. Ablation techniques are summarized in table 1. Only a single device was introduced for each ablation in order to standardize the protocol and facilitate the procedure. For each technique, energy delivery settings were based on manufacturer recommendations.
Table 1.
Techniques of ablation
| Techniques | Generators | Devices and Settings |
|---|---|---|
| Radiofrequency ablation | ExAblate RF2000, Boston Scientific | 1 LeVeen probe, 3cm diameter, progressive increase from 40W to80W until roll-off |
| Cryoablation | Endocare | 1 cryo probe, 2 cycles, 8min |
| Microwave ablation | Certus, NeuWave | PR15 Certus antenna, 40W, 5min |
| Irreversible electroporation | Nanoknife, Angiodynamics | Single Bipolar electrode, 2700V, 90 pulses, 100μs |
CT Imaging
Non-contrast and dual-phase (30s and 90s) contrast enhanced CT images (Light Speed RTLS; GE Healthcare, Milwaukee, Wisconsin) were acquired to assess size of the ablation at 24h with the following parameters: tube voltage: 120 kVp, current: automatic, roation time: 0.8 s, pitch: 1.375, slice thickness: 1.25 mm and matrix: 360×360. The readers evaluated qualitatively the sharpness of the boundaries of ablation, corresponding to the transition from the ablation zone to contrast-enhancing tissue outside of the ablation zone. A two dimensional region of interest including only the low-density areas of ablation zone was drawn and the quantitative value in Hounsfield units was recorded for each ablation.
Histopathologic Analysis
Twenty-four hours after ablation, organs were removed en-bloc. If ablation applicator insertion tracts were identified on superficial organ examination, organs were sectioned parallel to the tracts. When they could not be identified, the organ was sectioned grossly at 3–5 mm intervals. The largest intact cross section of the ablation zone along with surrounding normal tissue was identified on gross examination and used for histology processing. Representative sections were fixed in 10% neutral buffered formalin solution, embedded in paraffin, sectioned at 4-μm thickness, and stained with hematoxylin and eosin (H&E), and Terminal deoxynucleotidyl transferase mediated dUTP nick end labeling (TUNEL). Stained slides were scanned under high resolution at ×2, ×10 and × 40 magnifications.
Assessment of sharpness of ablative margins
Three independent investigators performed an evaluation of CT images, H&E and TUNEL staining scans. Ablations on CT images appeared as non-enhancing regions. Length and width of the ablation as well as CT density within the ablation zone were recorded. H&E was used only to assess evidence of inflammation within the margins [18]. TUNEL is a common method for detecting DNA fragmentation, and can definitively identify non-viable cells at 24 hours [19]. The region at the ablation boundary where both viable and necrotic cells are present was labeled the transition zone (TZ) [15]. Transition zones were defined as regions where TUNEL staining decreased from >99% of cells to <5% (Figure 1). The width of the TZ was measured at 30° increments covering the entire perimeter of the ablation boundary, yielding twelve measurements per ablation.
Figure 1. Quantitative evaluation of the transition zone (TZ) after renal cryoablation.
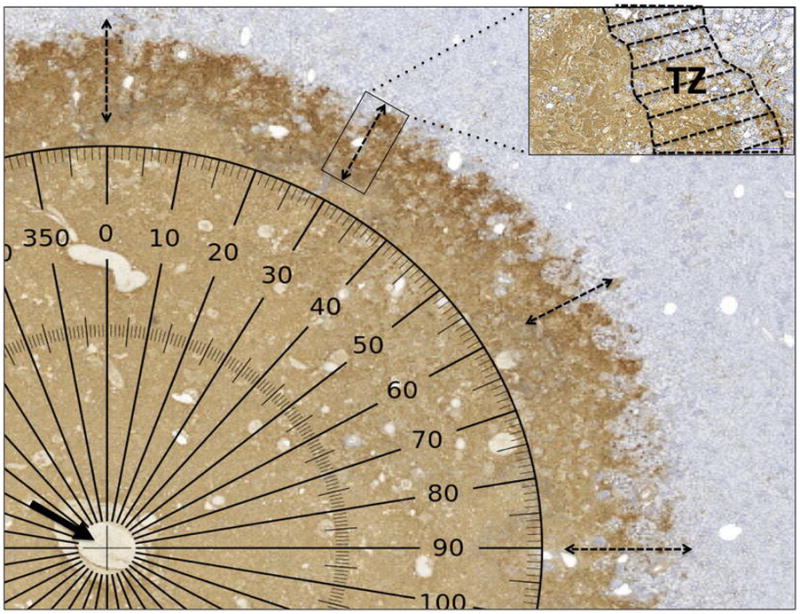
TUNEL stains nuclei with fragmenting DNA brown, while viable nuclei appear blue. The central zone of the ablation is completely non-viable and necrotic. Measurement of the TZ was performed every 30° radius. The center of the measured radius (arrow) corresponds to the cryoablation applicator track and a computer-generated protractor overlies the scanned slide.
Statistical analysis
All data were collected and image analyses were performed using Pannoramic Viewer (3DHistech Ltd, Budapest, Hungary). Each reader’s measurements were used as average values were used for comparison. The width of transition zone was compared using the t-test. P < 0.05 was considered to indicate statistically significant.
Results
Ablation boundaries on CT imaging demonstrate sharp transition to viable tissue independent of the ablation technique
Figure 2 reveals similar areas of CT hypodensity within the ablation zones for each ablation technique 24 hours after the procedure. A sharp transition to contrast-enhancing tissue outside of the ablation zone was observed in all cases. No peripheral increased density was observed. Some differences were noted in CT appearance of the ablation zone dependent on the technique used. CT Hounsfield attenuation was lower after IRE and CA (Figure 2A and C) within the ablation zone. RFA boundaries appeared more lobulated (Figure 2B). This was observed with all techniques evaluated in this study. The range of ablation size (maximum diameter) measured by CT-scan after the procedures are reported in table 2.
Figure 2. Contrast enhanced CT evaluation of ablation zones.
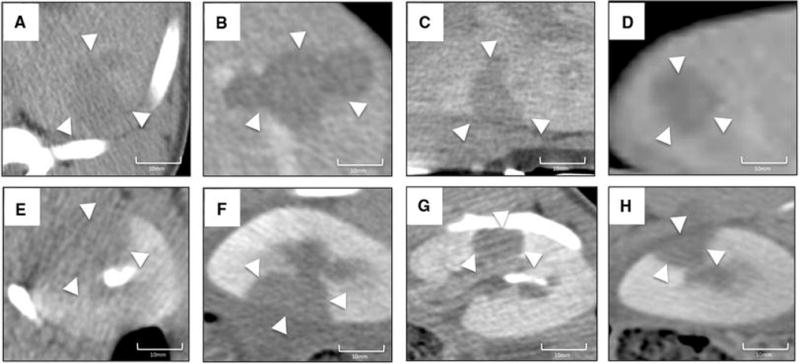
Sharp areas of hypodensity were observed after all techniques used in liver (a: irreversible electroporation; b: radiofrequency ablation, c: cryoablation, d: microwave ablations) and in kidney (e: irreversible electroporation; f: radiofrequency ablation, g: cryoablation, h: microwave ablation).
Table 2.
Size and density (Hounsfield units) of ablations on CT imaging 24hours after radiofrequency ablation, cryoablation, microwave ablation and irreversible electroporation in normal porcine liver and kidney.
| Techniques | Liver | Kidneys | ||||
|---|---|---|---|---|---|---|
| Length (mm) | Width (mm) | Density (HU) | Length (mm) | Width (mm) | Density (HU) | |
| Radiofrequency ablation | 30–35 | 20–22 | 51–52 | 24–32 | 18–24 | 43–55 |
| Cryoablation | 18–20 | 16–19 | 59–70 | 16–18 | 12–14 | 54–68 |
| Microwave ablation | 23–26 | 18 | 40–49 | 18–23 | 14–17 | 39–47 |
| Irreversible electroporation | 26–29 | 12–15 | 61–73 | 28 | 14–15 | 59–70 |
Note - value are range (mm for size and Hounsfield units for density)
Transition zone of MWA is sharper than RFA, CA and IRE in both liver and kidney
The ablation sites were analyzed grossly after each procedure. After IRE, grossly sectioned specimens showed areas of hemorrhagic change with relatively intact hepatic or renal morphology. Each hepatic lobule or renal glomeruli were visible and intact throughout the ablation area. The vessels, bile ducts and tubules appeared intact without apparent structural destruction. After RFA and MWA, a zone of cautery adjacent to the probe tract was observed with complete obliteration of the tissue architecture in the center of the area of coagulative necrosis. Other findings such as coagulative necrosis, congestion and edema after RFA, MWA and CA were morphologically similar to the lesions seen after IRE.
After staining by H&E, stained sections showed areas of extensive cell death after treatment. No viable cells were detected within the ablated area. The thermal ablation created three zones: (1) central focus with hemorrhage and necrosis, which corresponds to the peri-applicator region; (2) a mid zone of coagulative type cell death; and (3) peripheral zone of lobular cell death (in liver only). Complete cell death was achieved throughout all three zones with mostly sharp boundary separating the ablated and non-ablated neighboring cells. No inflammation was observed within the ablation and insignificant presence of inflammatory cells was noted at the boundary.
Gross examination and H&E stain histological analysis was performed in relation to TUNEL staining. TUNEL stains demonstrate DNA fragmentation within all the ablation zones in liver (Figure 3) and kidney (Figure 4). RFA and MWA appeared sometimes to have reduced staining at the center of ablation which may be related to a possible cell destruction from heating as reported previously [20]. However, TUNEL demonstrates that the sharpness of the margins differed among the techniques. After IRE and RFA, the margins appeared lobular while more uniform after CA and MWA.
Figure 3. Liver ablation zone features on TUNEL staining.
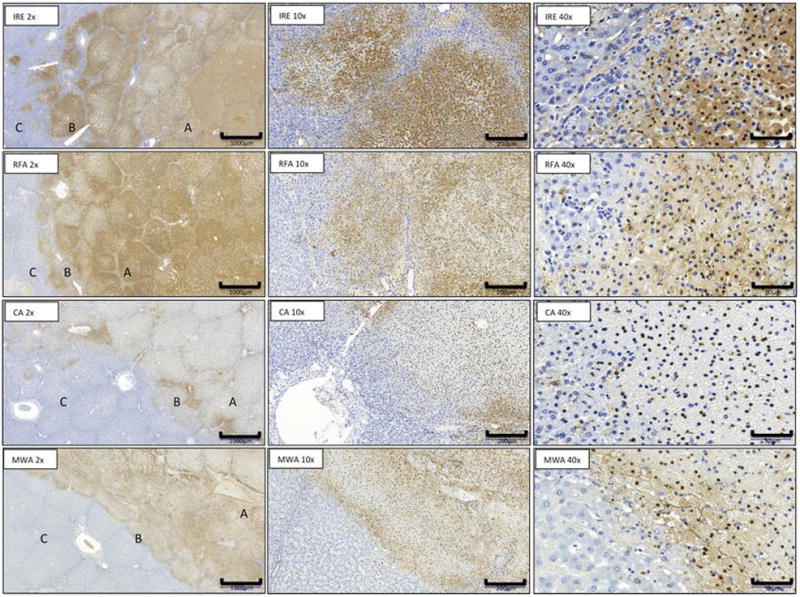
Microscopic appearance at day 1 of IRE, RFA, CA and MW ablation zone with area of necrosis (A), margins (B), and normal liver (C). (TUNEL stain; x2) and transition zone ( x10, x40 magnification).
Figure 4. Renal ablation zone features on TUNEL staining.
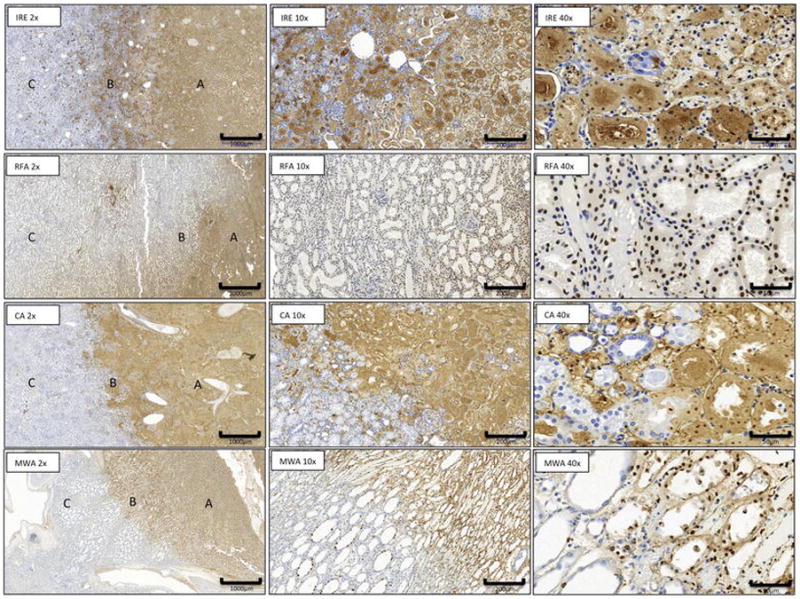
Microscopic appearance at day 1 of IRE, RFA, CA and MW ablation zone with area of necrosis (A), margins (B), and normal renal tissue (C). (TUNEL stain; x2) and transition zone ( x10, x40 magnification).
The width of this marginal transition zone mixing healthy and necrotic tissues present at the boundaries of the ablation differed among the techniques (table 3 and figure 5). In liver, MWA revealed the most narrowed radial zones of combined viable and non-viable tissues with a width significantly shorter than CA (p=0.01), RFA and IRE (both p<0.001). A significant difference was also observed after CA compare to IRE (p<0.001) and RFA (p=0.006). This width was larger after IRE than after RFA (p=0.005). In kidneys, the width after MWA was significantly shorter than CA, RFA and IRE (all p<0.001). A significant difference was also observed after CA compare to IRE (p<0.001) and RFA (p=0.009). This width was larger after IRE than RFA (p<0.001). Regardless of ablation technique, no significant differences were observed in terms of TZ width between liver and kidneys.
Table 3.
Assessment of margin border sharpness on TUNEL
| Width of Transition Zone (um) Mean ±SD | ||
|---|---|---|
| Techniques | Liver | Kidney |
| Radiofrequency ablation | 811 ± 477 [404–1277] | 938 ± 429 [606–1365] |
| Cryoablation | 452 ± 222 [275–541] | 700 ± 563 [294–941] |
| Microwave ablation | 319 ± 157 [199–449] | 267 ± 95 [191–328] |
| Irreversible electroporation | 1319 ± 682 [724–1863] | 1570 ± 962 [923–2040] |
Note - All data (in μm) are expressed as the mean ± standard deviation [interquartile range]. Transition zones were defined as regions where TUNEL staining decreased from >99% of cells to <5%.
Figure 5.
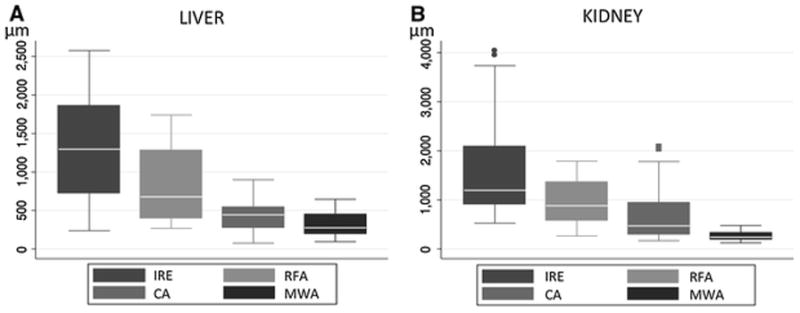
Box plots of the widths (μm) of transition zone in liver (A) and kidney (B) for each technique.
Discussion
Under similar conditions, the ablation boundary sharpness 24hours after IRE, RFA, MWA or CA differed on pathology while CT imaging features remained consistently similar. These findings can be taken into account for treatment planning and intraprocedural technique as ablation margin has been shown to correlate with local treatment success [7–9].
We evaluated the cell viability transition zone width after multiple thermal (RFA, MW and CA) and non-thermal (IRE) ablative techniques. This metric indicates whether the radially oriented shift between ablated tissue and the surrounding non-ablated tissue is abrupt or not [21]. The innermost aspect of the transition zone where cells are no longer viable on TUNEL after 24 hours histologically might represent a conservative boundary of oncologically effective treatment [22,23]. When operators intend to perform a complete tumor ablation, there should be no viable malignant cells beyond the outermost aspect of the transition zone. CA and MWA showed narrow and sharp margins while other technique had larger and more diffuse transition zones. For physicians performing tumor ablation, these results suggest that relatively wider margins for a similar tumor ablation may be necessary to achieve complete tumor killing with RFA or IRE compared to CA or MWA. This may be a contributing factor to the higher local tumor progression rates after RFA when compared to MWA for similarly sized tumors [24]. Further studies are necessary to validate this hypothesis by correlating the width of TZ with the commonly adopted follow-up and results prediction methods in percutaneous ablation of solid tumors in liver and kidney, such as the size of tumors and margins for instance [8,25].
Although operators could consider enlarging the size of their ablation when considering single-probe IRE or RFA to limit the risk of partial ablation based on our findings, the risk of damage to surrounding healthy tissues or organs may increase. Non-target ablation complications may be avoided by the use of thermal monitoring or adjunctive thermal protection such as hydrodissection or carbodissection [26]. Five mm margin increases the total volume of ablation by a factor of 2 when treating tumors 2–3 cm in size. In kidney, where the preservation of renal function is essential [5,27], shortening the width of the ablative margins may help to spare glomeruli. Regardless of the ablation technique used, tissues appeared thoroughly necrotic within the ablation zones and clearly demarcated from the background parenchyma as reported previously [28,29]. Size measurements on CT were closely correlated with pathologically determined ablation zone size [30,31]. However, various degrees of congestion, and hemorrhage changes were observed after ablation [32]. Our study showed RFA and IRE created irregular lesion boundaries, which varied in width according to techniques used and tissue ablated.
Our study confirmed that CT-scan imaging may be inadequate for accurate estimation of tumor ablation boundaries within 24 hours. While a complete ablation creates different zones of contrast attenuation on CT imaging and changing over time [21,30,33,34], it is not possible to identify specific imaging features of ablative boundaries whatever the technique used at 24 hours. The inner nonenhancing zone corresponding to a coagulative necrosis was always seen. However the well-defined progressive internal enhancement zone described 48hours after IRE [33] were not clearly seen as CT imaging was performed after injection only. The CT Hounsfield attenuation was lower after IRE (and CA), which may reflect this observation. The outer ill-defined arterial enhancement zone with rapid washout on CT perfusion images was not observed at 24hours. This inconsistent periablational hyperemia, corresponding to a transient regular rim at the margin of the ablation zone [35] and related later to the presence of inflammatory cells [33] has been reported but is not specific of a technique and may occur more lately [11,30].
This study is limited by its experimental design and the small number of ablation performed. Only one technical setting was used per technique. The techniques tested in this study work in a different fashion. The differences recorded between the different modalities might increase or decrease by varying energy output or eventually time of ablation. Further evaluations are mandatory to test this hypothesis. The transition zone of the heat-dependent ablations may depend on the radial temperature gradient, and its width may thus vary with different instrument settings. Similarly, the quantitative outcome of the ablations might be evaluate against a theoretical background such as proposed by the bioheat transfer model which establish relation of ablation and energy delivery to the tissue or energy dissipation in the tissue after thermal ablations [14,36]. Manipulations of the instrument settings may help to understand the factors important for a therapeutic ablation. Another limitation is the short follow-up, however TUNEL can definitively identify non-viable cells even at 24hours [19]. Further explorations are necessary to evaluate the effect of varying treatment settings. The bipolar IRE probe that was used has been purposefully discontinued, and its effectiveness has been questioned clinically. However in our study, similar findings than those observed after IRE using probe pairs were demonstrated on pathology [31,37–39]. Moreover we observed similar outcomes compared to the literature that came out recently demonstrating the feasibility of monopolar IRE with grounding pads [40,41].
In summary, the width of the transition zone containing mixed non-viable and viable cells at ablation boundaries varies after RFA, CA, MWA or IRE, in equivalent conditions. For a similar tumor size, operators should consider to enlarge their ablation when planning to use RFA or IRE compared to CA or MWA. These findings may help to better select a technique over another and to improve treatment planning while limiting the risks of partial ablation.
Acknowledgments
Funding Sources: The project was supported by a philanthropic grant from the Thompson Foundation. The authors acknowledge the support of NIH Cancer Center Support Grant (P30 CA008748) for core laboratory services that were used for the presented work.
Footnotes
Disclosure: Nothing to disclose
Ethical approval:
All applicable international, national, and/or institutional guidelines for the care and use of animals were followed. All procedures performed in studies involving animals were in accordance with the ethical standards of the institution or practice at which the studies were conducted.
Conflict of Interest:
The authors declare that they have no conflict of interest.
References
- 1.Goldberg SN. Radiofrequency tumor ablation: principles and techniques. European journal of ultrasound: official journal of the European Federation of Societies for Ultrasound in Medicine and Biology. 2001;13(2):129–147. doi: 10.1016/s0929-8266(01)00126-4. [DOI] [PubMed] [Google Scholar]
- 2.Kim Y-S, Lee WJ, Rhim H, Lim HK, Choi D, Lee JY. The minimal ablative margin of radiofrequency ablation of hepatocellular carcinoma (> 2 and < 5 cm) needed to prevent local tumor progression: 3D quantitative assessment using CT image fusion. Ajr. 2010;195(3):758–765. doi: 10.2214/AJR.09.2954. [DOI] [PubMed] [Google Scholar]
- 3.Beland M, Mueller PR, Gervais DA. Thermal ablation in interventional oncology. Semin Roentgenol. 2007;42(3):175–190. doi: 10.1053/j.ro.2007.04.005. [DOI] [PubMed] [Google Scholar]
- 4.Savic LJ, Chapiro J, Hamm B, Gebauer B, Collettini F. Irreversible Electroporation in Interventional Oncology: Where We Stand and Where We Go. Rofo. 2016;188(8):735–745. doi: 10.1055/s-0042-104203. [DOI] [PubMed] [Google Scholar]
- 5.Trojan J, Zangos S, Schnitzbauer AA. Diagnostics and Treatment of Hepatocellular Carcinoma in 2016: Standards and Developments. Visceral medicine. 2016;32(2):116–120. doi: 10.1159/000445730. [DOI] [PMC free article] [PubMed] [Google Scholar]
- 6.Balageas P, Cornelis F, Le Bras Y, et al. Ten-year experience of percutaneous image-guided radiofrequency ablation of malignant renal tumours in high-risk patients. European radiology. 2013 doi: 10.1007/s00330-013-2784-3. [DOI] [PubMed] [Google Scholar]
- 7.Sotirchos VS, Petrovic LM, Gonen M, et al. Colorectal Cancer Liver Metastases: Biopsy of the Ablation Zone and Margins Can Be Used to Predict Oncologic Outcome. Radiology. 2016;280(3):949–959. doi: 10.1148/radiol.2016151005. [DOI] [PMC free article] [PubMed] [Google Scholar]
- 8.Wang X, Sofocleous CT, Erinjeri JP, et al. Margin size is an independent predictor of local tumor progression after ablation of colon cancer liver metastases. Cardiovascular and interventional radiology. 2013;36(1):166–175. doi: 10.1007/s00270-012-0377-1. [DOI] [PMC free article] [PubMed] [Google Scholar]
- 9.Ahmed M, Kumar G, Moussa M, et al. Hepatic Radiofrequency Ablation-induced Stimulation of Distant Tumor Growth Is Suppressed by c-Met Inhibition. Radiology. 2016;279(1):103–117. doi: 10.1148/radiol.2015150080. [DOI] [PMC free article] [PubMed] [Google Scholar]
- 10.Velez E, Goldberg SN, Kumar G, et al. Hepatic Thermal Ablation: Effect of Device and Heating Parameters on Local Tissue Reactions and Distant Tumor Growth. Radiology. 2016:152241. doi: 10.1148/radiol.2016152241. [DOI] [PMC free article] [PubMed] [Google Scholar]
- 11.Bhardwaj N, Strickland AD, Ahmad F, Atanesyan L, West K, Lloyd DM. A comparative histological evaluation of the ablations produced by microwave, cryotherapy and radiofrequency in the liver. Pathology. 2009;41(2):168–172. doi: 10.1080/00313020802579292. [DOI] [PubMed] [Google Scholar]
- 12.Clasen S, Krober SM, Kosan B, et al. Pathomorphologic evaluation of pulmonary radiofrequency ablation: proof of cell death is characterized by DNA fragmentation and apoptotic bodies. Cancer. 2008;113(11):3121–3129. doi: 10.1002/cncr.23882. [DOI] [PubMed] [Google Scholar]
- 13.Wright AS, Sampson LA, Warner TF, Mahvi DM, Lee FT. Radiofrequency versus microwave ablation in a hepatic porcine model. Radiology. 2005;236(15987969):132–139. doi: 10.1148/radiol.2361031249. [DOI] [PubMed] [Google Scholar]
- 14.Hong B, Chen G, Zhao Y, et al. Experimental study on ablation zone and characteristics of microwave ablation in porcine kidney in vitro. Zhonghua Yi Xue Za Zhi. 2015;95(32):2644–2646. [PubMed] [Google Scholar]
- 15.Lee YJ, Lu DS, Osuagwu F, Lassman C. Irreversible electroporation in porcine liver: acute computed tomography appearance of ablation zone with histopathologic correlation. J Comput Assist Tomogr. 2013;37(2):154–158. doi: 10.1097/RCT.0b013e31827dbf9b. [DOI] [PubMed] [Google Scholar]
- 16.Deodhar A, Monette S, Single GW, Jr, et al. Renal tissue ablation with irreversible electroporation: preliminary results in a porcine model. Urology. 2011;77(3):754–760. doi: 10.1016/j.urology.2010.08.036. [DOI] [PubMed] [Google Scholar]
- 17.Sugimoto K, Moriyasu F, Kobayashi Y, et al. Assessment of various types of US findings after irreversible electroporation in porcine liver: comparison with radiofrequency ablation. J Vasc Interv Radiol. 2015;26(2):279–287. e273. doi: 10.1016/j.jvir.2014.11.007. [DOI] [PubMed] [Google Scholar]
- 18.Ierardi AM, Floridi C, Fontana F, et al. Microwave ablation of liver metastases to overcome the limitations of radiofrequency ablation. Radiol Med. 2013;118(6):949–961. doi: 10.1007/s11547-013-0968-1. [DOI] [PubMed] [Google Scholar]
- 19.Tsoumakidou G, Buy X, Garnon J, Enescu J, Gangi A. Percutaneous thermal ablation: how to protect the surrounding organs. Techniques in vascular and interventional radiology. 2011;14(3):170–176. doi: 10.1053/j.tvir.2011.02.009. [DOI] [PubMed] [Google Scholar]
- 20.Cornelis F, Buy X, Andre M, et al. De novo renal tumors arising in kidney transplants: midterm outcome after percutaneous thermal ablation. Radiology. 2011;260(3):900–907. doi: 10.1148/radiol.11110122. [DOI] [PubMed] [Google Scholar]
- 21.Blackwell RH, Li B, Kozel Z, et al. Functional Implications of Renal Tumor Enucleation Relative to Standard Partial Nephrectomy. Urology. 2016 doi: 10.1016/j.urology.2016.07.048. [DOI] [PubMed] [Google Scholar]
- 22.Brace CL. Radiofrequency and microwave ablation of the liver, lung, kidney, and bone: what are the differences? Curr Probl Diagn Radiol. 2009;38(3):135–143. doi: 10.1067/j.cpradiol.2007.10.001. [DOI] [PMC free article] [PubMed] [Google Scholar]
- 23.Moore C, Salas N, Zaias J, Shields J, Bird V, Leveillee R. Effects of microwave ablation of the kidney. J Endourol. 2010;24(3):439–444. doi: 10.1089/end.2009.0204. [DOI] [PubMed] [Google Scholar]
- 24.Georgiades C, Rodriguez R, Azene E, et al. Determination of the nonlethal margin inside the visible “ice-ball” during percutaneous cryoablation of renal tissue. Cardiovascular and interventional radiology. 2013;36(3):783–790. doi: 10.1007/s00270-012-0470-5. [DOI] [PubMed] [Google Scholar]
- 25.Choi H, Loyer EM, DuBrow RA, et al. Radio-frequency ablation of liver tumors: assessment of therapeutic response and complications. Radiographics. 2001;21(Spec No):S41–54. doi: 10.1148/radiographics.21.suppl_1.g01oc08s41. [DOI] [PubMed] [Google Scholar]
- 26.Niu L, Li J, Zeng J, et al. Comparison of percutaneous cryoablation with microwave ablation in a porcine liver model. Cryobiology. 2014;68(2):194–199. doi: 10.1016/j.cryobiol.2014.01.005. [DOI] [PubMed] [Google Scholar]
- 27.Lim HK, Choi D, Lee WJ, et al. Hepatocellular carcinoma treated with percutaneous radio-frequency ablation: evaluation with follow-up multiphase helical CT. Radiology. 2001;221(2):447–454. doi: 10.1148/radiol.2212010446. [DOI] [PubMed] [Google Scholar]
- 28.Kim YS, Rhim H, Lim HK, Choi D, Lee MW, Park MJ. Coagulation necrosis induced by radiofrequency ablation in the liver: histopathologic and radiologic review of usual to extremely rare changes. Radiographics. 2011;31(2):377–390. doi: 10.1148/rg.312105056. [DOI] [PubMed] [Google Scholar]
- 29.Brace CL, Mistretta CA, Hinshaw JL, Lee FT., Jr Periodic contrast-enhanced computed tomography for thermal ablation monitoring: a feasibility study. Conf Proc IEEE Eng Med Biol Soc. 2009;2009:4299–4302. doi: 10.1109/IEMBS.2009.5333500. [DOI] [PMC free article] [PubMed] [Google Scholar]
- 30.Koda M, Tokunaga S, Fujise Y, et al. Assessment of ablative margin after radiofrequency ablation for hepatocellular carcinoma; comparison between magnetic resonance imaging with ferucarbotran and enhanced CT with iodized oil deposition. Eur J Radiol. 2012;81(7):1400–1404. doi: 10.1016/j.ejrad.2011.03.004. [DOI] [PubMed] [Google Scholar]
- 31.Koda M, Tokunaga S, Miyoshi K, et al. Assessment of ablative margin by unenhanced magnetic resonance imaging after radiofrequency ablation for hepatocellular carcinoma. Eur J Radiol. 2012;81(10):2730–2736. doi: 10.1016/j.ejrad.2011.11.013. [DOI] [PubMed] [Google Scholar]
- 32.Lekht I, Gulati M, Nayyar M, et al. Role of contrast-enhanced ultrasound (CEUS) in evaluation of thermal ablation zone. Abdominal radiology. 2016;41(8):1511–1521. doi: 10.1007/s00261-016-0700-4. [DOI] [PubMed] [Google Scholar]
- 33.Cornelis F, Storchios V, Violari E, et al. 18F-FDG PET/CT Is an Immediate Imaging Biomarker of Treatment Success After Liver Metastasis Ablation. J Nucl Med. 2016;57(7):1052–1057. doi: 10.2967/jnumed.115.171926. [DOI] [PMC free article] [PubMed] [Google Scholar]
- 34.Solomon SB, Cornelis F. Interventional Molecular Imaging. J Nucl Med. 2016;57(4):493–496. doi: 10.2967/jnumed.115.161190. [DOI] [PMC free article] [PubMed] [Google Scholar]


