

Abstract
In this study we investigated 11 isomers with the molecular formula C6H13NO2 (m/z 131) to ascertain the potential of utilizing drift tube ion mobility mass spectrometry to aid in the separation of isomeric mixtures. This study of small molecules provides a detailed examination of the application of uniform field ion mobility for a narrow scope of isomers with variations in both bond coordination and stereochemistry. For small molecules, it was observed that in general constitutional isomers are more readily separated by uniform field mobility in comparison to stereoisomers such as enantiomers or diastereomers. Diastereomers exhibited differences in their collision cross section (CCS), but were unresolvable in a mixture, whereas the enantiomers studied did not exhibit statistically different CCS values. A mathematical relationship relating the CCS to resolving power was developed in order to predict the required ion mobility resolving power needed to separate the various isomer classes. For the majority of isomers evaluated in this study, a uniform field-based resolving power of 100 was predicted to be sufficient to resolve over half (ca. 60%) of all hypothetical isomer pairs, including leucine and isoleucine, whereas their stereoisomers (D- and L-forms) are predicted to be significantly more challenging, if not impossible, to separate by conventional drift tube techniques.
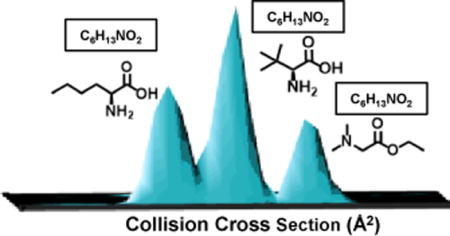
Graphical abstract
The separation of isomers, or compounds that contain the same atomic composition yet possess different chemical structures, has been an active area of analytical chemistry since the first isomer separation was documented by Pasteur in 1849.1 The biological activity of compounds exhibit isomeric specificity which manifests in a broad range of physiological processes including metabolic pathways,2 reactive oxygen species,3 and cancer research.4 Isomers represent a broad range of structural heterogeneity which are classified based on differences either in bond coordination or stereochemistry. Compounds that differ as a result of physical rearrangement of chemical bonds, (i.e. constitutional isomers) represent the most structurally diverse isomer class. Stereoisomers are compounds which have identical branching between atoms but differ in chirality at one or more stereocenters. A specific sub-class of chiral molecules are enantiomers which exhibit mirrored stereochemistry. Biological compounds tend to exist in only one particular stereochemistry,5 such as the amino acids, which predominately exist in the L-form. While the precise origin of stereochemistry preference is still unknown, observations of chirality in meteorite samples and in deep space suggests L-stereochemistry preferences are primordial.6,7 Due to identical chemical compositions, chemical isomers are of the same mass and thus are challenging to separate by traditional mass spectrometry techniques alone. Tandem MS/MS methods such as collision induced dissociation8,9 and electron transfer dissociation10–12 can alleviate these challenges in cases where two isomers either differ in bond dissociation energies or possess constitutional arrangements that produce unique fragmentation spectra. However, for structurally similar isomers, fragment ions are often shared by both precursors and hence tandem MS is not sufficient to confidently identify these components in a biological mixture (see Figure S1, Supporting Information).13,14
Ion mobility-mass spectrometry (IM-MS) has gained recent interest as a rapid separation technique which can be applied to the separation and characterization of isomers.15–20 Although condensed phase separation techniques such as gas and liquid chromatography can be tailored for the separation of specific isomeric classes, IM-MS operates on a timescale that is several orders of magnitude faster and can be used in conjunction with condensed phase separations and tandem MS/MS techniques.21,22 IM-MS is a particularly useful analytical combination in that the mass spectrometry separates molecules based on their intrinsic mass, whereas ion mobility provides a complimentary separation based on molecular size and shape based on the gas-phase collision cross section (CCS). While there has been significant progress in correlating the CCS to the primary molecular structure and composition,23–25 it is challenging to predict CCS particularly for isomeric systems. Consequently, the ability of IM-MS to separate any given isomeric system is difficult to predict without referring to empirical studies.
For our study of isomeric separations we chose to investigate the classic amino acid isomer system leucine and isoleucine, which has been previously studied by both chromatography approaches26–28 and various ion mobility techniques including field asymmetric waveform ion mobility spectrometry (FAIMS),29–31 traveling wave ion mobility spectrometry (TWIMS),32 and uniform field ion mobility operated at ambient pressure.33 This small molecule system (131 Da) was chosen as it is large enough to possess a diverse family of isomers yet small enough not to exhibit significant higher-order structural effects (i.e. conformers) that would otherwise complicate the interpretation of results. A total of eleven leucine/isoleucine isomers (C6H13NO2) were chosen for this study, including four biologically-relevant forms (L-leucine, L-isoleucine, L-norleucine, and L-tert-leucine) which collectively include examples of different bond coordination and stereochemistry (Figure 1). Although nonlinear field IM-MS techniques (e.g., FAIMS) have been shown to enhance the separation of these types of isomers, drift tube ion mobility spectrometry (DTIMS) was specifically chosen for this work, as this uniform field-based technique facilitates the quantitative comparison of separations through the empirical measurement of the CCS.
Figure 1.

Isomer classifications for various pairs of leucine or isoleucine compounds with corresponding definitions.
Experimental Methods
Preparation of Standards
Optima LC-MS grade water and ammonium acetate were purchased from Fisher Scientific (Fair Lawn, NJ, USA). 6-aminocaproic acid, L-norleucine, D-leucine, L-isoleucine, L-allo-isoleucine, N,N-dimethylglycine ethyl ester, and L-leucine were purchased from Sigma-Aldrich (St. Louis, MO, USA). D-tert-leucine, D-allo-isoleucine, L-tert-leucine and D-isoleucine were purchased from Alfa Aesar (Ward Hill, MA, USA). Samples were prepared at an initial concentration of 1 mg/mL and were subsequently diluted in water buffered with 10 mM ammonium acetate (pH 6.5) to a final concentration of 10 μg/mL for analysis. No additional acid was needed to promote protonation. All isomers investigated in this work are summarized in Figure 2.
Figure 2.
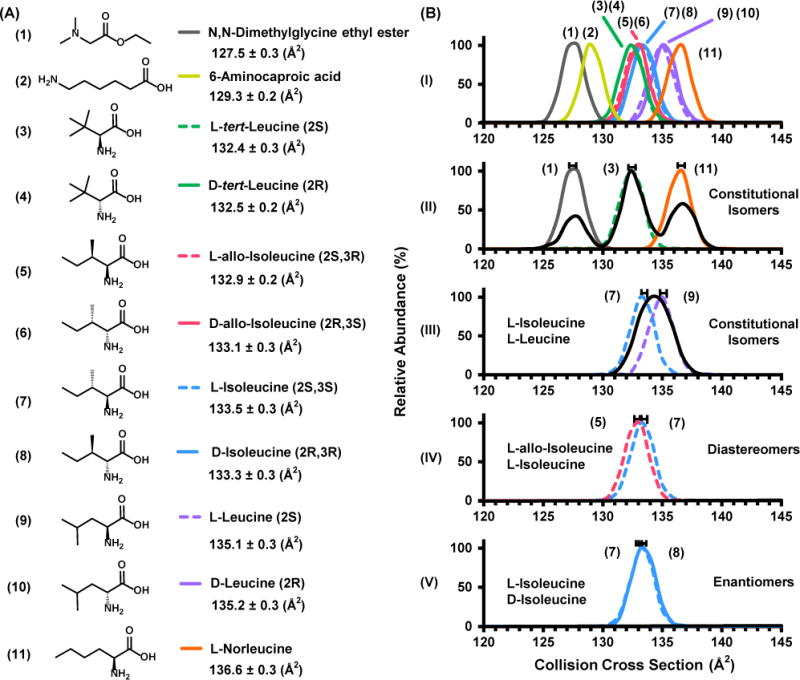
(A) The leucine/isoleucine isomers with chemical formula C6H13NO2 examined in this study. Experimental cross sections with respective standard deviations are shown at the right with corresponding stereochemistry. (B) (I) Experimental IM spectra overlays for all isomer compounds (standard error bars omitted for clarity). (II) Overlay of the IM spectra corresponding to N,N-dimethyl-glycine ethyl ester, L-tert-leucine, and L-norleucine and the IM spectrum corresponding to the mixture (black). (III) Overlays of L-isoleucine and L-leucine in addition to the equal ratio mixture. (IV and V) Overlays of diastereomers and enantiomers, respectively. IM spectra corresponding to the mixture of standards in (IV) and (V) can be found in the supporting information (see Figure S4).
Experimental Parameters
A commercial uniform field ion mobility-mass spectrometer (6560, Agilent Technologies, Santa Clara, CA, USA) was used to obtain high resolution mass spectrometry and ion mobility data (nominally 15,000 and 60, respectively). Details of the instrument have been previously described.34,35 Briefly, the instrument consists of a uniform field 78.1 cm drift tube coupled to a tandem quadrupole time-of-flight (QTOF) mass spectrometer. The drift tube is bracketed by electrodynamic ion funnels and ion mobility separations were conducted in nitrogen drift gas (4.00 Torr, ca. 30°C) for these studies. All samples were directly infused using a syringe pump (Cole-Palmer, Vernon Hills, IL) operated at 10 μL/min into a thermally-assisted electrospray ionization source (Agilent Jet Stream). The instrument was operated in positive ion mode with 3.8 kV applied to the ion transfer capillary and 1.8 kV applied to the ion focusing nozzle. Source temperatures were kept low (200℃) to aid in ionization of fragile molecules.
Ion mobility parameters were adjusted to obtain maximum resolving power as described previously.36,37 These prior studies indicate that the resolving power for drift tubes is optimized when the initial ion pulse width is small, and hence the gate width (referred to as “Trap Release Time” in this instrument) was set to a short duration (100 μs) relative to the ion drift time which is on the order of tens of milliseconds. The drift field also strongly affects the instrument resolving power, and separations were conducted at drift voltages which maximize the resolving power within the mobility and mass range of the analytes, corresponding to 14.7 V/cm (see Figure S2, Supporting Information). The nominal resolving power (58 ± 2) was consistent for all analytes investigated and represents the optimal values for singly-charged analytes for this particular instrument (see Table S1, Supporting Information).37 All mobility spectra correspond to the protonated species of the C6H13NO2 molecule. Other adducts observed (M+Na and M+K) were not evaluated further in this study.
Collision Cross Section Measurements
Cross sections were determined from a stepped field technique in which the applied voltage across the drift tube was varied in 7 increments from 550 to 1550V (7.0 to 19.8 V/cm, or 6 to 16 Td at 4 Torr) in order to determine the time ions reside outside the drift cell. The corrected drift times are then used with relevant laboratory conditions (pressure, temperature) to obtain a collision cross section value based on the fundamental low field equation, commonly referred to as the Mason-Schamp relationship (Figure S3, Supporting Information).38,39
Results and Discussion
Isomer Classifications and Separations
Figure 2 (A) illustrates the chemical structures of the 11 leucine/isoleucine isomers (C6H13NO2) with corresponding collision cross sections and standard deviations obtained in this study. All of the isomers exhibit a nitrogen cross section that spans approximately 10 square angstroms (from ca. 127 to 137 Å2) with an average CCS of 133 Å2. The percent relative standard deviation of all CCS values is ca. 0.2% for 7 sequential replicate measurements of each analyte. Mobility spectra and corresponding ion mobility data are provided in Supporting Information (Figure S4 and Table S1, respectively). Figure 2 (B-I) contains the overlaid IM spectra of all 11 isomers which were individually measured. No secondary peak features are observed for any of the individual analytes, and mobility peaks are narrow with a resolving power at the limit of the instrumentation for singly-charged ions (ca. 60).37 Figure 2 (B-II) illustrates the overlaid mobility profiles for the constitutional isomers N,N-dimethyl-glycine ethyl ester (1), L-tert-leucine (3), and L-norleucine (11). These three constitutional isomers possess a percent difference in cross section of 3.6% and 3.1%, respectively. This CCS difference is sufficient to allow for near baseline separation of the corresponding three component mixture (black trace). Figure 2 (B-III) depicts an overlay of L-isoleucine and L-leucine, which have a 1.2% difference in cross section. These two isomers are also classified as constitutional isomers, but are more structurally similar compared to the three analytes in panel B-II. While the mobility overlays of these two compounds are distinctly different, the analysis of the corresponding mixture indicates that they are unresolvable at the current level of resolving power (ca. 60).
Figure 2 B-IV and V contain the overlaid IM spectra of diastereomers and enantiomers respectively. Although the cross sections for L-allo-isoleucine and L-isoleucine are statistically different (ca. 0.4%), the mixture of both diastereomers yields a single broad distribution (see Figure S5, Supporting Information). For the enantiomers, the centroids of each peak are not statistically different. Specifically, the difference in their cross sections (0.2 Å2) is within the standard error of the measurement (± 0.3 Å2, or 0.2%). Collectively, these observations demonstrate that for relatively simple small molecules, constitutional isomers show the most disparate cross sectional differences, followed by diastereomers and enantiomers, respectively. While the correlation between structural and CCS differences is an intuitive result, these observations underscore that small molecules of this size and class predominately undergo structurally-selective IM separations under conditions of low E fields in nitrogen drift gas.
Peak Shape Modeling in Ion Mobility
Drift profiles collected from uniform field ion mobility represent a composite of individual ion arrival times and can be described by a normal distribution. Rigorously, peak shape fitting in DTIMS is accomplished using the ion transport or flux equation,39,40 but it was found that this higher level of peak fitting did not contribute to the accuracy of the fit and added an unnecessary level of complexity. Therefore, a simple Gaussian fit was used to describe the ion mobility arrival time distributions. The mean of the normal distribution represents either the measured drift time (i.e. the peak centroid) or cross section, and the standard deviation of the peak itself (σ) can be derived from the measured full width at half the maximum height (FWHM = 2.355 σ). Note that this standard deviation is not the same as the standard deviation reported for the CCS uncertainty, the latter of which is associated only with the peak centroid and is determined from replicate experimental measurements.
Figure 3 (A) illustrates the modeled mobility distributions and experimental data (dashed and solid lines, respectively) for L-isoleucine and L-norleucine (dashed lines) which are overlaid with experimental measurements (solid lines). Both peaks are separated in the individual overlays by ca. 70%, yet when a mixture of the two compounds is analyzed with equal peak abundance (Figure 3B), the actual valley between the two peaks is about 50% i.e., half-height separation. The importance of this distinction between the separation of a true mixture versus individual overlays can also be noted for the mixture of leucine and isoleucine in Figure 2 as well as the stereoisomer mixtures spectral overlays provided in the Supporting Information (Figure S5). For a given separation of two components the optimal resolution will occur when both species are in equal abundance as defined by equal ion mobility peak areas. This would occur in an equimolar mixture only if both species exhibit the same ionization efficiency. The normal distribution model allows for simulation of both equal abundance mixtures (Figure 3B) as well as practical mixtures that do not have equal abundance for each isomer. Panel C of Figure 3 portrays a mixture of D-leucine and D-tert-leucine and illustrates that an unequal ratio of two isomers can be modeled by scaling the relative abundance of the isomer in lower abundance (60% for D-leucine) as compared to the base peak. Typically, if two compounds exhibit half-height separation (50% valley, FWHM) as in panel B, the two peaks are still distinguishable even if the relative abundance of the two isomers is fairly disparate (secondary peak exhibiting around 25% of the peak area of the base peak). As the percent difference in cross section between the two peaks increases, the relative abundance of the two analytes has significantly less of an impact on the overall separation (see Figure S6, Supporting Information).
Figure 3.
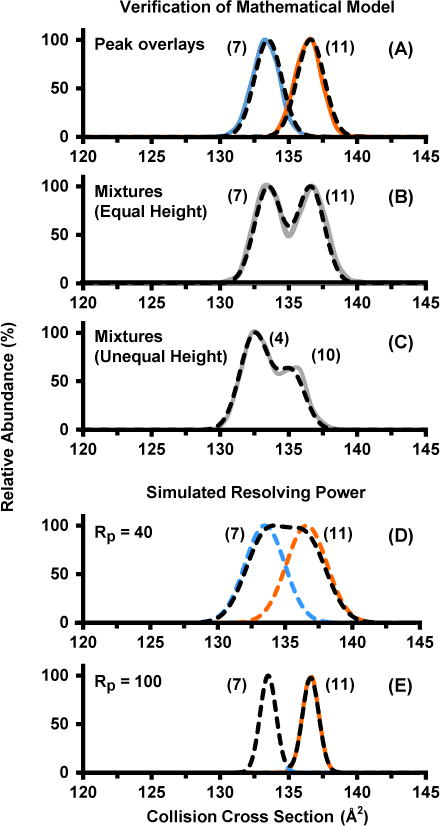
Experimental (solid lines) and modeled distributions (dashed) for isomer standards and mixtures. (A) Individual overlays for L-isoleucine (light blue) and L-norleucine (orange). (B) Mixtures of L-isoleucine and L-norleucine in equal relative abundance. (C) Experimental and modeled distributions of an unequal height mixture for D-leucine (60%) and D-tert-leucine (100%). Modeled separations for L-isoleucine and L-norleucine at simulated lower (D) and higher (E) resolving power.
Resolving Power and Separations
Resolving power for drift tube instruments has been extensively studied previously.41–43 Resolving power (Rp) is a single peak measurement defined in DTIMS as in the ion drift time (td) divided by the peak full width at half maximum height (FWHM).
| Equation 1 |
Because the relative CCS of analytes is not altered in low-field DTIMS, the peak width has a significant effect on the resulting separations. In other words, at low field, the relative spacing of analytes in either the drift time or CCS scale (the dispersion dimension) does not change and so narrowing the peak width will directly benefit the resulting resolution of two closely-spaced analyte peaks. Resolving power is thus an important metric for characterizing the resolution in low-field DTIMS instruments. Other ion mobility techniques such as TWIMS or FAIMS do not exhibit a simple relationship between resolution and their respective dispersion dimensions, and so the relationship between single-peak resolving power and two-peak resolution are more complicated and this will be the subject of future work.
A relevant and important question is how much resolving power is actually needed for a routine separation of chemical isomers. This idea has been approached in mass spectrometry by Marshall44 who noted that mass resolution precedes in “plateaus” of separating analyte systems exhibiting similar mass differences (e.g., adducts and isotopes). In order to expand this concept to uniform field studies, the mathematical modeling developed in this study was used to map the separation of two hypothetical IM peaks for varying degrees of cross sectional similarity. For a given percent difference in cross section, there exists a minimum peak width (resolving power) needed to obtain separation in a drift tube instrument. The results for 10, 50, and 90% separation are shown in Figure 4. Note that for simplicity, the plot in Figure 4 was constructed considering two peaks of equal abundance. The correlation of values depicted in Figure 4 was verified experimentally using data from the current study (circle 3) as well as higher resolving power data from other uniform field studies (circles 1 and 2). For example, a recent high pressure DTIMS demonstrated the half-height separation of phosphatidylcholine lipid isomers exhibiting a ca. 0.4% cross sectional difference by operating at greater than 300 resolving power (circle 1).45 In another study, ambient pressure DTIMS was able to demonstrate the separation of leucine and isoleucine to half-height (circle 2).46 To connect these observations to physically meaningful systems, various isomer classes are portrayed with ranges of percent difference in cross section based on the isomers in this study (colored regions, Figure 4).
Figure 4.
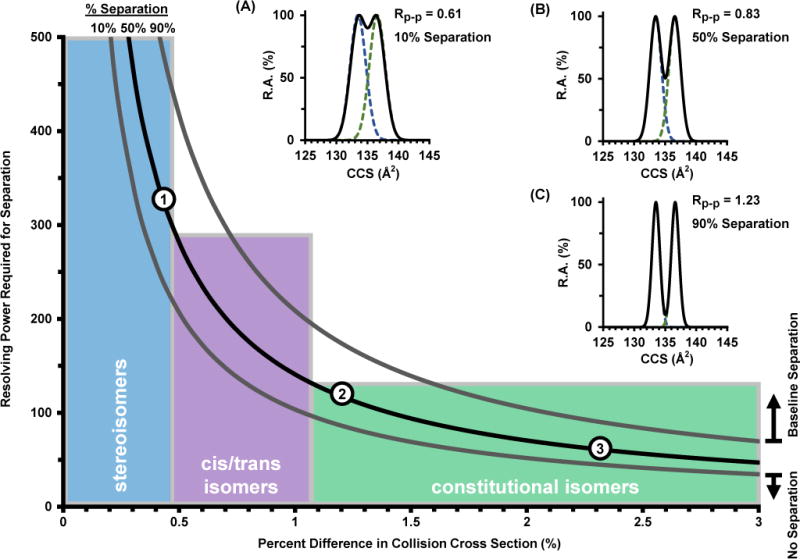
A plot of the resolving power required to separate two compounds for a given percent difference in CCS for uniform field ion mobility. The middle trace (solid black) represents a half-height separation (50%). Theoretical traces for 90, 50, and 10% separation are illustrated in the top right insets (A, B, and C) with their corresponding values for two-peak resolution. Quantiles are based on observations from this study. Experimental observations are also noted for previous uniform field studies (circles 1 and 2) and the current study (3).
Classically, the quality of a separation is quantified in terms of two-peak resolution (Rp−p), which is defined as the distance between peak centers divided by their average peak widths (Equation 2). A coefficient of 1.18 (2.355 σ / 2) is included in order to define the peak widths in half-height terms.
| Equation 2 |
The insets in Figure 4 contain theoretical distributions corresponding to two overlapping peaks of equal height, and indicate that the scale for two-peak resolution is between ca. 0.5 and 1.5 for unresolved and completely resolved peaks, respectively. Through substitution of Equations (1) and (2), resolving power and resolution have been shown to be directly correlated in ion mobility by Tabrizchi47 through the selectivity factor (α).
| Equation 3 |
For ion mobility, the selectivity factor is the ratio of the separation parameter for the two peaks which for DTIMS can be described in terms of drift time,47 reduced mobility,46 or CCS. As collision cross section represents an important physical descriptor of molecular size which is now routinely obtainable, we have made substitutions for CCS instead of α. By examining the normal distribution corresponding to the separations obtained for the leucine and isoleucine isomers, we were able to confirm Tabrizchi’s findings, and the result is Equation 4, which relates resolving power and the percent difference in CCS (ΔCCS,%) to overall separation efficiency in terms of the two-peak resolution.
| Equation 4 |
To verify Equation 4 experimentally, we examined a baseline separation of the isomers D-leucine and 6-aminocaproic acid. The predicted resolving power of 57 for each of the two isomers with a cross section difference of 4.5% should provide a peak-to-peak resolution of 1.50 using Equation 4. Comparison of these predictions to experimental data showed ca. 5 % error in the prediction with an actual two-peak resolution of 1.43, which has 94% separation, or only 6% peak overlap. The corresponding experimental and theoretical ion mobility distributions for this system are contained in Figure 5A. To examine the accuracy for Equation 4 on a broad scale, the experimental drift times and peak widths for each of the 11 isomers were matched in a pairwise comparison and the two-peak resolution (Rp−p) was calculated for all iterations (55 pairs). Collectively, over 67% of the resolution values determined from overlaying each experimental distribution deviate by less than 0.1 from values predicted through Equation 4. For reference, the insets in Figure 5 illustrate a two-peak resolution difference of 0.1 for two closely spaced peaks. Overall, the predicted resolutions for the isomer matches are in agreement to experimental measurements across a wide range of percent difference in cross section. This agreement illustrates the general applicability of Equation 4 to predict separations for both structurally similar molecules (small % difference in CCS) as well as two isomers that are readily separated (large % difference in CCS). For reference, Figure 5 also includes vertical dotted lines (blue) which delineate the number of corresponding isomer pairs which are resolvable via different degrees of resolving power. For example, at 50 resolving power, the analysis predicts that 30% of the 55 isomer pairs can be resolved. A resolving power of 100 is predicted to separate 60% of the pairs, whereas at 200 resolving power, 74% of the isomer pairs are predicted to be resolved. Finally, to resolve all isomer pairs, theory predicts a required ion mobility resolving power of ca. 2000 (Table 1), which is approximately an order of magnitude higher than current state-of-the-art instrumentation.48–50 It should be noted, however, that this determination of separation potential for closely related isomers in Table 1 (i.e., within 0.4%) is based solely on the observable percent difference in CCS, which, for these small differences is approaching the certainly limit of the measurement (± 0.2–0.3%). We emphasize that enantiomers may not be separable by uniform field ion mobility despite increases in resolving power due to identical cross sections. An unconventional approach for enantiomer separation in ion mobility was demonstrated by Hill and coworkers with the introduction of chiral drift gas modifiers, such as (S)-2-butanol,51 to facilitate separation of isomers based on differences in stereochemistry.
Figure 5.
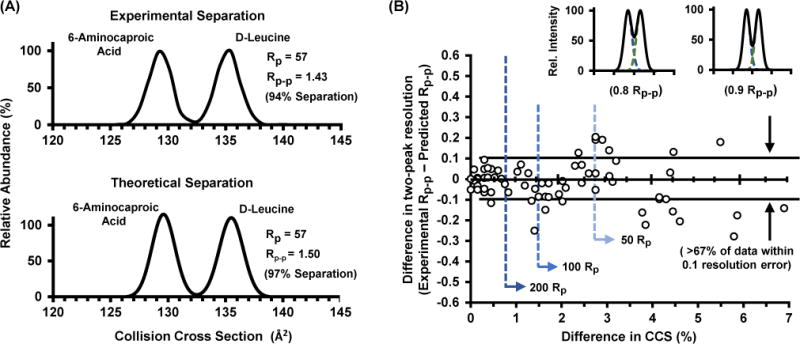
(A) Experimental (top) and theoretical (bottom) separation of 6-aminocaproic acid and D-leucine. Predicted two peak resolution is within a ca. 5% error from the experimental resolution of the two component mixture. (B) Comparison of the predicted separation via Equation 4 with experimental data corresponding to the overlay of 55 pairwise matched isomers examined in this study. More than 67% of the separations result in less than 0.1 error in two-peak resolution. A difference in Rp−p of 0.1 is illustrated in the top two theoretical traces. For half height separations, a resolving power of 200 is sufficient to separate 74% of the isomer pairwise matches. Resolving powers of 100 and 50 would be able to separate 60% and 30% of the isomer matches, respectively.
Table 1.
Predicted resolving power required to separate each of the isomer pairs at half height.
| Compounds | % Diff. in CCS | Predicted Rpa | |
|---|---|---|---|
| Enantiomers | |||
|
| |||
| D-Leucine | L-Leucine | 0.07 | 1904 |
| D-Isoleucine | L-Isoleucine | 0.15 | 939 |
| D-allo-Isoleucine | L-allo-Isoleucine | 0.15 | 937 |
|
| |||
| Diastereomers | |||
|
| |||
| D-Isoleucine | D-allo-Isoleucine | 0.15 | 939 |
| D-Isoleucine | L-allo-Isoleucine | 0.30 | 469 |
| L-Isoleucine | L-allo-Isoleucine | 0.45 | 313 |
|
| |||
| Constitutional Isomers | |||
|
| |||
| L-allo-Isoleucine | D-tert-Leucine | 0.30 | 467 |
| L-Leucine | L-Isoleucine | 1.19 | 118 |
| D-Leucine | D-tert-Leucine | 2.02 | 70 |
| D-Leucine | 6-Aminocaproic acid | 4.46 | 32 |
aThe predicted resolving power is calculated based on the percent difference in CCS for the isomer pairs and Equation 4.
Conclusions
In this current study of small molecule isomers (131 Da), typically enantiomers were on average 0.1% different in cross section. For diastereomers, the percent difference in cross section was found to be around 0.4%. Constitutional isomers represented the most resolvable isomer class, but CCS differences varied significantly, with percent differences in cross section ranging from 0.3 to 6.9%. The predictable performance of uniform field DTIMS and the capability of deriving molecular information in the form of the CCS allows for the development of a mathematical model which relates percent differences in CCS to both single peak resolving power (Rp) and two-peak resolution (Rp−p). It was found that the instrument utilized could resolve at half-height approximately one-third of the isomers chosen for this study, which represent a significant number of stereoisomers and enantiomers which are mostly unresolvable. The current state-of-the-art resolving power is approximately 250 for ambient pressure DTIMS50 and trapped ion mobility (TIMS),48 which can theoretically resolve about three-quarters (ca. 78%) of the isomer pairs. Finally, the model developed predicts that a resolving power in excess of 2000 would be necessary to resolve all combinations of the leucine/isoleucine isomers investigated in this study. Other studies from the author’s laboratory show that larger systems (nonapeptides, ca. 1100 Da) exhibit large differences in cross section (2.0%) for diastereomers due to macromolecular rearrangements based on stereochemistry. Larger molecular systems, however, will also possess significantly more possible isomeric forms than the relatively small system investigated in this current work22 and can exist as conformers which are expected to impose greater demands on the required ion mobility resolving power. The correlation between CCS and resolution developed in this and ongoing work are expected to benefit the development of computational approaches which can predict the separation of any two compounds with known CCS given that the resolving power of the ion mobility instrument utilized is well-characterized. This in turn will provide the capability for prediction of ion mobility separation behavior so as long as a high precision experimental measurement of the CCS (or other transport property) exists. The broadscale applicability of Equation 4 and Figure 4 to other ion mobility techniques (e.g., FAIMS/DMS, TWIMS, and TIMS) is currently under investigation.
Supplementary Material
Acknowledgments
Financial support for aspects of this research was provided by The National Institutes of Health (NIH R01GM099218) and under Assistance Agreement No. 83573601 awarded by the U.S. Environmental Protection Agency. It has not been formally reviewed by EPA. The views expressed in this document are solely those of the authors and do not necessarily reflect those of the Agency. EPA does not endorse any products or commercial services mentioned in this publication. Furthermore, the content is solely the responsibility of the authors and does not necessarily represent the official views of the funding agencies and organizations.
Footnotes
Supporting Information
Fragmentation data of the leucine/isoleucine related isomers studied in this work (Figure S1). Overlaid mobility distributions for an isomer separation at various drift fields (Figure S2). Table of mobility data (drift time, FWHM, CCS) for the C6H13NO2 isomers (Table S1) in addition to the conversion information to CCS (Figure S3). Additional IM spectra for isomer separations (Figure S4, S5) and the importance of ratio abundance on isomer separations (Figure S6). This material is available free of charge via the Internet at http://pubs.acs.org.
Author Contributions
The manuscript was written through contributions of all authors, each of who have given approval to the final version of the manuscript.
Notes
The authors declare no competing financial interest.
References
- 1.Flack HD. Acta Cryst. 2009;A65:371–389. doi: 10.1107/S0108767309024088. [DOI] [PubMed] [Google Scholar]
- 2.Cruz-Hernandez C, Deng Z, Zhou J, Hill AR, Yurawecz MP, Delmonte P, Mossoba MM, Dugan MER, Kramer JKG. Journal of AOAC International. 2004;87:545–562. [PubMed] [Google Scholar]
- 3.Lecoq S, Perin F, Plessis MJ, Strapelias H, Duquesne M. Carcinogenisis. 1989;10:461–469. doi: 10.1093/carcin/10.3.461. [DOI] [PubMed] [Google Scholar]
- 4.Kelly NS, Hubbard NE, Erickson KL. Journal of Nutrition. 2007;137:2599–2607. doi: 10.1093/jn/137.12.2599. [DOI] [PubMed] [Google Scholar]
- 5.Brewer A, Davis AP. Nature Chemistry. 2014;6:569–574. doi: 10.1038/nchem.1981. [DOI] [PubMed] [Google Scholar]
- 6.Cronin JR, Sandra Pizzarello. Science. 1997;275:951–955. doi: 10.1126/science.275.5302.951. [DOI] [PubMed] [Google Scholar]
- 7.McGuire BA, Carroll PB, Loomis RA, Finneran IA, Jewell PR, Remijan AJ, Blake GA. Science. 2016;352:1449–1452. doi: 10.1126/science.aae0328. [DOI] [PubMed] [Google Scholar]
- 8.Cooks RG. J Mass Spectrom. 1995;30:1215–1221. [Google Scholar]
- 9.Wells JM, McLuckey SA. Methods Enzymol. 2005;402:148–185. doi: 10.1016/S0076-6879(05)02005-7. [DOI] [PubMed] [Google Scholar]
- 10.Syka JE, Coon JJ, Schroeder MJ, Shabanowitz J, Hunt DF. Proc Nat Acad Sci USA. 2004;101:9528–9533. doi: 10.1073/pnas.0402700101. [DOI] [PMC free article] [PubMed] [Google Scholar]
- 11.Lebedev AT, Damoc E, Makarov AA, Samgina TY. :7017–7022. doi: 10.1021/ac501200h. [DOI] [PubMed] [Google Scholar]
- 12.Xiao Y, Vecchi MM, Wen D. Anal Chem. 2016;88:10757–10766. doi: 10.1021/acs.analchem.6b03409. [DOI] [PubMed] [Google Scholar]
- 13.Zaia J. Mass Spectrom Rev. 2004;23:161–227. doi: 10.1002/mas.10073. [DOI] [PubMed] [Google Scholar]
- 14.Blanksby SJ, Mitchell TW. Ann Rev Anal Chem. 2010;3:433–465. doi: 10.1146/annurev.anchem.111808.073705. [DOI] [PubMed] [Google Scholar]
- 15.Hagen DF. Anal Chem. 1979;51:870–874. [Google Scholar]
- 16.Wu C, Siems WF, Hill HH., Jr Anal Chem. 2000;72:396–403. doi: 10.1021/ac9907235. [DOI] [PubMed] [Google Scholar]
- 17.Srebalus Barnes CA, Hilderbrand AE, Valentine SJ, Clemmer DE. Anal Chem. 2002;74:26–36. doi: 10.1021/ac0108562. [DOI] [PubMed] [Google Scholar]
- 18.Fenn LS, McLean JA. Phys Chem Chem Phys. 2011;13:2196–2205. doi: 10.1039/c0cp01414a. [DOI] [PubMed] [Google Scholar]
- 19.Forsythe JG, Stow SM, Nefzger H, Kwiecien NW, May JC, McLean JA, Hercules DM. Anal Chem. 2014;86:4362–4370. doi: 10.1021/ac5001652. [DOI] [PMC free article] [PubMed] [Google Scholar]
- 20.Lalli PM, Corilo YE, Fasciotti M, Riccio MF, de Sa GF, Daroda RJ, Souza GH, McCullagh M, Bartberger MD, Eberlin MN, Campuzano ID. J Mass Spectrom. 2013;48:989–997. doi: 10.1002/jms.3245. [DOI] [PubMed] [Google Scholar]
- 21.May JC, McLean JA. Anal Chem. 2015;87:1422–1436. doi: 10.1021/ac504720m. [DOI] [PMC free article] [PubMed] [Google Scholar]
- 22.May JC, McLean JA. Annu Rev Anal Chem. 2016;9:387–409. doi: 10.1146/annurev-anchem-071015-041734. [DOI] [PMC free article] [PubMed] [Google Scholar]
- 23.Shah AR, Agarwal K, Baker ES, Singhal M, Mayampurath AM, Ibrahim YM, Kangas LJ, Monroe ME, Zhao R, Belov ME, Anderson GA, Smith RD. Bioinformatics. 2010;26:1601–1607. doi: 10.1093/bioinformatics/btq245. [DOI] [PMC free article] [PubMed] [Google Scholar]
- 24.Oliferenko AA, Tian F, Karelson M, Katritzky AR. Int J Mass Spectrom. 2012;314:1–5. [Google Scholar]
- 25.Gonzales GB, Smagghe G, Coelus S, Adriaenssens D, De Winter K, Desmet T, Raes K, Van Camp J. Anal Chim Acta. 2016;924:68–76. doi: 10.1016/j.aca.2016.04.020. [DOI] [PubMed] [Google Scholar]
- 26.Junge M, Huegel H, Marriott PJ. Chirality. 2007;19:228–234. doi: 10.1002/chir.20371. [DOI] [PubMed] [Google Scholar]
- 27.Lim G, Nam H, Park C, Mun S. J Liq Chromatogr Relat Technol. 2013;36:180–196. [Google Scholar]
- 28.Moreno-González D, Toraño JS, Gámiz-Gracia L, García-Campaña AM, de Jong GJ, Somsen GW. Electrophoresis. 2013;34:2615–2622. doi: 10.1002/elps.201300247. [DOI] [PubMed] [Google Scholar]
- 29.Barnett DA, Ells B, Guevremont R, Purves RW. J Am Soc Mass Spectrom. 1999;10:1279–1284. [Google Scholar]
- 30.McCooeye M, Mester Z. Rapid Commun Mass Spectrom. 2006;20:1801–1808. doi: 10.1002/rcm.2515. [DOI] [PubMed] [Google Scholar]
- 31.Shvartsburg AA, Creese AJ, Smith RD, Cooper HJ. Anal Chem. 2010;82:8327–8334. doi: 10.1021/ac101878a. [DOI] [PMC free article] [PubMed] [Google Scholar]
- 32.Knapman TW, Berryman JT, Campuzano I, Harris SA, Ashcroft AE. Int J Mass Spectrom. 2010;298:17–23. [Google Scholar]
- 33.Asbury GR, Hill HH. J Microcolumn Separations. 2000;12:172–178. [Google Scholar]
- 34.May JC, Goodwin CR, Lareau NM, Leaptrot KL, Morris CB, Kurulugama RT, Mordehai A, Klein C, Barry W, Darland E, Overney G, Imatani K, Stafford GC, Fjeldsted JC, McLean JA. Anal Chem. 2014;86:2107–2116. doi: 10.1021/ac4038448. [DOI] [PMC free article] [PubMed] [Google Scholar]
- 35.May JC, McLean JA. PROTEOMICS. 2015;15:2862–2871. doi: 10.1002/pmic.201400551. [DOI] [PubMed] [Google Scholar]
- 36.Kanu AB, Gribb MM, Hill HH. Anal Chem. 2008;80:6610–6619. doi: 10.1021/ac8008143. [DOI] [PMC free article] [PubMed] [Google Scholar]
- 37.May JC, Dodds JN, Kurulugama RT, Stafford GC, Fjeldsted JC, McLean JA. Analyst. 2015;140:6824–6833. doi: 10.1039/c5an00923e. [DOI] [PMC free article] [PubMed] [Google Scholar]
- 38.Mason EA, Schamp HW. Ann Phys. 1958;4:233–270. [Google Scholar]
- 39.Mason EA, McDaniel EW. Transport Properties of Ions in Gases. John Wiley & Sons; New York: 1988. p. 560. [Google Scholar]
- 40.Moseley JT, Gatland IR, Martin DW, McDaniel EW. Phys Rev. 1969;178:234–239. [Google Scholar]
- 41.Rokushika S, Hatano H, Baim MA, Hill HH., Jr Anal Chem. 1985;57:1902–1907. [Google Scholar]
- 42.Watts P, Wilders A. Int J Mass Spectrom Ion Processes. 1992;112:179–190. [Google Scholar]
- 43.Siems WF, Wu C, Tarver EE, Hill HH, Larsen PR, McMinn DG. Anal Chem. 1994;66:4195–4201. [Google Scholar]
- 44.Marshall AG, Hendrickson CL, Shi SD. Anal Chem. 2002;74:252–259. doi: 10.1021/ac022010j. [DOI] [PubMed] [Google Scholar]
- 45.Groessl M, Graf S, Lisa M, Holcapek M, Sampaio J, Dick B, Vogt B, Knochenmuss R. 63rd Annual Conference on Mass Spectrometry and Allied Topics; 2015. [Google Scholar]
- 46.Asbury GR, Hill HH., Jr J Micro Sep. 2000;12:172–178. [Google Scholar]
- 47.Tabrizchi M, Rouholahnejad F. Talanta. 2006;69:87–90. doi: 10.1016/j.talanta.2005.09.016. [DOI] [PubMed] [Google Scholar]
- 48.Silveira JA, Ridgeway ME, Park MA. Anal Chem. 2014;86:5624–5627. doi: 10.1021/ac501261h. [DOI] [PubMed] [Google Scholar]
- 49.Deng L, Ibrahim YM, Baker ES, Aly NA, Hamid AM, Zhang X, Zheng X, Garimella SVB, Webb IK, Prost SA, Sandoval JA, Norheim RV, Anderson GA, Tolmachev AV, Smith RD. Chemistry Select. 2016;1:2396–2399. doi: 10.1002/slct.201600460. [DOI] [PMC free article] [PubMed] [Google Scholar]
- 50.Groessl M, Graf S, Knochenmuss R. Analyst. 2015;140:6904–6911. doi: 10.1039/c5an00838g. [DOI] [PubMed] [Google Scholar]
- 51.Dwivedi P, Wu C, Matz LM, Clowers BH, Siems WF, Hill HH. Anal Chem. 2006;78:8200–8206. doi: 10.1021/ac0608772. [DOI] [PMC free article] [PubMed] [Google Scholar]
Associated Data
This section collects any data citations, data availability statements, or supplementary materials included in this article.