

SUMMARY
Enhancer elements are regulatory sequences within genomes that direct the selective expression of genes so that genetically identical cells can differentiate and acquire the highly specialized forms and functions required to build a functioning animal. To differentiate, cells must select from among the ~106 enhancers encoded in the genome the thousands of enhancers that drive the gene programs that impart their distinct features. We used a genetic approach to identify transcription factors (TFs) required for enhancer selection in fibroblasts. This revealed that the broadly expressed, growth factor-inducible TFs Fos/Jun (AP-1) play a central role in enhancer selection. Fos/Jun selects enhancers together with cell type-specific TFs by collaboratively binding to nucleosomal enhancers and directing recruitment of the SWI/SNF (BAF) chromatin remodeling complex to establish accessible chromatin. These experiments demonstrate how environmental signals acting via Fos/Jun and BAF coordinate with cell type-specific TFs to select enhancer repertoires that enable differentiation during development.
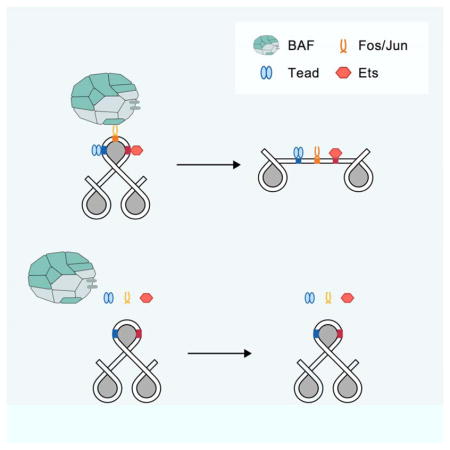
Graphical abstract
INTRODUCTION
Embryonic development requires the carefully orchestrated differentiation of thousands of cell types from the same set of genetic instructions. Each cell type expresses a distinctive subset of the ~20,000 genes in the genome that together determine the form, function, and behavior of the cell. The regulatory instructions that govern cell type-specific gene expression programs are encoded within the genome by enhancers, which are short (100–500 bp), cis-acting transcriptional regulatory elements that bind sequence-specific TFs (Long et al., 2016). A typical mammalian genome contains ~106 enhancers, each of which only regulates transcription of its associated gene(s) in a small subset of the thousands of cell types found within developing and mature organisms (Roadmap Epigenomics et al., 2015). Correspondingly, in any given cell type only a small fraction of the enhancers within the genome (~1–2%) actively contribute to gene regulation. Thus, at each successive cell fate decision during embryonic development, cells select distinct sets of enhancers to execute the appropriate cell type-specific gene program. This selective reading of the genetic regulatory information is a fundamental feature of metazoan development.
Enhancers are platforms for sequence-specific TF binding that help to target the transcriptional machinery to specific promoters to potentiate gene transcription (Long et al., 2016). The ability to regulate transcription in a cell type-specific manner is encoded by the type, number, and organization of TF binding motifs within an enhancer (Heinz et al., 2015). Enhancers require binding of distinct types of TFs to function, and thus can only regulate transcription when these TFs are expressed. Accordingly, changes in TF activity and/or expression initiate changes in enhancer selection to establish cell type-specific gene expression programs during differentiation. However, the mechanisms by which enhancers are selected during the course of cell differentiation in the embryo remains largely unknown (Zaret and Carroll, 2011).
TF binding to enhancers occurs in the context of chromatin, which also plays a critical role in the selective regulation of gene expression by preventing the binding of TFs to most regulatory elements across the genome, as many TFs cannot bind strongly to their cognate motifs when the DNA is wrapped around a histone octamer (Zaret and Carroll, 2011). Surprisingly, enhancer sequences generally have a high affinity for histone octamers and are thus more likely to form a nucleosome than their flanking DNA sequence (Tillo et al., 2010). Therefore, enhancer function requires the eviction or remodeling of histone octamers to establish a region of ~300–400 bp of nucleosome-free sequence that is permissive for TF binding and can thus nucleate the necessary transcriptional regulatory machinery. Overcoming this nucleosome barrier is a rate-limiting step to enhancer activation and has been proposed as a general mechanism that restricts enhancer activity to specific cell types (Long et al., 2016). Understanding how TFs selectively activate enhancers in a cell type-specific manner thus requires characterizing how TFs select nucleosomal enhancer sequences and then evict or remodel the histone octamers bound to these sequences.
Current models suggest that a small subset of lineage-determining TFs (LDTFs; also known as pioneer factors) select enhancers by binding collaboratively to specific nucleosomal enhancers, evicting and/or remodeling nucleosomes, and establishing cell type-specific landscapes of nucleosome-free enhancers (Heinz et al., 2015). This landscape of accessible enhancers defines which genes are competent to be activated by demarcating the enhancers at which additional TFs can bind, including the TFs that are terminal effectors of signal transduction pathways (Buecker and Wysocka, 2012; Mullen et al., 2011; Trompouki et al., 2011). However, the specific mechanisms by which LDTFs and their co-factors select and establish accessible enhancer landscapes remain largely uncharacterized. In addition, although cellular differentiation during development clearly requires coordination between extracellular signals and LDTFs, how extracellular stimuli and their transcriptional effectors contribute to enhancer selection is not clear [Ostuni et al., 2013; Swinstead et al., 2016a; Vahedi et al., 2012).
To investigate how TFs select cell type-specific enhancers, we used a genetic approach in fibroblasts to enable a comprehensive, genome-wide assessment of the requirement of specific TF binding motifs for enhancer selection. Unexpectedly, our data reveal a central role for the signal-dependent TFs Fos/Jun (AP-1) in fibroblast enhancer selection. AP-1 TFs are transcriptional effectors of growth factor/receptor tyrosine kinase signaling and are activated by the Ras/MAPK pathway in nearly all cell types, raising the question of how they could contribute to cell type-specific enhancer selection. Our data suggest a model in which AP-1 TFs, together with lineage-specific TFs, bind to nucleosome-occluded enhancers and recruit the BAF complex to induce nucleosome remodeling and establish an accessible chromatin state. We provide evidence that signal-dependent TFs can play an integral role in selecting cell type-specific enhancer landscapes, with important implications for understanding transcriptional regulation by growth factors/RTKs and the Ras/MAPK pathway, both in the context of lineage-specification decisions as well as in disorders such as intellectual disability and cancer.
RESULTS
Characterization of functionally distinct classes of fibroblast enhancers
To investigate mechanisms of enhancer selection by TFs we used primary mouse embryonic fibroblasts (MEFs) because these cells are relatively homogeneous in culture and proliferate rapidly, facilitating genomic and biochemical studies that require large cell numbers. Fibroblasts are mesenchymal cells that are generally quiescent in the absence of tissue damage, whereupon platelet-derived growth factor signaling induces their proliferative expansion to facilitate wound healing (Gurtner et al., 2008). To identify TFs that regulate fibroblast enhancer selection, we first sought to comprehensively identify enhancers in MEFs. Previous studies suggest that a cell’s repertoire of selected enhancers can be broadly divided into those that are active and those that are not active but have the potential to be activated, known as primed enhancers (Long et al., 2016). These two enhancer classes can be comprehensively identified in a specific cell type by their chromatin signature, with both classes exhibiting monomethylation of histone H3K4 (H3K4me1) on nucleosomes flanking the enhancer sequence and hypersensitivity to transposase insertion (assay for transposase-accessible chromatin; ATAC-seq) or digestion by nucleases (Buenrostro et al., 2013). Active enhancers are also marked by acetylation of lysine 27 on histone H3 (H3K27ac) on adjacent nucleosomes (Rada-Iglesias et al., 2011).
Based on previous studies of gene expression in MEFs and other cell types, it is clear that growth factor signaling regulates specific subsets of genes expressed in fibroblasts (Iyer et al., 1999). Growth factors in serum activate their cognate receptor tyrosine kinases, inducing the Ras/MAPK intracellular kinase cascade which then activates TFs at a first set of enhancers to initiate transcription of canonical early-response genes (ERGs). Many ERGs are TFs, such as AP-1 (Fos, Fosb, Fosl1/2, Jun, JunB), which in turn coordinate a late-response gene (LRG) program that mediates the cellular response to tissue damage (Galbraith and Espinosa, 2011). Importantly, Ras/MAPK signaling activates a similar set of ERGs in most cell types in the body, whereas LRGs tend to be highly cell type-specific. This suggests that ERG enhancer selection is not controlled by cell type-specific TFs and that LRG enhancer selection requires cell-type specific TFs. Therefore, we sought to distinguish between these two subsets of growth factor-responsive enhancers and to identify the constitutively active enhancers that govern fibroblast gene programs (cell identity enhancers).
We and others have shown that enhancers that control stimulus-responsive gene programs can be distinguished from other active enhancers by their specific increase in H3K27ac upon receipt of the stimulus (Malik et al., 2014; Ostuni et al., 2013; Zhang et al., 2013). Therefore, we performed ChIP-seq experiments to identify these enhancer-associated histone modifications across the fibroblast genome, and ATAC-seq to identify the accessible cis-regulatory elements, and used these data to define subsets of fibroblast enhancers.
We first synchronized MEFs in G0 phase by serum deprivation for 24 hours, and then either left the cells unstimulated, or exposed them to serum for 10 or 90 minutes (m) and performed H3K27ac ChIP-seq (correlations between replicates listed in Table S1). These data revealed three sets of active fibroblast enhancers a) enhancers adjacent to known ERGs (e.g. Fos, Egr1, Nr4a1) that displayed maximal H3K27ac levels at 10m (n=352; subsequently referred to as ERG enhancers), b) enhancers near LRGs that exhibited maximal H3K27ac levels at 90m (n=2144; LRG enhancers), and c) cell identity enhancers were marked by H3K27ac in growth arrested MEFs and maintained similar levels of H3K27ac upon stimulation (n=8,568; Figure S1a). To rigorously distinguish between ERGs and LRGs we also profiled enhancer activation in the presence of the protein synthesis inhibitor cycloheximide (Greenberg et al., 1986). This treatment does not affect ERG activation, but blocks the translation of ERG TFs, and is known to prevent the activation of LRGs. In total, we found that 1,398/2,144 LRG enhancers were dependent on de novo protein synthesis (Figure S1b). Altogether, these data served as a starting point for understanding how TFs select fibroblast-specific enhancers.
AP-1 TFs regulate cell identity and LRG enhancers
To identify TFs that could regulate cell type-specific enhancer selection we performed TF binding motif searches of cell identity and LRG enhancer sequences. This revealed that AP-1 binding motifs are the most significantly enriched sequences at LRG enhancers, with 82% of LRG enhancers containing an AP-1 motif. This might have been predicted as AP-1 TFs are well characterized ERG TFs that are known to bind to enhancers to regulate LRGs. However, somewhat surprisingly, the AP-1 motif is also the most significantly enriched motif within cell identity enhancers (67% containing an AP-1 motif; Figure 1b,c).
Figure 1. Identification of distinct classes of active enhancers in fibroblasts.

a) H3K27ac ChIP-seq signal (0, 10, 90m of serum stimulation) at distinct classes of enhancers. b,c) Position weight matrices of motifs enriched in cell identity and LRG enhancers. Percentages indicate the fraction of enhancers in each group that contain the motif compared to a GC-matched background set of genomic regions. d,e) Motif frequencies for cell identity and LRG enhancers for motifs identified in (b,c). ORs were calculated for motif occurrences within +/−250bp of the ATAC-seq peak center. P values (chi-square test): Cell identity (<5.3×l0−16), LRG (<5.2×l0−4)
The AP-1 motif is well characterized as the binding site for members of the Fos/Jun family of ERG TFs. Fos family members (Fos, Fosb, Fosl1, and Fosl2) bind DNA as obligate heterodimers with members of the Jun family, whereas Jun family members (Jun, Junb, and Jund) can bind to the AP-1 site as homo- or heterodimers with Fos family members (Eferl and Wagner, 2003).
Given that AP-1 TF expression is not cell type-specific, we asked if the putative fibroblast cell identity and LRG enhancers are also enriched for motifs that bind cell type-specific LDTFs. Notably, this revealed significant enrichment for the binding motifs for Tead, Runx, Ets, NFI, EGR and Creb/ATF family TFs, which could potentially select cell type-specific AP-1 bound enhancers (Figure 1b–e). However, targeted motif searches revealed that AP-1 motifs were detected in a much higher fraction of both enhancer subsets than these other enriched motifs (Figure 1b–d).
AP-1 transcription factor binding is required for enhancer selection in fibroblasts
To identify TF binding motifs required for enhancer selection, we next employed an unbiased genetic approach using naturally occurring sequence polymorphisms between the genomes of C57B1/6J and SPRET/EiJ (Mus spretus) mice (Heinz et al., 2013). The SPRET/EiJ and C57B1/6J genomes have ~3.7 × 10⁷ single nucleotide polymorphisms (SNPs), amounting to 1 SNP every ~80 bp (Keane et al., 2011). These SNPs are likely to include many instances in which the SNP modifies a binding site for a TF within an enhancer such that the TF can no longer bind to that site in one of the strains. By identifying enhancers in MEFs from each strain, it is then possible to identify all instances in which a SNP has disrupted a critical TF binding site within an enhancer, leading to a loss of enhancer selection in one of the two strains. The presence of a SNP within a known TF binding site that disrupts both TF binding and enhancer selection provides functional evidence that this specific TF binding site is required for the selection of that enhancer (Heinz et al., 2013).
We mapped cell identity and LRG enhancers from Spret/EiJ MEFs (ATAC-seq, H3K4me1/2 ChIP-seq, ATAC-seq) to identify strain-specific cell identity and LRG enhancers (Figure 2a,b). We focused on cases in which there is no longer an ATAC-seq peak in the strain in which the enhancer sequence is no longer functional (see methods), reasoning that such examples would be most useful for determining which TF binding motifs are required for enhancer selection. In total, we identified 42 LRG enhancers and 363 cell identity enhancers that were selected in a strain-specific manner (Figure 2b).
Figure 2. Identification of TF motifs required for cell identity and LRG enhancer selection.

a) ATAC-seq and H3K4me1 ChIP-seq signal from MEFs from C57BI/6J and SPRET/EiJ mice are displayed for cell identity (top row) and LRG (bottom row) enhancers. Highlighted points indicate FDR<10−6. b) ATAC-seq, H3K4me1 ChIP-seq, and H3K27ac ChIP-seq signal from strain-specific enhancers identified in (a), c) Frequency of SNPs that overlap each of the indicated TF motifs. Among the motifs observed to be enriched in Figure 1 at cell identity and LRG enhancers, only SNPs in these motifs exhibited a significantly higher frequency in strain-specific enhancers compared to shared enhancers (by chi-square test), d) Percentages of strain-specific or shared enhancers that do not have SNPs overlapping any enriched TF motif (“No SNP in any motif”), have SNPs overlapping only the AP-1 motif (“AP-1 SNP only”), or have SNPs overlapping both AP-1 and other TF motif(s) within the same enhancer.
We next identified SNPs within TF binding motifs that were correlated with strain-specific enhancer selection. For this analysis, we focused on SNPs that occur within one of the ten TF binding motifs that we found to be enriched in AP-1-bound enhancers genome-wide (Figure 1d,e). A strain-specific enhancer is only informative if it contains an instance of one of these enriched motifs and that overlaps a SNP (126/405 strain-specific cell identity and LRG enhancers). Strikingly, we observed more instances of SNPs in AP-1 motifs (n=65/126) than in all the other enriched motifs combined. The frequency of SNPs in AP-1 motifs was significantly higher than expected by chance based on the observed frequency of AP-1 SNPs at conserved enhancers (Figure 2c). Among the other enriched motifs (Figure 1d,e), only SNPs within Tead, Ets, and NFI motifs occurred more frequently than expected by chance (Figure 2c). Importantly, at 41/65 strain-specific enhancers with a SNP in an AP-1 motif, the AP-1 motif was the only one of the ten enriched TF motifs that contained a SNP, consistent with the AP-1 SNP being causal for the loss of enhancer selection at these sites (Figure 2d). Together, these data suggest that AP-1 TFs play an important role in enhancer selection, but also implicate additional factors (e.g. Tead, Ets, and NFI) that contribute to enhancer selection, either in collaboration with AP-1 or in an AP-1-independent manner.
Next, we performed a more comprehensive analysis to assess the requirement for AP-1 motifs for enhancer selection genome-wide, including all selected cell identity and LRG enhancers. The well-defined nature of AP-1 binding motifs (TGA(C/G)TCA) allowed for prospective identification of sites where SNPs would be predicted to disrupt AP-1 binding in one of the two strains (Risse et al., 1989). To assess the consequences of AP-1 site mutations on enhancer selection, we analyzed all selected enhancers that are bound by the AP-1 TF Fos and contain a single consensus AP-1 motif (+/−125 bp from the Fos peak summit) that overlaps a SNP (n=l,380; Figure 3a). This was important because ~10% of enhancers contain more than one canonical AP-1 motif that could compensate for the loss of a single AP-1 motif. We then focused on enhancers at which we could confirm that Fos binding is indeed lost when the AP-1 binding site is mutated, which helped to remove enhancers that contained variant AP-1 motifs that could be compensating for the loss of consensus AP-1 binding sites (Figure 3a,b; see methods). The resulting 362 enhancers can thus be used to assess the importance of AP-1 TF binding for enhancer selection.
Figure 3. AP-1 TFs are often required for enhancer selection.

a) Fos ChIP-seq signal at all selected enhancers in C57Bl/6J and SPRET/EiJ MEFs that contain a single consensus AP-1 motif and are bound by Fos. SNPs overlapping AP-1 motifs are indicated by their predicted effect on AP-1 binding, b) Fos ChIP-seq signal from each strain for the enhancers identified in (a) at which AP-1 binding would be predicted to be affected by a SNP. Enhancers are classified by whether they contain an active or inactive AP-1 motif, rather than by which strain they come from. Highlighted points indicate enhancers at which Fos binding was significantly strain-specific [FDR<10−6). c–e) Enhancer associated chromatin features for the subset of the enhancers with significant strain-specific Fos binding in (b) that no longer have a Fos peak detected in the strain in which the AP-1 motif is mutated (n=362/434). Highlighted points indicate enhancers at which the chromatin feature was significantly strain-specific (FDR<10−6). f) Fos ChIP-seq signal from each strain. Colored points collectively indicate the 362 enhancers plotted in (c–e). 119 strain-specific enhancers are highlighted (orange triangles) at which the AP-1 SNP leads to both a significant loss of ATAC-seq and H3K4me1 ChIP-seq signal and there is no longer an ATAC-seq peak in the strain in which the AP-1 motif is inactive. g) Histogram showing the location of SNPs in the seven core nucleotides of the AP-1 motif from the 119 strain-specific selected enhancers. h) Representative genome browser tracks for two strain-specific LRG enhancers. AP-1 motifs from each strain are displayed below the enhancer with the SNP highlighted in red. i–j) Total SNP and indel frequency (i) and SNP frequency within Tead/Ets/NFI motifs (j) comparing the 119 strain-specific enhancers (blue) to all other enhancers with a single AP-1 motif that overlaps a SNP (i) (gray) or the subset of these enhancers that contain Tead/Ets/NFI motifs (j).
We employed a stringent definition of loss of enhancer selection that requires a significant decrease in both ATAC-seq and H3K4me1 signal such that there is no longer a detectable ATAC-seq peak (Figure 3b–h). Strikingly, we found that AP-1 binding is required for the selection of 119/362 enhancers, however, a larger fraction exhibited a significant decrease in chromatin accessibility (52%), H3K4me1 (58%), and H3K27ac (64%). Importantly, among these 119 high-confidence, strain-specific enhancers we observed SNPs in each of the seven nucleotides of the consensus AP-1 motif (Figure 3g). Furthermore, the small subset of SNPs within AP-1 motifs that would not be predicted to change AP-1 binding affinity (n=58) rarely lead to loss of enhancer selection (~4%; Figure S2a). Together, these two observations strongly suggest that the loss of enhancer selection at the vast majority of these sites is caused specifically by loss of AP-1 TF binding.
Given the frequency of genetic variants between C57B1/6J and SPRET/EiJ mice, most enhancers contain multiple SNPs and small insertions/deletions in addition to SNPs in the AP-1 motif (average: 4.1 additional SNPs/indels within +/−125 bp of the AP-1 motif) that could also contribute to the observed loss of enhancer selection. Therefore, we assessed the contributions of these non-AP-1 SNPs to enhancer selection at these 119 sites. Importantly, these enhancers did not have a higher frequency of all SNPs/indels compared to enhancers at which the AP-1 SNP did not cause a loss of enhancer selection (Figure 3i). Similarly, SNPs within other motifs for putative fibroblast LDTFs (Tead, Ets, NFI) were not observed at a higher frequency than expected, and only 6/119 had SNPs in these other motifs together with a SNP in AP-1 (Figure 3j). These analyses further support a mechanism in which direct disruption of AP-1 TF binding to AP-1 motifs by SNPs is the causal genetic change leading to a loss of enhancer selection at these sites. Given that AP-1 TFs bind to ~70% of cell identity enhancers and nearly all LRG enhancers, our results suggest that AP-1 TFs broadly contribute to the selection of enhancers across the fibroblast genome.
The changes in enhancer selection that we observe between C57B1/6J and SPRET/EiJ MEFs could in theory be caused by trans-acting differences that affect enhancer selection genome-wide, such as differences in levels of TF expression or in serum-activated signal transduction. To directly assess whether these changes in enhancer selection were due to local changes in AP-1 binding (i.e. cis-acting), we generated MEF cultures from Fl hybrid embryos derived from crosses between a SPRET/EiJ male and a C57B1/6J female and performed allele-specific ChIP-seq for H3K4me2. By sequencing libraries generated from immunoprecipitated DNA with long (2 × 150 bp), paired-end reads, we could distinguish between each enhancer allele (see methods). In total, 89/119 (75%) of strain-specific enhancers also exhibit significant allele-specific differences in H3K4me2 enrichment in F1 hybrid MEFs, confirming that the observed differences in enhancer selection between these enhancers in the parental strains are due to local, cis-acting differences in enhancer sequence (Figure S2b,c).
Thus, by comparing enhancer selection in genetically distinct mouse strains with a high frequency of SNPs across their genomes, we were able to identify 165 unique enhancers (65 from Figure 2 and 119 from Figure 3, some of which were among those identified in Figure 2) at which the loss of an AP-1 binding site leads to a loss of enhancer selection. These findings indicate that AP-1 TFs which are generally considered to be transcriptional effectors of growth factor/RTK signaling pathways, play a widespread and unexpected role in fibroblast enhancer selection.
Identification of AP-1 TFs that bind to cell identity and LRG enhancers
We next sought to identify the TFs that bind to AP-1 motifs at cell identity and LRG enhancers as the genome-wide binding of the diverse AP-1 TF family members has not been examined in detail. AP-1 TFs are expressed in most cell types and exhibit stereotyped expression patterns in response to extracellular stimuli. Notably, Fos/Fosb/Junb mRNAs are not usually expressed prior to stimulation but are rapidly induced to very high expression levels upon stimulation. Fosl1/Fosl2/Jun are expressed before stimulation at low levels and are also dramatically induced upon stimulation, whereas Jund is expressed constitutively at moderate levels and is not regulated by stimulation (Kovary and Bravo, 1992). Thus, a variety of AP-1 family homo- or heterodimers can potentially bind to AP-1 sites in fibroblast enhancers. For example, one possibility is that growth factor signaling during fibroblast differentiation activates transcription of the inducible AP-1 TFs, which then select cell identity and LRG enhancers across the genome. Alternatively, homodimers of the constitutively-expressed AP-1 TF JunD could be critical for enhancer selection during fibroblast differentiation, whereas transient bursts of transcription of the stimulus-inducible AP-1 TFs might be preferentially required only for the activation of LRGs in differentiated fibroblasts.
We mapped the binding of AP-1 TFs (Fos, Fosl2, Jun, Jund) in quiescent MEFs (in which expression of AP-1 TFs is very low and the constitutively expressed AP-1 TF JunD predominates) and MEFs stimulated for 90m (when the levels of the growth factor-induced AP-1 TFs Fos, FosB, Fosl1/2, Jun and JunB are maximal), identifying a total of 55,919 sites of AP-1 TF binding, including binding at ~96% of LRG enhancers and ~70% of cell identity enhancers (Figure 4a,b). Consistent with previous findings, AP-1 TFs bind almost exclusively to promoter-distal regions (94% of peaks >1 kb from an annotated TSS)(Biddie et al., 2011; Malik et al., 2014). However, we observed that ~47% of the AP-1-bound LRG enhancers did not have significant AP-1 TF binding prior to serum stimulation, whereas the vast majority (90%) of AP-1-bound cell identity enhancers were bound by Jun/JunD/Fosl2 prior to serum stimulation (Figure 4a–d). Accordingly, we found that LRG enhancers had limited or undetectable chromatin accessibility prior to stimulation (44% of LRG enhancers did not have an ATAC-seq peak prior to stimulation; Figure 4a,c,d). Given their distinct chromatin state, we focused our subsequent analyses on this subset of 619 LRG enhancers. Although we observed low or undetectable levels of chromatin accessibility and AP-1 binding at LRG enhancers prior to stimulation, these enhancers were enriched for the primed enhancer histone modification H3K4me1/2. However, unlike at cell identity enhancers, the H3K4me1/2-modified nucleosomes) occlude the AP-1 binding sites at LRG enhancers prior to stimulation (Figure 4b,d). Upon stimulation with serum, the LRG enhancers exhibit remodeling of the H3K4me1/2 modified nucleosomes, enhanced chromatin accessibility, and robust binding of AP-1 TFs (Figure 4b,d). The inducible binding of AP-1 TFs to nucleosomal LRG enhancer sequences thus recapitulates mechanistic features of enhancer selection during cellular differentiation (Iwafuchi-Doi and Zaret, 2016). These observations, together with the fact that the AP-1 site is required for fibroblast enhancer selection, suggests that AP-1 TFs, likely Fos/Jun family heterodimers, are required for enhancer selection during fibroblast differentiation.
Figure 4. AP-1 TFs bind inducibly to LRG enhancers.

a) Representative genome browser tracks of the enhancers downstream from the Vegfa gene showing binding of AP-1 TFs expressed in quiescent MEFs (Jund, Fosl2) as well as the inducible AP-1 TF Fos. Shaded boxes indicate LRG enhancers. Scale bars indicate normalized read densities for each ChIP-seq (0 and 90m are displayed on the same scale for each track). b) Percentages of LRG and cell identity enhancers, as well as the TSSs of LRGs, that are bound by AP-1 TFs in quiescent and stimulated MEFs. c–d) Fixed line plots (c) and aggregate plots (d) of enhancer associated histone modifications at LRG and cell identity enhancers before and after stimulation.
AP-1 TFs collaborate with cell type-specific TFs to select enhancers
The finding that broadly-expressed AP-1 TFs are frequently required for fibroblast enhancer selection is puzzling in the sense that enhancer selection is known to be highly cell type-specific. How might the broadly expressed, signal-responsive AP-1 TFs participate in cell type-specific enhancer selection? One model arising from previous work on LDTFs is that AP-1 TFs might only be able to bind to cell type-specific enhancers together with cell type-specific TFs, explaining how AP-1 TFs would be targeted to distinct enhancers in each cell type in which they are induced (Heinz et al., 2015). Such collaborative TF binding generally occurs within ~75 bp, suggesting that these TFs need to bind in close proximity on the surface of a single nucleosome to select specific enhancers from within unmodified chromatin during cellular differentiation (Moyle-Heyrman et al., 2011).
To investigate this possibility, we took advantage of inducible enhancer data from several other cell types in which AP-1 TFs regulate gene expression programs induced by extracellular stimuli. In macrophages, T cells, and hippocampal neurons, environmental stimuli have previously been shown to induce nucleosome remodeling at signal-responsive enhancers that bind AP-1 family members (Bevington et al., 2016; Ostuni et al., 2013; Su et al., 2017). As expected, a comparison between the location of AP-1-bound enhancers in each cell type confirmed that AP-1 regulates distinct enhancers in each cell type (Figure 5a). To identify cell type- or lineage-specific factors that bind together with AP-1 at LRG enhancers, we performed targeted motif searches of inducible enhancers from each cell type, focusing on a window +/−75 bp from the AP-1 site. Cell type-specific AP-1-bound enhancers are enriched for distinct TF motifs (Figure 5b–e). For example, inducible enhancers in macrophages are enriched for binding motifs for C/EBP and NF-κB; hippocampal enhancers activated by bursts of neuronal activity are enriched for two variants of the E-box motif, which are bound by the Neurogenin/NeuroD family TFs; and memory T cell enhancers activated by mimicking T cell receptor engagement are NFAT motifs. Thus, in each functionally distinct cell type in which extracellular stimuli induce AP-1 TF expression, distinct LDTFs likely bind together with AP-1 to nucleosomes to select cell type-specific LRG enhancers.
Figure 5. AP-1 binds together with lineage-specific TFs to select enhancers.

a) Overlap between LRG enhancers identified in MEFs and enhancers from macrophages (Ostuni et al., 2013), T cells (Bevington et al., 2016), and hippocampal tissue (Su et al., 2017) that undergo inducible nucleosome remodeling upon activation by relevant stimuli and that are enriched for AP-1 motifs and bound by AP-1 TFs (macrophages and T cells) or predicted to be bound by AP-1 TFs (hippocampal tissue). b) Results from targeted motif searches of inducible enhancers identified in each cell type (macrophages/T cells +/− 250bp from AP-1 TF peak center; hippocampus +/− 250bp from ATAC-seq peak center). Enhancers from each cell type are enriched for AP-1 motifs; however, for this analysis AP-1 motifs were masked to increase sensitivity for the identification of additional TFs. c–e) Frequencies of the indicated cell type-specific TF binding motifs at inducible enhancers from indicated cell types. Among the motifs identified to be enriched at inducible enhancers in each cell type, only these motifs exhibited a significantly higher frequency in their respective cell types (blue) compared to the other cell types examined (greys). P values (chi-square test): C/EBP (3.9×10⁻¹¹), NF-kB (2.1×10⁻³), bHLH (CATCTG) (2.4×10⁻⁷), bHLH (CATATG) (7.9×10⁻⁶), Hox related (Meox) (6.9×10⁻³), NFAT (<2.2×10⁻¹⁶). f) Fos ChIP-seq signal in C57Bl/6J and SPRET/EiJ at enhancers selected in either strain. Strain-specific motifs (FDR<1×10⁻⁶) are indicated by colored dots. g–h) Frequency of SNPs from strain-specific (blue) and shared (grey) Fos binding motifs in (f). ORs were calculated for SNP occurrences +/−75 bp from the AP-1 motif in the enhancer. P values (chi-square test): AP-1 (<2.2×10⁻¹⁶), TEAD (7.3×10⁻¹²), CREB (3.4×10⁻³), ETS [1.7×10⁻²).
If AP-1 TFs mediate enhancer selection by cooperating with other TF(s), we reasoned that SNPs within the binding sites for these other TFs should also disrupt AP-1 binding even though the AP-1 motif is unchanged (Heinz et al., 2013). To identify fibroblast LDTFs that might be required for targeting AP-1 to fibroblast-specific enhancers, we first performed ChIP-seq for the AP-1 TFs Fos/Jund in SPRET/EiJ MEFs to identify all strain-specific sites of AP-1 binding (n=1,224; Figure 5f). We next excluded all the strain-specific binding sites at which there was a SNP within an AP-1 motif that could directly explain the observed loss of AP-1 binding in one of the two strains (~47% of strain-specific AP-1 bound sites) (Figure 5g). For the remaining ~650 enhancers, we detected a significant enrichment for SNPs within Tead, Creb/ATF, and Ets motifs compared to enhancers at which AP-1 binding was observed in both strains (Figure 5h). In total, we identified SNPs within the binding motifs for these other TFs (Tead, Creb/ATF, and Ets) in ~6% of sites with strain-specific AP-1 binding (n=42/654) (Figure 5h). However, it is difficult to rule out a role for additional TFs that might have more degenerate binding motifs for targeting AP-1 TFs to cell type-specific enhancers, as these motifs might not be readily detectable by targeted motif search algorithms such as FIMO. These findings suggest a collaborative binding mechanism in which several other fibroblast LDTFs (e.g. Tead, Ets, Creb/ATF, NFI) bind together with AP-1 to select cell type-specific enhancers during differentiation.
AP-1 TFs interact directly with the BAF complex
Given that enhancer selection is thought to require nucleosome remodeling, AP-1-bound LRG enhancers undergo inducible nucleosome remodeling during their activation in response to extracellular stimuli, and that AP-1 binding is required for enhancer selection, we reasoned that understanding how AP-1 TFs contribute to nucleosome remodeling could elucidate the mechanisms governing enhancer selection. Since many TFs function by recruiting transcriptional co-regulatory complexes to cis-regulatory elements, we sought to identify transcriptional regulatory complexes that interact directly with AP-1 heterodimers and could mediate their function during enhancer selection. Glycerol gradient centrifugation of serum-stimulated MEF nuclear extracts revealed that a subset of AP-1 heterodimers were found associated with high molecular weight complexes (~1.5–2.0 mD; Figure S3a). To identify AP-1 interacting complexes, we isolated MEFs from a Fos-EGFP transgenic mouse line that expresses a Fos-EGFP fusion protein at roughly endogenous levels under the control of the Fos promoter (see methods). Following stimulation, Fos-associated proteins were immunoprecipitated with an anti-GFP nanobody and analyzed by mass spectrometry. Strikingly, in addition to the expected AP-1 heterodimer partners 10/15 components of the BAF ATP-dependent chromatin-remodeling complex co-immunoprecipitated with Fos-EGFP(Figure 6a; Table S2) (Kadoch and Crabtree, 2015). This is consistent with a previous study that identified Smarcd1 (Baf60a) as an AP-1 interacting protein in a yeast 2-hybrid screen (Ito et al., 2001)
Figure 6. AP-1 TFs interact with the BAF chromatin remodeling complex.

a) Summary of total peptides identified from Fos-EGFP or control immunoprecipitates analyzed by mass spectrometry. Additional information including Fold Change (FC) calculations are reported in Table S2. b) Western blots with indicated antibodies of anti-FLAG immunoprecipitates from stimulated (90m) wild-type (WT) or Fos-FlagHA knock-in MEFs. c–d) Western blots of input (left column) and proteins co-immunoprecipitated with FlagHA-tagged AP-1 family members (c) and indicated mutants of Fos (d) co-transfected with untagged Jun into HEK293T cells. Fos-basic mutant=specific amino acids mutated in the basic domain that binds DNA; Fos Δ–basic domain=basic domain complete deletion; FosL(1–5) mutant=all leucines in the leucine zipper mutated to valines (the leucine zipper is required for heterodimerization with Jun family proteins and thus for DNA binding); Fos Δ LZ =leucine zipper deletion. Transfected Fos family members exhibited variable expression levels, so, when possible, the amount of transfected plasmid was titrated to achieve similar expression levels (see methods). However, deletion of the entire basic domain in Fos (Fos Δ–basic domain) also destabilizes Jun protein, leading to reduced Jun levels and complicating our assessment of the effect of this deletion on AP-1’s ability to interact with BAF components.
To confirm the specificity of the interaction between AP-1 and BAF we generated a knock-in mouse in which a FlagHA tag is inserted into Fos locus (see methods). Immunoprecipitation of Fos-associated proteins using an anti-FLAG antibody demonstrated a robust and specific interaction between Fos-FlagHA and several core BAF subunits (Figure 6b). We also found that immunoprecipitation of Fos-FlagHA protein from HEK293T cells co-precipitated endogenously expressed BAF complex components (Figure 6c). Co-transfection of other FlagHA-tagged Fos family members could also co-precipitate BAF at similar levels to Fos-FlagHA, suggesting that AP-1 heterodimers containing any of the Fos family members can interact with BAF. However, JunD-FlagHA does not interact with SWI/SNF, suggesting that homodimers of the constitutively-expressed AP-1 TF JunD, which are likely to be the predominant AP-1 dimers present in quiescent cells, cannot engage BAF and thus might have distinct transcriptional regulatory functions (Figure 6c). Importantly, the interaction between AP-1 and BAF did not require AP-1’s DNA binding capacity, as mutations in the basic domain of Fos that mediates the interaction of Fos with the AP-1 site failed to disrupt the interaction with BAF. This suggests that these proteins could potentially interact in the nucleoplasm prior to binding to DNA. Furthermore, it indicates that the BAF-AP-1 interaction is not likely to result solely from the co-occupancy of these factors at enhancers. This would be consistent with a model in which AP-1 TFs facilitate targeting of BAF to specific enhancers across the genome (Figure 6d).
AP-1 TFs recruit the BAF complex to enhancers
While the ~1.5–2 MDa BAF complex has been previously shown to remodel nucleosomes on chromatin templates assembled in vitro and at promoters in vivo, the function of BAF at enhancers remains less clear (Alver et al., 2017; Shi et al., 2013; Wang et al., 2017). To determine whether BAF is involved in inducible nucleosome remodeling at LRG enhancers, we performed ChIP-seq for Smarca4, a core component of BAF to determine if the complex is recruited to AP-1-bound LRG enhancers upon stimulation. This revealed that BAF levels are low at most LRG enhancers prior to stimulation but increase significantly upon stimulation (Figure 7a,b). Across the genome, 77% of serum-inducible Smarca4 binding sites overlap AP-1 TF binding sites, and at these sites the Smarca4 ChIP-seq signal is centered around the AP-1 motif, consistent with a role for AP-1 TFs in BAF recruitment to these enhancers (Figure 7c). We observed higher levels of serum-inducible Smarca4 binding at AP-1 bound sites genome-wide compared to sites with similar levels of H3K27ac that are not bound by AP-1 (Figure 7d). In addition, enhancer activation does not appear to be essential for BAF recruitment, as many sites of AP-1 binding not at active enhancers (i.e. without H3K27ac) also exhibited higher levels of BAF recruitment upon stimulation (see for example deciles 5–10 in Figure 7d; Figure 7f). This suggests that the increased levels of inducible Smarca4 binding at AP-1 sites does not result as a side effect of a shared affinity of AP-1 and/or BAF for active enhancer elements, but rather reflects AP-1’s ability to recruit BAF to AP-1 binding sites.
Figure 7. AP-1 TFs are required for BAF recruitment to enhancers.

a) Representative LRG enhancers at the locus of the LRG Spred2. Scale bars indicate normalized read densities for each ChIP-seq and shaded boxes denote LRG enhancers. b) Smarca4 ChIP-seq signal at all Smarca4 peaks before and after stimulation with serum for 90m. Dashed gray lines indicate a 2-fold change. Smarca4 peaks with a significant increase in Smarca4 signal at 90m (n=3,062) compared to 0m are indicated in dark green (FDR<1×10⁻⁴). Smarca4 peaks that do not increase significantly at 90m (n=33,069) are indicated in light green. c) Smarca4 and H3K27ac ChIP-seq signal at all inducible Smarca4 peaks bound by AP-1. Smarca4 peaks have been recentered on the closest consensus AP-1 motif within +/−125bp of the Smarca4 peak center. d) Inducible binding of Smarca4 (90m/0m) at ATAC-seq peaks across the genome. ATAC-seq peaks are split into AP-1 bound and not AP-1 bound and binned into deciles according to their levels of H3K27ac ChIP-seq signal [decile 1 =highest H3K27ac signal at 90m; decile 10=lowest H3K27ac signal at 90m). e) Smarca4 ChIP-seq signal from C57Bl/6J MEFs at a set of enhancers that exhibit SPRET/EiJ-specific binding of AP-1 compared to enhancers at which AP-1 binds in both strains. In the left panel, SPRET/EiJ-specific enhancers function as H3K27ac-marked active enhancers in SPRET/EiJ but have an AP-1 point mutation in C57Bl/6J that disrupts binding of Fos (n=108). A similar comparison is shown in the right panel, but instead of focusing on active enhancers in SPRET/EiJ that have lost Fos binding in C57Bl/6J, it displays the Smarca4 ChIP-seq signal at all Fos peaks that are SPRET/EiJ–specific but not at active enhancers (n=123). f) Smarca4 ChIP-seq signal from MEFs in untreated cells (top row) or cells pretreated with the protein synthesis inhibitor anisomycin prior to serum stimulation (bottom row) at different classes of cis-regulatory elements (first three panels) and at Smarca4 peaks at which Smarca4 binding and AP-1 binding are both inducible but that are not at active enhancers marked by H3K27ac.
We next assessed whether AP-1 TFs are in fact necessary for BAF recruitment to AP-1 bound enhancers. First, we examined the requirement of AP-1 for BAF recruitment to AP-1 motifs that are bound by AP-1 in SPRET/EiJ but have lost AP-1 binding in C57BL/6J due to a SNP in an AP-1 motif. Strikingly, we found that the loss of AP-1 binding in C57Bl/6J MEFs led to a complete loss of BAF binding at these sites in C57Bl/6J (n=231; Figure 7e). To more directly test the requirement of AP-1 family members for BAF binding to AP-1 sites we simultaneously disrupted the function of three family members (Fos, FosB, and JunB) using MEFs from a conditional mouse line. Under these conditions we detected a significant and specific decrease in nucleosome remodeling by ATAC-seq at LRG enhancers compared to other enhancer classes (FDR=1.1×10⁻¹⁷; Figure S4a, top row) as well as a decrease in LRG enhancer activation (FDR=4.1×10⁻³¹; Figure S4a, bottom row). A likely explanation for the remaining ATAC-seq and H3K27ac ChIP-seq signal after Fos, FosB, and JunB removal is the continued presence of other AP-1 family members, all of which we have found can interact with and potentially recruit BAF to AP-1 site-containing enhancers. Prolonged disruption of additional AP-1 family members might lead to decreased cell viability and may limit the ability to stimulate MEFs to re-enter the cell cycle. Instead, we assessed serum-inducible BAF binding to AP-1 binding sites in cells in which we inhibited the inducible translation of ERG TFs by treating MEFs with the protein synthesis inhibitor anisomysin immediately prior to serum addition. While anisomycin treatment blocks the inducible translation of all ERG TFs, not solely AP-1, by focusing on serum-inducible, AP-1 bound enhancers we can more specifically assess the effect of the loss of inducible AP-1 TFs. Strikingly, anisomycin treatment led to a nearly complete loss of serum-dependent Smarca4 recruitment to sites of inducible AP-1 binding, including LRG enhancers as well as inducible sites of AP-1 binding that are not active enhancers (Figure 7f). These data suggest a direct role for newly synthesized AP-1 TFs in recruiting BAF to AP-1 site-containing enhancers across the genome upon stimulation.
Lastly, we investigated whether BAF function is required for proper nucleosome remodeling and activation of LRG enhancers. We compared H3K4me1 and H3K27ac ChIP-seq data obtained from exponentially proliferating MEFs prepared from Smarca4fl/fl and Smarca1fl/fl mice treated with Cre recombinase to remove BAF function to data from wild type MEFs grown under similar conditions (Alver et al., 2017). Disruption of either core component of BAF led to both impaired remodeling of H3K4me1-modified nucleosomes as well as a concordant significant and specific decrease in H3K27ac ChIP-seq signal at LRG enhancers compared to active enhancers that are not bound by AP-1 (Figure S5). These data are consistent with our observation that LRG enhancers selectively undergo inducible nucleosome remodeling upon stimulation, and suggest that these enhancers have a preferential requirement for AP-1-dependent BAF recruitment for the establishment of accessible chromatin during enhancer selection.
Discussion
Our findings suggest a model in which Ras/MAPK signaling participates actively in enhancer selection by inducing transcription of AP-1 TFs, which then bind together with cell type-specific LDTFs and SWI/SNF to select new enhancers. This has implications for understanding how cells integrate extrinsic information with cell intrinsic factors to select the appropriate enhancers from among the ~106 possible enhancer sequences in the genome. The widespread expression of AP-1 TFs also suggests that they could participate in enhancer selection during the differentiation of many cell types, consistent with observations from previous studies (Heinz et al., 2013; Hogan et al., 2017; Maurano et al., 2015). In addition, our data provide insight into the regulation of transcription by growth factors and other extracellular stimuli that signal through Ras/MAPK, which will be important for understanding its role in mediating diverse biological responses to environmental stimuli including cellular differentiation, stem cell function, the repair of tissue damage, cancer, and learning and memory (Simanshu et al., 2017). It will be interesting to further explore how AP-1 TFs and LDTFs in each cell type bind to and select specific nucleosomal enhancers (Figure S6). We favor a model in which AP-1 binds collaboratively with cell type-specific TFs to select specific nucleosome-occupied enhancers. Consistent with this, LDTF motifs in each cell type are enriched within 75 bp of the central AP-1 motif at enhancers, meaning that these groups of TFs may compete directly with the histone octamer to bind to the enhancer (Buecker et al., 2014; Moyle-Heyrman et al., 2011). This suggests that in some cases AP-1 TFs bind to AP-1 motifs on a nucleosome, a specific functional property thought to be limited to a subset of TFs called pioneer TFs (Zaret and Carroll, 2011). However, while in vitro nucleosome-binding assays suggest AP-1 can bind to AP-1 motifs on nucleosomes, structural modeling suggests that such binding would be disfavored due to steric constraints (He et al., 2013; Ng et al., 1997). Binding of AP-1 TFs to nucleosomes would also depend on where the AP-1 motif was located on the nucleosome (i.e. its translational and rotational phasing), as certain regions of nucleosomes are more accessible for TF binding than others. Simultaneous or sequential binding of LDTFs to a nucleosome could also facilitate the binding of AP-1 TFs by altering the accessibility of the nucleosome (Miller and Widom, 2003). This is consistent with our genetic data suggesting other LDTF motifs can be required for AP-1 binding to enhancers.
An important issue for future studies will be to determine how AP-1 binding together with LDTFs induces nucleosome remodeling. One possibility is that these TFs can compete directly with the histone octamer for binding to the enhancer sequence, a mechanism referred to as collaborative competition (Miller and Widom, 2003). It is not clear how BAF would contribute to enhancer selection in this scenario (Swinstead et al., 2016b; Zaret and Carroll, 2011). One could imagine that following direct eviction of the histone octamer by TFs that BAF is required to further remodel flanking nucleosomes to establish accessible chromatin.
Further studies will be required to better understand how AP-1 TFs recruit BAF to enhancers. At least one other signal-dependent TF, the glucocorticoid receptor, has been shown to interact directly with BAF, but the importance of this interaction for the recruitment of BAF to specific regulatory elements across the genome remains unclear (Fryer and Archer, 1998). Interestingly, AP-1 TFs were previously shown to be required for maintaining accessible chromatin at a subset of regulatory elements where the glucocorticoid receptor binds upon its activation in breast cancer cells (Biddie et al., 2011). One potential explanation for this finding is that BAF might interact simultaneously with AP-1 TFs and the glucocorticoid receptor, functioning as a polymorphic reader of TFs bound to cis-regulatory elements. This would be consistent with our data that AP-1 is necessary for BAF recruitment to many enhancers. However, AP-1 TF binding is not sufficient to recruit BAF to all AP-1 binding sites, suggesting that within each cell type additional TFs are required to recruit BAF to enhancers.
The requirement for BAF function for Ras/MAPK/AP-1-dependent enhancer selection suggests a unifying pathophysiological mechanism explaining the tumor-suppressive function of SWI/SNF, which is among the most frequently mutated tumor suppressors in human cancer (Kadoch and Crabtree, 2015). We propose that part of the pathogenesis of BAF mutations is due to the critical role of BAF in the Ras/MAPK/AP-1-dependent selection of enhancers. Thus, attenuation of BAF function could lead to deregulated Ras/MAPK-dependent transcriptional responses, which could impair cellular differentiation and/or activation of LRGs that function as negative feedback regulators of Ras/MAPK signaling (e.g. Sprouty, Spred proteins), which could synergize with hyperactivating mutations in Ras to drive oncogenic growth (Simanshu et al., 2017).
We previously showed that AP-1 TFs are critical mediators of neuronal activity-dependent enhancer function in cortical neurons (Malik et al., 2014). Interestingly, BAF complexes have a unique subunit composition in neurons (nBAF) that appears to be important for neuronal activity-dependent dendritic growth (Wu et al., 2007). Our findings raise the possibility that AP-1 TFs also interact with nBAF complexes. It will be interesting to determine whether the neuronal-specific subunits of nBAF modulate the nucleosome remodeling function of the complex at neuronal activity-regulated enhancers. Consistent with this, subunits of nBAF, in particular Arid1b, are strongly associated with de novo intellectual disability and are mutated in several Mendelian disorders that cause intellectual disability (Deciphering Developmental Disorders, 2017; Ronan et al., 2013). It will be important to further investigate the contribution of BAF mutations to enhancer selection across various stages of cognitive development.
Experimental Procedures
Contact for Reagent and Resource Sharing
Further information and requests for resources and reagents should be directed to and will be fulfilled by the Lead Contact, Thomas Vierbuchen (tvierbuchen@gmail.com).
EXPERIMENTAL MODEL AND SUBJECT DETAILS
The Harvard Medical Area Institutional Animal Care and Use Committee has approved our animal breeding and research protocols. Mice were used for isolating cultures of primary cells for all ChIP-seq, RNA-seq, ATAC-seq, and biochemistry experiments performed in this study.
Generation of Fos−/− mice
Fosfl/fl mice provided by Dr. Alexander Fleischmann (Fleischmann et al., 2003) were crossed to EIIA-Cre mice [B6.FVB-Tg(EIIA-cre)C5379Lmgd/J] (Jackson Labs Stock #: 003724) and then bred to each other to generate Fos−/− animals.
Generation of Fosbfl/fl mice
[Fosb-tm1a(KOMP)Wtsi] ES cell clone (EPD0587_1_H08) was purchased and blastocyst injections were performed by the Brigham and Women’s Hospital Embryonic Stem Cell Core facility under the supervision of Dr. Arlene Sharpe. Chimeric offspring were mated to C57Bl/6J mice and germline transmission was achieved. The LacZ-loxP-Neo cassette was excised by mating these mice to Rosa26-FLP [B6.129S4-Gt(ROSA)26Sortm2(FLP*)/Sor/J] (Jackson Labs Stock #: 012930) mice. The resultant mice were bred together to generate a homozygous Fosbfl/fl line.
Generation of Fosfl/fl; Fosbfl/fl; Junbfl/fl mice
Fosfl/fl mice, Fosbfl/fl mice and Junbfl/fl mice (Kenner et al., 2004) were bred together to generate Fosfl/fl; Fosbfl/fl; Junbfl/fl mice.
Generation of FosFLAG-HA mice
FosFLAG-HA knock-in mice were generated using CRISPR/Cas9. A guide RNA was designed using the CRISPR design algorithm (http://crispr.mit.edu) (5′-GCTCACAGGGCCAGCAGCGTGGG-3′) to target near the stop codon at the C-terminus of the endogenous Fos locus. T7-PCR template of gRNA was amplified for IVT reaction using the forward primer (5′-TAATACGACTCACTATAGGGCTCACAGGGCCAGCAGCGT-3′) and reverse primer (5′-AAAAGCACCGACTCGGTGCC-3′) and purified using Qiagen PCR purification kit. gRNA was in vitro transcribed using Ambion MEGAshortscriptT7 kit according to manufacturer’s instructions and purified using the Ambion MEGAclear kit according to manufacturer’s instructions. Purified gRNA, homology directed repair template (IDT) and Cas9 mRNA (System Biosciences) were provided to the Genome Modification Facility of the Harvard Stem Cell Institute where injections were performed under the supervision of Dr. Lin Wu. Heterozygous male was used as founder and bred to female C57Bl/6J mice. Fos-FLAG-HA tag was validated by PCR and sequencing and shown to be expressed at endogenous levels via western blot. F1 mice were then bred to produce homozygous knock-in mice.
Additional mouse strains
Fos-EGFP [B6.Cg-Tg(Fos/EGFP)1-3Brth/J] (Jackson Labs Stock #: 014135). SPRET/EiJ (Jackson Labs Stock #: 001146).
METHOD DETAILS
Cell culture
Mouse embryonic fibroblasts were generated from embryos removed from pregnant mothers on embryonic day 13.5–14.5 (E13.5–E14.5). Embryos were washed 6X in room temperature PBS and then the heads and internal organs were removed with 55 forceps. Single embryos were incubated in 500uL of 1X trypsin on 15cm tissue culture dishes for 30 min. After incubation, embryos were manually dissociated with scissors on the plate for ~20 seconds and then incubated in 2 mL of 1X trypsin for 35 min. Dissociated embryos were further broken down by adding 8 mL of MEF media to the embryo resuspension and forcefully pipetting up and down with a 10mL serological pipette 10–15 times. An additional 12 mL of MEF media was added and the resulting MEFs were grown at 37°C with 5% C02. Once confluent (generally within 48 hr), cells were trypsinized and expanded onto 5×15cm dishes. Once these became confluent again the cells were frozen down using freezing media consisting of 10% DMSO, 40% FBS, 50% MEF media.
For serum stimulation experiments, cells were thawed and expanded for one passage. All experiments were performed with MEFs at the same passage number (p3). For serum starvation, cells were split onto 15cm dishes (2.5×10⁶ cells/plate) and cells were washed in 10mL of PBS and then switched into 0.5% serum MEF media 12–16 hr after passaging. Cells were starved for 26–30 hr in 20mL of 0.5% serum media before being stimulated with 20mL of pre-warmed 30% serum MEF media (for a final concentration of 15% serum).
For identification of protein synthesis-dependent inducible enhancers, serum starved MEFs were treated with cycloheximide [10ug/mL from 1mg/mL stock in DMSO) for 10 min prior to addition of an equal volume of 30% serum containing media (without cycloheximide). Addition of serum containing media diluted the concentration to 5ug/mL in 15% serum media.
For identification of protein synthesis-dependent LRGs and Smarca4 ChIP-seq peaks, we treated serum starved MEFs with anisomycin [100 uM from 10 mg/mL stock in DMSO) for 10 min prior to addition of an equal volume of 30% serum containing media (without anisomycin). Addition of serum containing media diluted the concentration to 50 uM in 15% serum media.
For co-immunoprecipitation experiments to assess the interaction of Fos family members and Fos mutants with SWI/SNF complex components, HEK 293T cells [ATCC CRL-11268) were thawed and used for up to 10 passages. Cells were split onto 10cm dishes (~1 × 10⁶ cells/plate) 16–24 hours prior to transfection and transfected with 0.625 ug of each plasmid per plate.
Gene expression
Chromatin-associated RNA-seq
To more accurately measure serum stimulation-induced transcripts, we performed chromatin-associated RNA and sequencing as previously described (Bhatt et al., 2012). Briefly, MEFs from one 15cm plate per timepoint (0hr, 4hr) were washed once in cold PBS and scraped into 10 mL of 1X PBS. Cells were collected by centrifugation for 5 min at 1,350 g at 4°C and resuspended in 200 uL of cold cytoplasmic lysis buffer (0.15% NP-40, 10 mM Tris pH 7.5, 150 mM NaCl) using wide orifice tips. Pellets were rotated for 5 min at 4°C to lyse cells. The lysate was layered on top of 500 uL of cold sucrose buffer (24% sucrose (w/v), 10 mM Tris pH 7.5, 150 mM NaCl) and centrifuged for 10 min, 4°C at 15,871 g. The nuclear pellet was washed once in 200 uL of cold cytoplasmic lysis buffer and gently resuspended in 200 uL glycerol buffer (20 mM Tris-HCl pH 7.9, 75 mM NaCl, 0.5 mM EDTA, 50% glycerol, 0.85 mM DTT) using wide orifice tips. An equal volume of cold nuclei lysis buffer (20 mM HEPES pH 7.6, 7.5 mM MgCl2, 0.2 mM EDTA, 0.3 M NaCl, 1 M urea, 1% NP-40, 1 mM DTT) was added and the tube was gently vortexed for 2X2 sec. After 1 min incubation on ice, the chromatin was briefly pelleted for 2 min, 18,407 g at 4°C. The remaining chromatin pellet was washed with 200uL of a 1:1 mixture of glycerol buffer and cold nuclei lysis buffer and washed again with 50 uL of cold PBS. 500 uL TRIzol was added to the washed pellet, vigorously vortexed to resuspend chromatin, and stored at −80°C prior to library preparation.
Anisomycin treatment and RNA-seq
To identify bona fide late-response genes whose transcription requires de novo protein synthesis, we treated serum starved MEFs with anisomycin (100 uM from 10 mg/mL stock in DMSO) for 10 min prior to addition of an equal volume of 30% serum containing media (without anisomycin). Addition of serum containing media diluted the concentration to 50 uM in 15% serum media.
Spike-in normalized RNA-seq
To determine steady-state expression levels of AP-1 TFs in Figure 2b, mouse embryonic fibroblasts (2 6-well plate wells/timepoint; 6X10⁵ cells total), were serum starved and stimulated with serum as described above. 3 biological replicates were obtained for each of 3 stimulation time points: serum starved (“CTL”), and 1, and 4 hr post-stimulation. Cells were washed once with PBS and lysed in 2mL of Trizol. Prior to RNA extraction, an equal amount of ERCC spike-in control RNA was added to each sample, following the manufacturer’s specifications. RNA was extracted using the Qiagen RNeasy Mini Kit with on-column DNAse digestion.
Chromatin immunoprecipitation
Crosslinking
Growth media was removed and replaced with crosslinking buffer (10 mM HEPES-NaOH pH 7.5, 100 mM NaCl, 1 mM EDTA, 1 mM EGTA) containing 1% formaldehyde (added immediately before crosslinking) and incubated while shaking gently at room temperature for 10 min. Crosslinks were quenched by addition of glycine to a final concentration of 0.125 M, and incubated while shaking gently at room temperature for 5 min. Cells were washed once with cold PBS, scraped into 5 mL of cold PBS per plate, pooled, and spun for 5 min at 1,350 g at 4°C. Cell pellets were flash frozen in liquid nitrogen and stored at −80°C until use.
Dual crosslinking for Smarca4 ChIP-seq
Growth media was removed and cells were washed rapidly with 20mL of room temperature PBS. PBS was removed and replaced with 30mL of 1.5mM EGS (Pierce) in PBS. EGS crosslinking solution was prepared immediately prior to use by first making a 25mM stock solution in anhydrous DMSO (Sigma) and then diluting this stock to 1.5mM in PBS. Cells were incubated with light circulating shaking for 30 min. EGS crosslinking solution was removed and replaced with 1% formaldehyde in crosslinking buffer and incubated for 10 min. Crosslinks were quenched by addition of glycine to a final concentration of 0.125 M, and incubated while shaking gently at room temperature for 5 min. Cells were washed once with cold PBS, scraped into 5 mL of cold PBS per plate, pooled, and spun for 5 min at 1,350 g at 4°C. Cell pellets were flash frozen in liquid nitrogen and stored at −80°C until use.
Nuclei prep
Frozen crosslinked cell pellets were thawed on ice for up to 1 hr. Pellets were resuspended in cold 5 mL L1 buffer (50 mM HEPES-NaOH pH 7.5, 140 mM NaCl, 1 mM EDTA, 1 mM EGTA, 0.25% Triton X-100, 0.5% NP-40, 10% glycerol, protease inhibitors; 10 mM sodium butyrate added for H3K27ac ChIPs) by pipetting and rotated vertically at 4°C for 10 min. Pellets were spun for 5 min at 1,350 g at 4°C, and the supernatants were aspirated. Pellets were resuspended in cold 5 mL L2 by pipetting (10 mM Tris-HCl pH 8.0, 200 mM NaCl, protease inhibitors; 10 mM sodium butyrate added for H3K27ac ChIPs) and rotated vertically at 4°C for 10 min. Pellets were spun for 5 min at 1,350 g at 4°C, and the supernatants were aspirated. Pellets were resuspended in cold 1.5 mL LB3 (10 mM Tris-HCl pH 8.0, 100 mM NaCl, 1 mM EDTA, 0.5 mM EGTA, 0.1% sodium deoxycholate, 0.5% N-lauroylsarcosine, protease inhibitors; 10 mM sodium butyrate added for H3K27ac ChIPs) by pipetting and transferred to polystyrene tubes for sonication.
Sonication
Nuclei pellets were sonicated in polystyrene tubes (Bioruptor, Diagenode) on high power with 36–42 cycles of 30 sec “on”, 45 sec “off”. After sonication, Triton X-100 was added to 1% final concentration and sonicated chromatin was centrifuged at 16,000 g for 5 min at 4°C. The supernatant was used for preclearing and ChIP. All subsequent steps were performed using DNA LoBind tubes (Eppendorf).
Preclearing and antibody-bead coupling
Protein A Dynabeads (Life Technologies) were washed twice with blocking buffer (0.1% BSA in LB3 + 1% Triton X-100) and aliquoted for preclearing and antibody-bead coupling. Antibodies were coupled to beads in 1.8 mL of blocking buffer by vertical rotation at 4°C for 4 hrs. In parallel, each sample of sonicated chromatin was incubated with an equivalent volume of washed bead slurry for preclearing. Each ChIP was performed in 1.8 mL LB3 + 1% Triton X-100 and rotated vertically at 4°C for 16 hrs.
Washes and elution
For each wash, beads were rotated vertically in wash buffer at 4°C for 5 min. Beads were washed twice with low salt wash buffer (0.1% SDS, 1% Triton X-100, 2 mM EDTA, 20 mM Tris-HCl pH 8.0, 150 mM NaCl), twice with high salt wash buffer (0.1% SDS, 1% Triton X-100, 2 mM EDTA, 20 mM Tris-HCl pH 8.0, 500 mM NaCl), twice with lithium chloride wash buffer (0.25 M LiCl, 1% NP-40, 0.5% sodium deoxycholate, 1 mM EDTA, 10 mM Tris-HCl pH 8.0), and once with TE (50 mM Tris, 10 mM EDTA). Beads were then incubated at 65°C in 200 uL of TE + 1% SDS per sample for 30 min with vortexing every 10 min. Eluted protein-DNA complexes were separated from the beads and incubated at 65°C for 16 hrs to reverse crosslinks.
Purification of immunoprecipitated DNA
Elutions were incubated with 10 ug RNase for 30 min-1 hr at 37°C, followed by 140 ug proteinase K for 2–3 hrs at 55°C with shaking. DNA was extracted with 1 volume of 25:24:1 phenol-chloroform-isoamyl alcohol and purified with a Qiagen PCR purification kit. ChIP DNA concentrations were determined by Qubit.
Library preparation and sequencing
RNA-seq
For chromatin-associated RNA used to identify LRGs, RNA was treated with TURBO DNase using the TURBO DNA-free kit to remove remaining DNA. For RNA from anisomycin-treated cells used to identify LRGs, RNA was isolated from TRIzol samples using Qiagen RNeasy Mini kit. Libraries from both sets of RNA were made using the NEBNext rRNA Depletion kit to remove contaminating rRNA and NEBNext Ultra Directional RNA Library Prep Kit for Illumina per manufacturer’s protocol with minor adjustments. Libraries were sequenced on the Illumina NextSeq 500 platform with 75 bp single-end reads. For spike-in normalized RNA used in Supplementary Fig. 4c, RNA-Seq libraries were prepared and sequenced by Beijing Genomics Institute on an Illumina HiSeq 2000 platform to produce 20–22M non-strand-specific single-end reads of 49 bp uniform length per sample.
ChIP-seq
5–10 ng of the following ChIPs and their respective inputs from wild-type C57B1/6J MEFs were submitted to the Beijing Genomics Institute (BGI) for library preparation and 49-bp single-end sequencing on the Illumina HiSeq 2000 platform: all replicates of H3K27ac 0, 10, and 90m, all replicates of Fos 0 and 90m, and replicate 1 of JunD 0 and 90m. For all other ChIPs, 2–40 ng of each ChIP sample were used to prepare libraries with the NuGEN Ovation Ultralow Library System v2 kit per manufacturer’s protocol. Libraries were sequenced on the Illumina NextSeq 500 platform with 75 bp single-end reads, or 2×150 bp paired-end reads for supplementary Fig. 2b–c.
ATAC-seq
ATAC libraries were generated as previously described (Buenrostro et al., 2013) using nuclei from 40,000 MEFs per sample and sequenced on the Illumina NextSeq 500 platform with 75 bp single-end reads.
Virus production and infection
Infectious lentiviral particles were produced in HEK293T cells using the third generation lentiviral packaging plasmids pMD2.G (Addgene plasmid # 12259), pRSV-rev (Addgene plasmid #: 12253) and pMDLg/pRRE (Addgene plasmid #: 12251) (Dull etal., 1998). Cellular debris was removed from lentiviral supernatant by centrifugation at 1,000g for 5 min. Lentiviral supernatant was concentrated at 106,750 g for 90 min, resuspended overnight with gentle shaking in DMEM with polybrene (8ug/mL), aliquoted and stored at −80°C. Concentrated lentivirus titer was determined by limiting dilution in HEK293T cells to determine the ratio of infectivity between FUW-nGFP-Cre and FUW-nGFP-deltaCre virus and equal amounts of infectious particles were then titered on mouse embryonic fibroblasts to determine the minimal amount required for infection of essentially all cells on either a 6-well plate or a 15cm plate. For experimental samples, Fosfl/fl; Fosbfl/fl; Junbfl/fl mouse embryonic fibroblasts were plated on 6-well plates (for collecting RNA; 3×10⁵ cells/plate) or 15cm plates (for ChIP-seq; 4.5 ×10⁶cells/plate). 12 hr later, cells were washed once with PBS and switched into 0.5% serum containing media with polybrene (8ug/mL) and the appropriate amount of concentrated lentiviral particles. After 8 hr, cells were washed once with PBS and switched into 0.5% serum media for the remainder of the serum starvation period (26–30 hr total). Serum stimulation and processing was performed as indicated above.
Glycerol gradient centrifugation
Serum-stimulated MEFs on a 15cm plate were washed once in PBS, scraped into 3 mL of NE1 buffer (20 mM HEPES pH 7.9, 10 mM KCl, 0.1% Triton X-100, 1 mM EDTA, protease inhibitors), and rotated for 10 min at 4°C. Crude nuclei were pelleted for 5 min at 800 g and resuspended in 1.5 mL of fresh NE1 buffer. Nuclei were sonicated in polystyrene tubes (Bioruptor, Diagenode) on high power with 8 cycles of 30 sec “on”, 45 sec “off”. After sonication, 1 uL Benzonase nuclease (Sigma) was added and nuclei were rotated for 20 min at 4°C. 5 M NaCl was added to 420 mM final concentration and rotated for 30 min at 4°C. The nuclear extract was centrifuged in a TLA-120.1 rotor (Beckman) at 77,000 rpm for 20 min at 4°C to remove insoluble material. 160 uL of the supernatant was layered onto a 1.7 mL 10–30% glycerol gradient (in 50 mM HEPES-NaOH pH 7.6, 150 mM NaCl, 3 mM MgCl, 1 mM EDTA). Tubes were centrifuged in a TLS-55 rotor (Beckman) at 45,000 rpm for 12 hrs at 4°C. 160 uL fractions were collected and resuspended in sample buffer for western blotting.
IP-mass spectrometry
300–450 million MEFs from Fos-EGFP or control mice were serum stimulated for 90m. MEFs were washed once in cold PBS and scraped into 10 mL of NE1 buffer (20 mM HEPES pH 7.9, 10 mM KCl, 0.1% Triton X-100, 1 mM MgCl2, 1 mM DTT, protease inhibitors) per 15cm plate. Lysates were pipetted up and down to disperse cells and rotated for 10 min at 4°C. Crude nuclei were pelleted at 800 g for 10 min at 4°C and resuspended in 1 packed nuclear volume (pnv) of NE1. Nuclei were briefly sonicated (Misonix 3000) at power 60, 2 min total “on” time (15 sec “on”, 45 sec “off”). 3 uL of Benzonase (Sigma) was added and the sonicated nuclei were rotated for 30 min at 4°C. NaCl was added to 150 mM and the sonicated nuclei were rotated for an additional 20 min. Nuclei were pelleted at 16,000 g for 20 min at 4°C to remove insoluble material. The supernatant was used for the IP.
20 uL of GFP-TRAP A (Chromotek) bead slurry was used for immunoprecipitation from every 3×15 cm plates of MEFs. Nuclear extracts were precleared with an equivalent bed volume of blocked agarose beads (Chromotek). Beads were washed 3 times in NE1+150 mM NaCl buffer and the washed blocked agarose beads were added to nuclear extracts to rotate for 1 hr to preclear. Precleared nuclear extracts were added to washed GFP-TRAP beads and rotated for 1 hr at 4°C for immunoprecipitation. Beads were pelleted at 2,700 g for 2 min and washed 4 times with NE1+150 mM NaCl buffer with rotation for 5 min at 4°C per wash. Proteins were eluted from beads by boiling in 100 uL of sample buffer, and IP was confirmed by western blotting. The remainder of the eluted proteins were concentrated by TCA precipitation and submitted for LC-MS/MS (Taplin Mass Spectrometry Facility, Harvard Medical School). Total spectral counts for each protein from all 5 replicates of Fos-EGFP IP-MS data were analyzed via the CRAPome (Mellacheruvu et al., 2013) using database version 1.1, “Other” as the organism, and all 3 replicates of anti-GFP IPs from control MEFs as the controls.
Co-immunoprecipitation
MEFs
20–30 15cm plates per genotype of serum-stimulated MEFs were washed once in PBS, scraped into 3 mL of NE1 buffer (20 mM HEPES pH 7.9, 10 mM KCl, 0.1% Triton X-100, protease inhibitors) per 15 cm plate, and rotated for 10 min at 4°C. Crude nuclei were pelleted for 5 min at 800 g and washed with 10 mL of NE1. Washed nuclear pellets were resuspended in 1.5 mL NE1. Nuclei were sonicated in polystyrene tubes (Bioruptor, Diagenode) on high power with 8 cycles of 30 sec “on”, 45 sec “off”. After sonication, 1 uL Benzonase nuclease (Sigma) was added and nuclear extracts were rotated for 20 min at 4°C. 5 MNaCl was added to 420 mM final concentration and rotated for 30 min at 4°C. Sonicated chromatin was centrifuged at 77,000 rpm in a TLA-120.1 rotor (Beckman) for 20 min at 4°C to remove insoluble material. 1 volume of NE1 was added to the supernatant to dilute the NaCl concentration to 210 mM for IPs. Prior to the IP, the supernatant was precleared in 100 uL slurry of mouse IgG agarose beads (Sigma) for 1 hr at 4°C. During preclearing, 50 uL of FLAG-M2 agarose slurry for each IP was blocked by incubating in 5% BSA in NE1+210 mM NaCl at 4°C. Blocked FLAG-M2 beads were washed once with NE1+210 mM NaCl and incubated in precleared nuclear extract for 1 hr in 1.5 mL at 4°C. Beads were washed 4 times in 500 uL of RIPA buffer for 5 minutes at 4°C per wash. Nonspecifically interacting proteins were mock eluted from beads twice by incubation with 0.5 mg/mL V5 peptide in 60 uL NE1+210mM NaCl on a TOMY shaker at setting 2.5 for 15 minutes at room temperature for each elution. Finally, interactors were eluted by incubation with 0.5 mg/mL 3X FLAG peptide in 60 uL NE1+210mM NaCl on a TOMY shaker at setting 2.5 for 15 minutes at room temperature.
293T cells
Co-IPs from 293T cells were performed as described above for MEFs with the following modifications: 8×10cm plates per condition were collected 24 hours after transfection, and 1 mg of precleared nuclear extract was used for each co-IP.
QUANTIFICATION AND STATISTICAL ANALYSIS
RNA-Seq data processing
Read processing and alignment
Reads were aligned to the mouse genome (GRCm38/mm10 assembly, Dec. 2011) using the Burrows-Wheeler Aligner (bwa) tool. Two sets of target sequences were provided and incorporated into the bwa index in addition to the usual 21 chromosomal targets: (1) the 16,299-bp mouse mitochondrial genome (GenBank accession NC_005089.1); and (2) a set of ~ 8 million short (≤ 96bp) exon-exon splice-junction sequences (see below). For RNA-seq data used in Figure 2b, a third set of 92 short (< 2.1kb) spike-in oligos representing a wide range of reference concentrations (ERCC RNA Spike-In Mix, Life Technologies; Mix 1) was also incorporated into the index. Typically ~97% of all reads were mappable, allowing up to 2 mismatches, and of these ~85% were mapped uniquely. Multiple reads whose 5′ ends were assigned to the same locus were not flattened to a single count.
The splice-junction target sequences were based on the NCBI RefSeq database for GRCm38. For each annotated transcript, we noted all subsets of two or more exons, not necessarily adjacent, that could be spliced together to produce a sequence at least as long as the read length (75 bp for chromatin-associated RNA and RNA from anisomycin treatment experiments; 49 bp for spike-in normalized RNA). Each of these sequences were then trimmed to the maximum number of bases such that a read mapping to the sequence would have to cross these ordered exons’ splice junction(s). This procedure produced a library of all unique sets of exons whose intragenic splice junctions could possibly be covered by a read of the given length, based on the RefSeq annotation of exonic loci. Aligned reads thus had the opportunity to align either to genomic (chromosomal) sequences or to exon-junction-crossing sequences found only in mature mRNA.
Expression level quantification
An in-house software tool, MAPtoFeatures (Gray et al., 2014), was used to quantify expression levels for individual genes as follows. A database of genic features (CDSs and UTRs) was constructed from all 95,023 genomic transcripts annotated in RefSeq for GRCm38. Merged genes were constructed by unioning all exons in all transcripts assigned to each distinct gene; the resulting segments defined the gene’s exonic coordinates used here (with the gaps between them defining introns). Genes with zero CDS exons were labeled “noncoding”. These 33,102 genes were supplemented with 1,563 additional noncoding genes specified by the loci of all ribosomal RNA genes obtained from RepeatMasker (where the options Variations and Repeats, rmsk.repFamily=“rRNA” yielded 480 LSU-rRNA_Hsa; 45 SSU-rRNA_Hsa; 1,038 5S). The purpose of this step was to allow the filtering out of reads stemming from transcription of repeats and rRNA genes, which tend to get populated to inconsistent degrees from sample to sample depending on the variable quality of rRNA depletion.
Reads that aligned uniquely were then queried for their intersection with the exonic ranges of any of the above 34,665 genes, including exon-exon splice junctions. The total number of read bases that overlapped an exonic range was divided by the range’s length to give an average exonic read Density (i.e., coverage). All reads were assigned to genes or to intergenic regions. However, only those reads not assigned to noncoding genes counted towards the total normalization count N, which ultimately afforded a more stable comparison of expression levels between samples than simply using the total number of reads. All read densities were normalized to a reference total of 10 million reads and a reference read length of 35 bp through multiplication by the factor (107/N)×(35 bp/76 bp). (Division of these normalized densities by 0.35 yielded expression levels in alternative units of reads per kilobase of transcript per million mapped reads, RPKM.)
For RNA-seq data used in Figure 2b, an additional normalization step was carried out exploiting the ERCC spike-in sequences. The normalized read Densities for these 92 targets were calculated as described above for each of our 36 samples. Any residual sample-to-sample variation was accounted for by a model wherein log-transformed observed Densities log(Dobs) for each sample were assumed to have a simple linear dependence on the log-transform of the spike-in concentration C: log(Dobs) = ak + bk*log(C) (k = 1, …, 36), with the expectation that bk ~ 1 for the slopes. The parameters (ak,bk) were obtained for each sample from a linear least-squares fit to the spike-in oligos’ known concentrations and observed Densities in that sample; indeed, the slopes were found in the range 0.94–0.99, with an average standard error of the slope 0.047 over all the fits. (In particular, these fits were based on only those 49 oligos that were observed with nonzero expression in all samples.) Inverting each linear fit, any gene’s Dobs for sample k could be replaced by an inferred concentration C that supposedly derives from a “true” Density value D. Renormalization among all samples was achieved by a transformation back to log-Densities that would yield the same value of D in any sample for a given C: log(D) = a0 + log(C), i.e., with exactly unit slope and with intercept a0 equal to the mean of all {ak}. Finally, each observed Density in sample k was replaced with a renormalized Density D via log(D) = a0 + ([log(Dobs) − ak]/bk). (Zero Densities were left unchanged.) Of course the base used for all the logarithms is arbitrary; the mean intercept for base-10 calculations was a0 = −1.618. For downstream analyses, genes with a normalized exon density value of 0 in any replicate at any timepoint were discarded to remove lowly expressed genes.
Identification of protein synthesis-dependent LRGs
Normalized exon density values were used to perform the following differential expression analyses with the voom function in limma (version 3.28.17) (Law et al., 2014).
-
(i)
Genes with a significant increase in expression at timepoints of maximal LRG transcription (average of 90 and 120m; n=553/13,769, >2-fold change, FDR<0.01).
-
(ii)
Genes with a significant decrease in expression with anisomycin treatment at a timepoint of peak LRG expression (4hr; n=452/14,498, >2-fold change, FDR<0.01)
-
(iii and iv)
Genes with a significant increase in expression at timepoints of maximal transcription of IEGs and delayed IEGs (10m and 30m; n=81/13,769 and n=308/13,769 respectively, >2-fold change, FDR<0.01).
Significant genes in (iii) and (iv) were removed from the significant genes in the intersection of (i) and (ii) to yield a list of 173 protein synthesis-dependent LRGs.
ChIP-seq data processing
Read processing and alignment
Demultiplexed FASTQ files were trimmed with Trimmomatic (version 0.33) using the parameter SLIDINGWINDOW:5:30 (Bolger et al., 2014). Trimmed reads were aligned to the mm10 reference genome using Bowtie (version 1.1.1) (Langmead et al., 2009) with the parameters -S -n 2 -e 70 -m 1 -k 1 -l 49 --best. Paired end reads used in Supplementary Figure 2b–c were mapped using Bowtie (verion 2.2.4). Uniquely mapped reads were extracted using samtools (version 0.1.19) (Li et al., 2009) view with the parameters -h -b -F 3844 -q 10. Tag directories of reads were created using HOMER (version 4.6) makeTagDirectory (Heinz et al., 2010).
Peak calling
High confidence peaks across concordant biological replicates were identified via ENCODE’s Irreproducible Discovery Rate (IDR) pipeline using a 1% IDR threshold (Landt and Marinov, 2012). For each set of replicates, bam files of reads were pooled and 2 pseudoreplicate files were generated by samtools view with the parameters -h -b -s 1.5 and -h -b -2.5. Peaks in biological replicate, pooled replicate, and pseudoreplicate samples were called over pooled input samples using two peak callers with a relaxed threshold: MACS2 (version 2.1.1) (Zhang et al., 2008) with the parameters --nomodel -g mm -p 1e-1 --extsize 200, and the IDR pipeline’s phantompeakqualtools version of SPP (Kharchenko et al., 2008) with the parameters -npeak=300000 -speak=100. An optimal final set of IDR-filtered peaks was obtained from each peak caller, and their intersection was taken as the consensus peak set. For transcription factor ChIPs, these consensus peaks were recentered on regions of maximum read overlap using HOMER with the parameter getPeakTags -center. These recentered peaks were used as the final high-confidence peak set for further analyses and the centers of these peaks were used as summits for analyses with HOMER.
ATAC-seq data processing
Read processing and alignment
Demultiplexed FASTQ files were trimmed with Trimmomatic (version 0.33) using the parameter SLIDINGWINDOW:5:30 (Bolger et al., 2014). Trimmed reads were aligned to the mm10 reference genome using Bowtie with the parameters -S -n 2 -e 70 -m 1 -k 1 -l 49 --best. PCR duplicates were removed with Picard MarkDuplicates. Tag directories of reads were created using HOMER makeTagDirectory.
Peak calling
High confidence peaks across concordant biological replicates were identified via ENCODE’s Irreproducible Discovery Rate (IDR) pipeline using a 1% IDR threshold. For each set of replicates, bam files of reads were pooled and 2 pseudoreplicate files were generated by samtools view with the parameters -h -b -s 1.5 and -h -b -2.5. Peaks in biological replicate, pooled replicate, and pseudoreplicate samples were called over pooled input samples using two peak callers with a relaxed threshold: MACS2 with the parameters --nomodel -g mm -p 1e-1, and the IDR pipeline’s phantompeakqualtools version of SPP with the parameter -npeak=500000. An optimal final set of IDR-filtered peaks was obtained from each peak caller, and their intersection was taken as the consensus peak set. These consensus peaks were recentered on regions of maximum read overlap using HOMER with the parameter getPeakTags -center. These recentered peaks were used as the final high-confidence peak set for further analyses and the centers of these peaks were used as summits for analyses with HOMER.
Definition of enhancer classes
For enhancer classes in Figure 1, 1kb windows centered on summits of ATAC-seq peaks (merged across 0, 10, and 90m) from C57Bl/6J MEFs were intersected with H3K27ac peaks (merged across 0, 10, and 90m) to yield a total of 24,125 1kb windows at active regulatory elements across the genome. Raw H3K27ac read counts within this set of 1kb windows were obtained with HOMER (using the parameters -size 1000 -len 200 -noadj) and used as the input to differential signal testing by both DESeq2 (version 1.12.3) (Love et al., 2014) and edgeR (version 3.14.0) (Robinson et al., 2010). For each comparison, windows with significant increase in H3K27ac signal with FDR<1x10⁻⁴ by both DESeq2 (altHypothesis=“greater”) and edgeR (glmTreat) were obtained. After each differential analysis, to restrict our analyses to gene-distal regulatory elements (at least +/− 1kb away from an annotated TSS) that were likely to be enhancers, we used ENCODE’s H3K4me1 (GSM769028) and H3K4me3 (GSM769029) ChIP-seq data from MEFs and only considered the subset of windows at which the H3K4me1 signal was significantly higher than H3K4me3.
LRG enhancers (n=2,144, Supplementary Figure 1a)
Putative LRG enhancers were identified by performing tests for windows with differential H3K27ac signal in the following contrasts:
-
(i)
90m stimulated MEFs vs. unstimulated MEFs
-
(ii)
90m stimulated MEFs vs. 10m stimulated MEFs
-
(iii)
10m stimulated MEFs vs. unstimulated MEFs
The windows obtained in (i) and (ii) were intersected and the windows obtained in (iii) were removed from this intersection to remove possible ERG enhancers.
LRG enhancers, protein synthesis-dependent (n=1,398, Figure 1a)
To identify the protein synthesis-dependent subset of LRG enhancers identified above, we performed additional tests:
-
(iv)
90m stimulated MEFs vs. 90m stimulated MEFs treated with cycloheximide
-
(v)
90m stimulated MEFs treated with cycloheximide vs. unstimulated MEFs treated with cycloheximide
For each comparison, windows with significant increase in H3K27ac signal with FDR<1x10⁻⁴ by both DESeq2 and edgeR were obtained. The 2,144 windows obtained above were intersected with the windows obtained in (iv), and the windows obtained in (v) were removed from this intersection to remove enhancers that were still induced at 90m in the presence of cycloheximide. The remaining windows were considered protein synthesis-dependent LRG enhancers.
LRG enhancers, protein synthesis-dependent and occluded by nucleosomes prior to stimulation (n=619, Figures 4b,d)
To identify the subset of the 1,398 LRG enhancers that are occluded by nucleosomes prior to stimulation, the enhancers that overlapped with ATAC-seq peaks at 0hr were first removed. Next, ATAC-seq peaks with significantly inducible signal upon serum stimulation were identified by performing differential testing for ATAC-seq signal in 90m stimulated MEFs vs. unstimulated and 10m stimulated MEFs within 500bp windows centered at ATAC summits (FDR<1x10⁻⁴ by both DESeq2 and edgeR). The protein synthesis-dependent LRG enhancers that do not have an ATAC-seq peak at 0hr were intersected with this set of significantly inducible ATAC-seq peaks to obtain the subset that are occluded by nucleosomes prior to stimulation and are strongly remodeled upon stimulation.
ERG enhancers (n=352, Figure 1a)
ERG enhancers were identified by first performing a thresholded test for 10m stimulated MEFs vs. unstimulated MEFs (>1.4-fold, FDR<1x10⁻⁴ by both DESeq2 and edgeR). Windows obtained in (i), (ii), and (iv) were removed from windows obtained in (iii). In contrast to the LRG and constitutive enhancers identified above, because several of these ERG enhancers near canonical ERGs (e.g. Fos, Nr4a1) did not have significantly higher H3K4me1 signal over H3K4me3, these enhancers were not restricted to the subset that had significantly higher H3K4me1 signal over H3K4me3.
Cell identity enhancers (n=8,568, Figure 1a)
Protein synthesis-dependent LRG enhancers (n=1,398) and windows obtained in (iii) above were subtracted from active enhancers with significantly higher H3K4me1 signal over H3K4me3 (n=10,527) to obtain a set of cell identity enhancers.
Data visualization
Scatterplots (e.g. Figure 2a)
Normalized read counts calculated in DESeq2 were averaged across biological replicates. Scatterplots display log2 normalized values of these averages.
Fixed line plots (e.g. Figure 1a)
Tag directories of concordant biological replicates were merged using HOMER makeTagDirectory to create a single tag directory of pooled reads. Read densities in 25bp bins across 1kb windows centered at summits of interest were obtained using HOMER annotatePeaks.pl with the parameters mm10 -size 1000 -hist 25 –ghist (tag directories were normalized to 10 million reads by default).
Aggregate plots (e.g. Figure 4d)
Tag directories of concordant biological replicates were merged using HOMER makeTagDirectory to create a single tag directory of pooled reads. Read densities in 10bp bins across 2 or 4 kb windows centered at summits of interest were obtained using HOMER annotatePeaks.pl with the parameters mm10 -size [2000 or 4000] -hist 10 (tag directories were normalized to 10 million reads by default).
Genome browser tracks (e.g. Figure 3h)
Bed files of reads from concordant biological replicates were concatenated and normalized to 10 million reads with BEDtools (version 2.23.0) (Quinlan and Hall, 2010) genomeCoverageBED using the -scale parameter. Coordinates in mm10 are indicated above genome browser tracks.
Motif and SNP frequency histograms (e.g. Figure 1d): bedtools (version 2.23.0) window (-u -w 250) was used to obtain unique instances of motifs or the subset of motifs overlapping SNPs within +/−250bp of summits of interest. Motif frequency histograms were generated by plotting histograms of instances of these motifs in each group within +/−250bp windows and dividing each 20-bp bin by the total number of windows in each group. SNP frequency histograms were plotted in a similar manner, but instead each bin was divided by the subset of windows in each group that contained the motif.
Motif analysis
Identification of known motifs enriched at enhancers (Figures 1b–c, 2c, 5b)
CentriMo (Bailey and Machanick, 2012) was used to query position weight matrices (pwms) in the JASPAR 2016 CORE vertebrates database (Mathelier et al., 2016) for enrichment within the central 500bp of each enhancer class using default parameters. For Figure 5b, CentriMo was performed in discriminative mode (--disc) on canonical AP-1 motifs (TGASTCA) bound by Fos in MEFs (n=5,100) over a control set of canonical AP-1 motifs that were not bound by Fos (n=394,249); the canonical AP-1 motif was also masked in the C57B1/6J reference genome queried to increase the sensitivity of detection of additional motifs. To restrict our analysis to consistently represented motifs, we performed a parallel search for known motifs with HOMER findMotifsGenome.pl. The motifs that were enriched by both CentriMo (E-value < 0.01) and Homer (p-value < 1x10⁻⁸) were used for further analysis.
Identification of motif instances (Figures 1b–e, 2c–d, 3j, 5c–e,h)
All pwms found to be significantly enriched by CentriMo were assigned to TF subfamilies based on annotations in TFClass (Wingender et al., 2015). These subfamilies were further separated into distinct subfamilies where appropriate; for example, because pwms assigned to the subfamily bZIP-Fos in TFClass contain binding sites for both AP-1 (TGASTCA) and CREB (TGACGTCA), these were reassigned to bZIP-AP-1 and bZIP-CREB subfamilies respectively. Pwms within the central 500bp of peaks of interest were identified using FIMO (Grant et al., 2011) using a 0th-order Markov model built from the queried genome with MEME fasta-get-markov. If FIMO identified multiple pwms for a given TF subfamily, positions of each of these pwms were merged to obtain all possible binding sites of the TF subfamily.
Numbers for ORs and chi-squared tests: bedtools (version 2.23.0) window (-u -w parameters) was used to obtain unique instances of motifs or the subset of motifs overlapping SNPs within windows centered around summits of interest.
Identification of specific Fos binding sites
ChIP-seq with an anti-Fos antibody was performed in duplicate from Fos−/− MEFs under the same conditions used for anti-Fos ChIP from wild-type C57B1/6J MEFs. The intersection of the following treatment peak sets were obtained: (i) Fos ChIP-seq from 90m stimulated wild-type C57Bl/6J MEFs vs Fos ChIP-seq from 90m stimulated Fos−/−MEFs and (ii) Fos ChIP-seq from 90m stimulated wild-type C57Bl/6J MEFs vs input. Any peaks from this intersection that overlapped with the following control peak set were removed: Fos ChIP-seq from 90m stimulated Fos−/− MEFs vs input. The remaining peak set was used as the final high-confidence Fos peak set for further analyses.
Strain-specific analyses between C57Bl/6J and SPRET/EiJ
Construction of SPRET/EiJ pseudogenome
SNPs occurring in the SPRET/EiJ genome relative to the mm10 reference genome were obtained from SNP release version 5 of the Mouse Genomes Project (Keane et al., 2011). Only high-confidence SNPs annotated with the PASS filter, filtered using VCFtools (version 0.1.12) (Danecek et al., 2011), were used in all analyses. The SPRET/EiJ pseudogenome was constructed from these SNPs using Modtools (version 1.0.2) (Huang et al., 2013).
Eliminating mapping bias from C57Bl/6J and SPRET/EiJ reads
Prior to strain-specific analyses, ChIP-seq and ATAC-seq reads were filtered for mappability with the WASP pipeline (van de Geijn et al., 2015). Briefly, demultiplexed trimmed reads were mapped in parallel to their respective genomes (mm10 reference genome or SPRET/EiJ pseudogenome), and reads that mapped to the SPRET/EiJ pseudogenome were converted to mm10 coordinates with Lapels (version 1.0.6) (Holt et al., 2013). Uniquely mapped reads that overlapped SNPs were used to generate FASTQ files of reads containing every possible allelic combination of SNPs, and these reads were remapped to the other strain’s genome. The original SNP-overlapping reads were discarded if their respective reads with all possible allelic combinations could not all be remapped to the same mm10 coordinates, and the remaining reads were used for further analyses. Mappability filtered reads were used to call peaks. For H3K4me2 ChIP-seq from C57Bl/6J X SPRET/EiJ F1 hybrid MEFs in Supplementary Figure 2b–c, the same procedure was applied, except that prior to filtering with the WASP pipeline the informative reads that overlapped SPRET/EiJ SNPs were first extracted based on the allele.
Identification of LRG and cell identity enhancers in each strain (for Figure 2)
1kb windows centered on summits of ATAC-seq peaks (from C57Bl/6J and/or SPRET/EiJ; merged across 0, 10, and 90m) were intersected with H3K27ac peaks from the (from C57Bl/6J and/or SPRET/EiJ; merged across 0 and 90m) to yield a total of 38,523 possible active enhancers. For each strain, raw H3K27ac read counts within this set of 1kb windows were obtained and used as the input to the following differential tests by both DESeq2 and edgeR:
90m stimulated MEFs vs. unstimulated MEFs
90m stimulated MEFs vs. 10m stimulated MEFs
10m stimulated MEFs vs. unstimulated MEFs
For each comparison, windows with significant increase in H3K27ac signal with FDR<l×l0−4 by both DESeq2 and edgeR were obtained. LRG and cell identity enhancers were next identified separately within each strain as described below.
LRG enhancers (C57Bl/6J, n=3,379; SPRET/EiJ, n=3,166; n=4,679 total unique enhancers)
The windows obtained in (i) and (ii) above were intersected and the windows obtained in (iii) were removed from this intersection to remove possible ERG enhancers. The windows were next intersected with H3K4me1 peaks called from the respective strain to obtain a set of LRG enhancers. The LRG enhancers identified in each strain were merged and used for strain-specific analyses.
Cell identity enhancers (C57Bl/6J, n=23,068; SPRET/EiJ, n=21,985; n=24,803 total unique enhancers)
The LRG enhancers and windows obtained in (iii) above were subtracted from active enhancers to remove all stimulus-inducible enhancers. The windows were next intersected with H3K4me1 peaks called from the respective strain to obtain a set of cell identity enhancers. The cell identity enhancers identified in each strain were merged and used for strain-specific analyses.
Identification of strain-specific selected cell identity and LRG enhancers (Figure 2a–b)
Raw read counts of ATAC-seq and H3K4me1 ChIP-seq data were obtained within 500bp (ATAC) or 1kb (H3K4me1) windows centered at the summits of the union of ATAC-seq peaks from both strains. For each dataset, strain-specific windows were defined as those with significantly higher signal in one strain over another with FDR<1×10⁻⁶ by both DESeq2 and edgeR. The enhancers that had both strain-specific ATAC and H3K4me1 signal and no ATAC peak in the unselected strain were considered strain-specific selected enhancers. These strain-specific selected enhancers were intersected with the cell identity and LRG enhancers identified above to obtain 363 strain-specific selected cell identity enhancers (198 C57Bl/6J-specific and 165 SPRET/EiJ-specific) and 42 strain-specific selected LRG enhancers (21 C57Bl/6J-specific and 21 SPRET/EiJ-specific).
Effect of SNPs in AP-1 motifs (Figure 3a)
To assess the impact of SNPs in AP-1 motifs on the selection of AP-1 bound enhancers, we first merged all distal Fos peaks in C57Bl/6J and/or SPRET/EiJ and obtained the subset of these peaks that overlapped both an ATAC and an H3K4me1 peak in either strain and contained a single canonical AP-1 motif (TGASTCA) in the central 250bp in either strain (n=18,415). We intersected the coordinates of the single canonical AP-1 motif within these peaks with the coordinates of SNPs in SPRET/EiJ to obtain the subset of these 18,415 peaks that contained at least one SPRET/EiJ SNP within the canonical AP-1 motif (n=1,380). We limited further analyses on the AP-1 bound enhancers in which the SNP within the canonical AP-1 motif was predicted to disrupt AP-1 binding within one of the two strains using scores defined in (Risse et al., 1989) (n=1,322).
Identification of strain-specific AP-1 bound enhancers (Figure 3b)
Raw read counts of Fos and JunD ChIP-seq data were obtained within 500bp windows centered at the summits of the union of Fos ChIP-seq peaks from both strains. Strain-specific Fos peaks were defined as those with significantly higher Fos and JunD signal in one strain over another with FDR<1×10⁻⁶ by both DESeq2 and edgeR (blocking for the AP-1 TF). These peaks were intersected with distal 1 kb windows centered at the union of ATAC-seq peaks from both strains, followed by the union of H3K4me1 peaks from both strains, to obtain a set of strain-specific AP-1 bound enhancers (n=434). ATAC, H3K4me1, and H3K27ac signal was assessed at the subset of these that did not overlap a Fos peak in the unselected strain (n=362, Figures 3c–e).
Identification of strain-specific selected AP-1 bound enhancers (n=119, Figure 3F)
The subset of the 362 strain-specific AP-1 bound enhancers defined above that have both significantly strain-specific ATAC and H3K4me1 signal and do not have an ATAC peak in the unselected strain were taken to be strain-specific selected AP-1 bound enhancers.
Analysis of SWI/SNF recruitment by AP-1 TFs
Identification of inducible Smarca4 peaks (n=3,062, Figure 7b)
Raw read counts of Smarca4 ChIP-seq data were obtained within 500bp windows centered at Smarca4 peak summits.
Inducible Smarca4 peaks were identified by performing tests for windows with differential Smarca4 signal in 90m stimulated MEFs vs. unstimulated MEFs. Windows with significant increase in Smarca4 signal with FDR<1×10⁻⁴ by both DESeq2 and edgeR were obtained.
Correlation between AP-1 binding across the genome and inducible Smarca4 binding (Figure 7d)
Summits of ATAC-Seq peaks (merged across 0, 10, and 90m) from C57Bl/6J MEFs were obtained. Raw read counts were obtained within 1kb (H3K27ac) or 500bp (Smarca4) windows centered around these summits with HOMER and normalized by DESeq2. Distal 1kb ATAC windows (at least +/− 1kb away from an annotated TSS) were ranked in decreasing order based on the H3K27ac signal at 90m, and binned into deciles of 4,123–4,124 enhancers per bin. Enhancers were also intersected with AP-1 peaks and annotated as bound or unbound by AP-1.
Identification of Smarca4 peaks bound by AP-1 at active enhancers (Figure 7e)
Smarca4 peaks were intersected with Fos peaks in C57Bl/6J and/or SPRET that contain a single AP-1 motif (n=18,415 from Figure 3a) to obtain the set of Smarca4 peaks that were bound by Fos in either strain. The subset of these peaks that overlapped an H3K27ac peak (merged across 0 and 90m) in either strain was considered to be at active enhancers (left column), while the rest were considered to be not at active enhancers (right column). Within each subset, the shared, B6-specific, and SPRET-specific group assignments reflect whether the Fos ChIP-seq signal is significantly strain-specific (FDR<1×10⁻⁶ by both DESeq2 and edgeR).
Identification of all active enhancers with no AP-1 (n=2,079, Figure 7f, second column)
1kb windows centered on summits of ATAC-Seq peaks (merged across 0, 10, and 90m) from C57Bl/6J MEFs were intersected with H3K27ac peaks (merged across 0, 10, and 90m). The gene-distal subset (at least +/− 1kb away from an annotated TSS) of these sites was obtained and AP-1 peaks at 0 or 90m were removed.
Identification of inducible Smarca4 peaks with inducible AP-1 not at active enhancers (n=81, Figure 7f, last column)
Raw read counts of Fos, Fos12, Jun, and JunD ChIP-seq data were obtained within 500bp windows centered at the summits of consensus AP-1 peaks and used as the input into differential testing by both DESeq2 and edgeR. Inducible AP-1 peaks were identified by performing differential tests for windows with differential AP-1 signal in 90m stimulated MEFs vs. unstimulated MEFs, using the ChIP antibody as a blocking factor. Windows with significant increase in AP-1 signal with FDR<1×10⁻⁴ by both DESeq2 and edgeR were obtained. These sites were intersected with the inducible Smarca4 peaks identified above and peaks that overlapped with H3K27ac peaks (merged across 0, 10, and 90m) were removed.
Competitive enhancer set enrichment testing
The CAMERA function in edgeR (Wu and Smyth, 2012)24 was used to test whether specific groups of enhancers (i.e. LRG enhancers bound by AP-1 or all active enhancers not bound by AP-1) are significantly more perturbed than are other enhancers in the genome in Smarca4−/− compared to wild-type MEFs or Smarcb1−/− MEFs compared to wild-type MEFs.
DATA AND SOFTWARE AVAILABILITY
The ChIP-seq and RNA-seq data generated for this study have been deposited onto GEO under accession number GSE83295. For Figure 5, ChIP-seq data from GEO accession numbers GSE38377, GSE67443, GSE82015, and GSE86367 were used. For Supplementary Figure 5, ChIP-seq data from GEO accession number GSE71509 were used.
Supplementary Material
Spearman’s rank correlation coefficients (rho) between biological replicates for each set of ChIP-seq or ATAC-Seq data. Ranks are based on raw read counts within 1kb windows centered on ATAC peaks.
Summary of proteins enriched in Fos-EGFP IP-MS experiments over control IP-MS experiments, sorted by their Fold Change-B (FOSEGFP_FC_B) score in decreasing order. Columns to the right of the Fold Change scores display spectral counts of proteins in each experiment.
Acknowledgments
We would like to thank members of the Greenberg lab for their scientific advice, technical assistance, and helpful discussions throughout all phases of the project. Drs. Shannan Ho Sui, John Hutchinson, Meeta Mistry, and Rory Kirchner at the Harvard School of Public Health Bioinformatics Core and Dr. Rebecca Betensky at the Harvard School of Public Health Biostatistics Program for advice on data analysis. Dr. Athar N. Malik for assistance with acquisition of transgenic animals. Dr. Pieter Bas Kwak for advice and assistance with gel filtration chromatography. This work was funded by the US National Institutes of Health (NIH projects 5R01NS048276-10 and 5R37NS028829-26 to M.E.G.). T.V. is a Howard Hughes Medical Institute fellow of the Damon Runyon Cancer Research Foundation (DRG-2177-14). E.L. was supported by the National Science Foundation Graduate Research Fellowship under grant numbers DGE0946799 and DGE1144152. The content of this study is solely the responsibility of the authors and does not necessarily represent the official views of the funding sources mentioned.
Footnotes
Author Contributions
Conceptualization: T.V., E.L., and M.E.G. Methodology: T.V., E.L., and M.E.G. Investigation: T.V., E.L., and C.J.C. with technical assistance from C.H.C. Formal Analysis: E.L. and T.V. with assistance from D.A.H. Resources: X.W. and C.W.M.R. Writing – Original Draft: T.V., E.L., and M.E.G. Writing – Review & Editing: T.V., E.L., and M.E.G. Supervision: M.E.G. Funding Acquisition: M.E.G.
Publisher's Disclaimer: This is a PDF file of an unedited manuscript that has been accepted for publication. As a service to our customers we are providing this early version of the manuscript. The manuscript will undergo copyediting, typesetting, and review of the resulting proof before it is published in its final citable form. Please note that during the production process errors may be discovered which could affect the content, and all legal disclaimers that apply to the journal pertain.
References
- Alver BH, Kim KH, Lu P, Wang X, Manchester HE, Wang W, Haswell JR, Park PJ, Roberts CW. The SWI/SNF chromatin remodelling complex is required for maintenance of lineage specific enhancers. Nature communications. 2017;8:14648. doi: 10.1038/ncomms14648. [DOI] [PMC free article] [PubMed] [Google Scholar]
- Bailey TL, Machanick P. Inferring direct DNA binding from ChIP-seq. Nucleic acids research. 2012;40:el28. doi: 10.1093/nar/gks433. [DOI] [PMC free article] [PubMed] [Google Scholar]
- Bevington SL, Cauchy P, Piper J, Bertrand E, Lalli N, Jarvis RC, Gilding LN, Ott S, Bonifer C, Cockerill PN. Inducible chromatin priming is associated with the establishment of immunological memory in T cells. The EMBO journal. 2016;35:515–535. doi: 10.15252/embj.201592534. [DOI] [PMC free article] [PubMed] [Google Scholar]
- Bhatt DM, Pandya-Jones A, Tong AJ, Barozzi I, Lissner MM, Natoli G, Black DL, Smale ST. Transcript dynamics of proinflammatory genes revealed by sequence analysis of subcellular RNA fractions. Cell. 2012;150:279–290. doi: 10.1016/j.cell.2012.05.043. [DOI] [PMC free article] [PubMed] [Google Scholar]
- Biddie SC, John S, Sabo PJ, Thurman RE, Johnson TA, Schiltz RL, Miranda TB, Sung MH, Trump S, Lightman SL, et al. Transcription factor AP1 potentiates chromatin accessibility and glucocorticoid receptor binding. Molecular cell. 2011;43:145–155. doi: 10.1016/j.molcel.2011.06.016. [DOI] [PMC free article] [PubMed] [Google Scholar]
- Bolger AM, Lohse M, Usadel B. Trimmomatic: a flexible trimmer for Illumina sequence data. Bioinformatics. 2014;30:2114–2120. doi: 10.1093/bioinformatics/btu170. [DOI] [PMC free article] [PubMed] [Google Scholar]
- Buecker C, Srinivasan R, Wu Z, Calo E, Acampora D, Faial T, Simeone A, Tan M, Swigut T, Wysocka J. Reorganization of enhancer patterns in transition from naive to primed pluripotency. Cell stem cell. 2014;14:838–853. doi: 10.1016/j.stem.2014.04.003. [DOI] [PMC free article] [PubMed] [Google Scholar]
- Buecker C, Wysocka J. Enhancers as information integration hubs in development: lessons from genomics. Trends in genetics: TIG. 2012;28:276–284. doi: 10.1016/j.tig.2012.02.008. [DOI] [PMC free article] [PubMed] [Google Scholar]
- Buenrostro JD, Giresi PG, Zaba LC, Chang HY, Greenleaf WJ. Transposition of native chromatin for fast and sensitive epigenomic profiling of open chromatin, DNA-binding proteins and nucleosome position. Nature methods. 2013;10:1213–1218. doi: 10.1038/nmeth.2688. [DOI] [PMC free article] [PubMed] [Google Scholar]
- Danecek P, Auton A, Abecasis G, Albers CA, Banks E, DePristo MA, Handsaker RE, Lunter G, Marth GT, Sherry ST, et al. The variant call format and VCFtools. Bioinformatics. 2011;27:2156–2158. doi: 10.1093/bioinformatics/btr330. [DOI] [PMC free article] [PubMed] [Google Scholar]
- Deciphering Developmental Disorders S. Prevalence and architecture of de novo mutations in developmental disorders. Nature. 2017;542:433–438. doi: 10.1038/nature21062. [DOI] [PMC free article] [PubMed] [Google Scholar]
- Eferl R, Wagner EF. AP-1: a double-edged sword in tumorigenesis. Nature reviews Cancer. 2003;3:859–868. doi: 10.1038/nrc1209. [DOI] [PubMed] [Google Scholar]
- Fleischmann A, Hvalby O, Jensen V, Strekalova T, Zacher C, Layer LE, Kvello A, Reschke M, Spanagel R, Sprengel R, et al. Impaired long-term memory and NR2A-type NMDA receptor-dependent synaptic plasticity in mice lacking c-Fos in the CNS. The Journal of neuroscience: the official journal of the Society for Neuroscience. 2003;23:9116–9122. doi: 10.1523/JNEUROSCI.23-27-09116.2003. [DOI] [PMC free article] [PubMed] [Google Scholar]
- Fryer CJ, Archer TK. Chromatin remodelling by the glucocorticoid receptor requires the BRG1 complex. Nature. 1998;393:88–91. doi: 10.1038/30032. [DOI] [PubMed] [Google Scholar]
- Galbraith MD, Espinosa JM. Lessons on transcriptional control from the serum response network. Current opinion in genetics & developmental. 2011;21:160–166. doi: 10.1016/j.gde.2011.01.011. [DOI] [PMC free article] [PubMed] [Google Scholar]
- Gray JM, Harmin DA, Boswell SA, Cloonan N, Mullen TE, Ling JJ, Miller N, Kuersten S, Ma YC, McCarroll SA, et al. SnapShot-Seq: a method for extracting genome-wide, in vivo mRNA dynamics from a single total RNA sample. PloS one. 2014;9:e89673. doi: 10.1371/journal.pone.0089673. [DOI] [PMC free article] [PubMed] [Google Scholar]
- Greenberg ME, Hermanowski AL, Ziff EB. Effect of protein synthesis inhibitors on growth factor activation of c-fos, c-myc, and actin gene transcription. Molecular and cellular biology. 1986;6:1050–1057. doi: 10.1128/mcb.6.4.1050. [DOI] [PMC free article] [PubMed] [Google Scholar]
- Gurtner GC, Werner S, Barrandon Y, Longaker MT. Wound repair and regeneration. Nature. 2008;453:314–321. doi: 10.1038/nature07039. [DOI] [PubMed] [Google Scholar]
- He X, Chatterjee R, John S, Bravo H, Sathyanarayana BK, Biddie SC, FitzGerald PC, Stamatoyannopoulos JA, Hager GL, Vinson C. Contribution of nucleosome binding preferences and co-occurring DNA sequences to transcription factor binding. BMC genomics. 2013;14:428. doi: 10.1186/1471-2164-14-428. [DOI] [PMC free article] [PubMed] [Google Scholar]
- Heinz S, Benner C, Spann N, Bertolino E, Lin YC, Laslo P, Cheng JX, Murre C, Singh H, Glass CK. Simple combinations of lineage-determining transcription factors prime cis-regulatory elements required for macrophage and B cell identities. Molecular cell. 2010;38:576–589. doi: 10.1016/j.molcel.2010.05.004. [DOI] [PMC free article] [PubMed] [Google Scholar]
- Heinz S, Romanoski CE, Benner C, Allison KA, Kaikkonen MU, Orozco LD, Glass CK. Effect of natural genetic variation on enhancer selection and function. Nature. 2013;503:487–492. doi: 10.1038/nature12615. [DOI] [PMC free article] [PubMed] [Google Scholar]
- Heinz S, Romanoski CE, Benner C, Glass CK. The selection and function of cell type-specific enhancers. Nature reviews Molecular cell biology. 2015;16:144–154. doi: 10.1038/nrm3949. [DOI] [PMC free article] [PubMed] [Google Scholar]
- Hogan NT, Whalen MB, Stolze LK, Hadeli NK, Lam MT, Springstead JR, Glass CK, Romanoski CE. Transcriptional networks specifying homeostatic and inflammatory programs of gene expression in human aortic endothelial cells. eLife. 2017:6. doi: 10.7554/eLife.22536. [DOI] [PMC free article] [PubMed] [Google Scholar]
- Ito T, Yamauchi M, Nishina M, Yamamichi N, Mizutani T, Ui M, Murakami M, Iba H. Identification of SWI.SNF complex subunit BAF60a as a determinant of the transactivation potential of Fos/Jun dimers. The Journal of biological chemistry. 2001;276:2852–2857. doi: 10.1074/jbc.M009633200. [DOI] [PubMed] [Google Scholar]
- Iwafuchi-Doi M, Zaret KS. Cell fate control by pioneer transcription factors. Developments. 2016;143:1833–1837. doi: 10.1242/dev.133900. [DOI] [PMC free article] [PubMed] [Google Scholar]
- Iyer VR, Eisen MB, Ross DT, Schuler G, Moore T, Lee JC, Trent JM, Staudt LM, Hudson J, Jr, Boguski MS, et al. The transcriptional program in the response of human fibroblasts to serum. Science. 1999;283:83–87. doi: 10.1126/science.283.5398.83. [DOI] [PubMed] [Google Scholar]
- Kadoch C, Crabtree GR. Mammalian SWI/SNF chromatin remodeling complexes and cancer: Mechanistic insights gained from human genomics. Science advances. 2015;1:e1500447. doi: 10.1126/sciadv.1500447. [DOI] [PMC free article] [PubMed] [Google Scholar]
- Keane TM, Goodstadt L, Danecek P, White MA, Wong K, Yalcin B, Heger A, Agam A, Slater G, Goodson M, et al. Mouse genomic variation and its effect on phenotypes and gene regulation. Nature. 2011;477:289–294. doi: 10.1038/nature10413. [DOI] [PMC free article] [PubMed] [Google Scholar]
- Kenner L, Hoebertz A, Beil FT, Keon N, Karreth F, Eferl R, Scheuch H, Szremska A, Amling M, Schorpp-Kistner M, et al. Mice lacking JunB are osteopenic due to cell-autonomous osteoblast and osteoclast defects. The Journal of cell biology. 2004;164:613–623. doi: 10.1083/jcb.200308155. [DOI] [PMC free article] [PubMed] [Google Scholar]
- Kharchenko PV, Tolstorukov MY, Park PJ. Design and analysis of ChIP-seq experiments for DNA-binding proteins. Nature biotechnology. 2008;26:1351–1359. doi: 10.1038/nbt.1508. [DOI] [PMC free article] [PubMed] [Google Scholar]
- Kovary K, Bravo R. Existence of different Fos/Jun complexes during the G0-to-G1 transition and during exponential growth in mouse fibroblasts: differential role of Fos proteins. Molecular and cellular biology. 1992;12:5015–5023. doi: 10.1128/mcb.12.11.5015. [DOI] [PMC free article] [PubMed] [Google Scholar]
- Langmead B, Trapnell C, Pop M, Salzberg SL. Ultrafast and memory-efficient alignment of short DNA sequences to the human genome. Genome biology. 2009;10:R25. doi: 10.1186/gb-2009-10-3-r25. [DOI] [PMC free article] [PubMed] [Google Scholar]
- Law CW, Chen Y, Shi W, Smyth GK. voom: Precision weights unlock linear model analysis tools for RNA-seq read counts. Genome biology. 2014;15:R29. doi: 10.1186/gb-2014-15-2-r29. [DOI] [PMC free article] [PubMed] [Google Scholar]
- Long HK, Prescott SL, Wysocka J. Ever-Changing Landscapes: Transcriptional Enhancers in Development and Evolution. Cell. 2016;167:1170–1187. doi: 10.1016/j.cell.2016.09.018. [DOI] [PMC free article] [PubMed] [Google Scholar]
- Love MI, Huber W, Anders S. Moderated estimation of fold change and dispersion for RNA-seq data with DESeq2. Genome biology. 2014;15:550. doi: 10.1186/s13059-014-0550-8. [DOI] [PMC free article] [PubMed] [Google Scholar]
- Malik AN, Vierbuchen T, Hemberg M, Rubin AA, Ling E, Couch CH, Stroud H, Spiegel I, Farh KK, Harmin DA, et al. Genome-wide identification and characterization of functional neuronal activity-dependent enhancers. Nature neuroscience. 2014;17:1330–1339. doi: 10.1038/nn.3808. [DOI] [PMC free article] [PubMed] [Google Scholar]
- Mathelier A, Fornes O, Arenillas DJ, Chen CY, Denay G, Lee J, Shi W, Shyr C, Tan G, Worsley-Hunt R, et al. JASPAR 2016: a major expansion and update of the open-access database of transcription factor binding profiles. Nucleic acids research. 2016;44:D110–115. doi: 10.1093/nar/gkv1176. [DOI] [PMC free article] [PubMed] [Google Scholar]
- Maurano MT, Haugen E, Sandstrom R, Vierstra J, Shafer A, Kaul R, Stamatoyannopoulos JA. Large-scale identification of sequence variants influencing human transcription factor occupancy in vivo. Nature genetics. 2015;47:1393–1401. doi: 10.1038/ng.3432. [DOI] [PMC free article] [PubMed] [Google Scholar]
- Mellacheruvu D, Wright Z, Couzens AL, Lambert JP, St-Denis NA, Li T, Miteva YV, Hauri S, Sardiu ME, Low TY, et al. The CRAPome: a contaminant repository for affinity purification-mass spectrometry data. Nature methods. 2013;10:730–736. doi: 10.1038/nmeth.2557. [DOI] [PMC free article] [PubMed] [Google Scholar]
- Miller JA, Widom J. Collaborative competition mechanism for gene activation in vivo. Molecular and cellular biology. 2003;23:1623–1632. doi: 10.1128/MCB.23.5.1623-1632.2003. [DOI] [PMC free article] [PubMed] [Google Scholar]
- Moyle-Heyrman G, Tims HS, Widom J. Structural constraints in collaborative competition of transcription factors against the nucleosome. Journal of molecular biology. 2011;412:634–646. doi: 10.1016/j.jmb.2011.07.032. [DOI] [PMC free article] [PubMed] [Google Scholar]
- Mullen AC, Orlando DA, Newman JJ, Loven J, Kumar RM, Bilodeau S, Reddy J, Guenther MG, DeKoter RP, Young RA. Master transcription factors determine cell-type-specific responses to TGF-beta signaling. Cell. 2011;147:565–576. doi: 10.1016/j.cell.2011.08.050. [DOI] [PMC free article] [PubMed] [Google Scholar]
- Ng KW, Ridgway P, Cohen DR, Tremethick DJ. The binding of a Fos/Jun heterodimer can completely disrupt the structure of a nucleosome. The EMBO journal. 1997;16:2072–2085. doi: 10.1093/emboj/16.8.2072. [DOI] [PMC free article] [PubMed] [Google Scholar]
- Ostuni R, Piccolo V, Barozzi I, Polletti S, Termanini A, Bonifacio S, Curina A, Prosperini E, Ghisletti S, Natoli G. Latent enhancers activated by stimulation in differentiated cells. Cein. 2013;152:157–171. doi: 10.1016/j.cell.2012.12.018. [DOI] [PubMed] [Google Scholar]
- Quinlan AR, Hall IM. BEDTools: a flexible suite of utilities for comparing genomic features. Bioinformatics. 2010;26:841–842. doi: 10.1093/bioinformatics/btq033. [DOI] [PMC free article] [PubMed] [Google Scholar]
- Rada-Iglesias A, Bajpai R, Swigut T, Brugmann SA, Flynn RA, Wysocka J. A unique chromatin signature uncovers early developmental enhancers in humans. Nature. 2011;470:279–283. doi: 10.1038/nature09692. [DOI] [PMC free article] [PubMed] [Google Scholar]
- Risse G, Jooss K, Neuberg M, Bruller HJ, Muller R. Asymmetrical recognition of the palindromic AP1 binding site (TRE) by Fos protein complexes. The EMBO journal. 1989;8:3825–3832. doi: 10.1002/j.1460-2075.1989.tb08560.x. [DOI] [PMC free article] [PubMed] [Google Scholar]
- Roadmap Epigenomics C. Kundaje A, Meuleman W, Ernst J, Bilenky M, Yen A, Heravi-Moussavi A, Kheradpour P, Zhang Z, Wang J, et al. Integrative analysis of 111 reference human epigenomes. Nature. 2015;518:317–330. doi: 10.1038/nature14248. [DOI] [PMC free article] [PubMed] [Google Scholar]
- Robinson MD, McCarthy DJ, Smyth GK. edgeR: a Bioconductor package for differential expression analysis of digital gene expression data. Bioinformatics. 2010;26:139–140. doi: 10.1093/bioinformatics/btp616. [DOI] [PMC free article] [PubMed] [Google Scholar]
- Ronan JL, Wu W, Crabtree GR. From neural development to cognition: unexpected roles for chromatin. Nature reviews Genetics. 2013;14:347–359. doi: 10.1038/nrg3413. [DOI] [PMC free article] [PubMed] [Google Scholar]
- Shi J, Whyte WA, Zepeda-Mendoza CJ, Milazzo JP, Shen C, Roe JS, Minder JL, Mercan F, Wang E, Eckersley-Maslin MA, et al. Role of SWI/SNF in acute leukemia maintenance and enhancer-mediated Myc regulation. Genes & development. 2013;27:2648–2662. doi: 10.1101/gad.232710.113. [DOI] [PMC free article] [PubMed] [Google Scholar]
- Simanshu DK, Nissley DV, McCormick F. RAS Proteins and Their Regulators in Human Disease. Cell. 2017;170:17–33. doi: 10.1016/j.cell.2017.06.009. [DOI] [PMC free article] [PubMed] [Google Scholar]
- Su Y, Shin J, Zhong C, Wang S, Roychowdhury P, Lim J, Kim D, Ming GL, Song H. Neuronal activity modifies the chromatin accessibility landscape in the adult brain. Nature neuroscience. 2017;20:476–483. doi: 10.1038/nn.4494. [DOI] [PMC free article] [PubMed] [Google Scholar]
- Swinstead EE, Miranda TB, Paakinaho V, Baek S, Goldstein I, Hawkins M, Karpova TS, Ball D, Mazza D, Lavis LD, et al. Steroid Receptors Reprogram FoxA1 Occupancy through Dynamic Chromatin Transitions. Cell. 2016a;165:593–605. doi: 10.1016/j.cell.2016.02.067. [DOI] [PMC free article] [PubMed] [Google Scholar]
- Swinstead EE, Paakinaho V, Presman DM, Hager GL. Pioneer factors and ATP-dependent chromatin remodeling factors interact dynamically: A new perspective: Multiple transcription factors can effect chromatin pioneer functions through dynamic interactions with ATP-dependent chromatin remodeling factors. BioEssays: news and reviews in molecular, cellular and developmental biology. 2016b;38:1150–1157. doi: 10.1002/bies.201600137. [DOI] [PMC free article] [PubMed] [Google Scholar]
- Tillo D, Kaplan N, Moore IK, Fondufe-Mittendorf Y, Gossett AJ, Field Y, Lieb JD, Widom J, Segal E, Hughes TR. High nucleosome occupancy is encoded at human regulatory sequences. PloS one. 2010;5:e9129. doi: 10.1371/journal.pone.0009129. [DOI] [PMC free article] [PubMed] [Google Scholar]
- Trompouki E, Bowman TV, Lawton LN, Fan ZP, Wu DC, DiBiase A, Martin CS, Cech JN, Sessa AK, Leblanc JL, et al. Lineage regulators direct BMP and Wnt pathways to cell-specific programs during differentiation and regeneration. Cell. 2011;147:577–589. doi: 10.1016/j.cell.2011.09.044. [DOI] [PMC free article] [PubMed] [Google Scholar]
- Vahedi G, Takahashi H, Nakayamada S, Sun HW, Sartorelli V, Kanno Y, O’Shea JJ. STATs shape the active enhancer landscape of T cell populations. Cell. 2012;151:981–993. doi: 10.1016/j.cell.2012.09.044. [DOI] [PMC free article] [PubMed] [Google Scholar]
- van de Geijn B, McVicker G, Gilad Y, Pritchard JK. WASP: allele-specific software for robust molecular quantitative trait locus discovery. Nature methods. 2015;12:1061–1063. doi: 10.1038/nmeth.3582. [DOI] [PMC free article] [PubMed] [Google Scholar]
- Wang X, Lee RS, Alver BH, Haswell JR, Wang S, Mieczkowski J, Drier Y, Gillespie SM, Archer TC, Wu JN, et al. SMARCB1-mediated SWI/SNF complex function is essential for enhancer regulation. Nature genetics. 2017;49:289–295. doi: 10.1038/ng.3746. [DOI] [PMC free article] [PubMed] [Google Scholar]
- Wingender E, Schoeps T, Haubrock M, Donitz J. TFClass: a classification of human transcription factors and their rodent orthologs. Nucleic acids research. 2015;43:D97–102. doi: 10.1093/nar/gku1064. [DOI] [PMC free article] [PubMed] [Google Scholar]
- Wu D, Smyth GK. Camera: a competitive gene set test accounting for inter-gene correlation. Nucleic acids research. 2012;40:el33. doi: 10.1093/nar/gks461. [DOI] [PMC free article] [PubMed] [Google Scholar]
- Wu JI, Lessard J, Olave IA, Qiu Z, Ghosh A, Graef IA, Crabtree GR. Regulation of dendritic development by neuron-specific chromatin remodeling complexes. Neuron. 2007;56:94–108. doi: 10.1016/j.neuron.2007.08.021. [DOI] [PubMed] [Google Scholar]
- Zaret KS, Carroll JS. Pioneer transcription factors: establishing competence for gene expression. Genes & development. 2011;25:2227–2241. doi: 10.1101/gad.176826.111. [DOI] [PMC free article] [PubMed] [Google Scholar]
- Zhang B, Day DS, Ho JW, Song L, Cao J, Christodoulou D, Seidman JG, Crawford GE, Park PJ, Pu WT. A dynamic H3K27ac signature identifies VEGFA-stimulated endothelial enhancers and requires EP300 activity. Genome research. 2013;23:917–927. doi: 10.1101/gr.149674.112. [DOI] [PMC free article] [PubMed] [Google Scholar]
- Zhang Y, Liu T, Meyer CA, Eeckhoute J, Johnson DS, Bernstein BE, Nusbaum C, Myers RM, Brown M, Li W, et al. Model-based analysis of ChIP-Seq (MACS) Genome biology. 2008;9:R137. doi: 10.1186/gb-2008-9-9-r137. [DOI] [PMC free article] [PubMed] [Google Scholar]
Associated Data
This section collects any data citations, data availability statements, or supplementary materials included in this article.
Supplementary Materials
Spearman’s rank correlation coefficients (rho) between biological replicates for each set of ChIP-seq or ATAC-Seq data. Ranks are based on raw read counts within 1kb windows centered on ATAC peaks.
Summary of proteins enriched in Fos-EGFP IP-MS experiments over control IP-MS experiments, sorted by their Fold Change-B (FOSEGFP_FC_B) score in decreasing order. Columns to the right of the Fold Change scores display spectral counts of proteins in each experiment.