

Abstract
Objective
Neuroimaging and other biomarker assays suggest that the pathological processes of Alzheimer’s disease (AD) initiate years prior to clinical dementia onset. However some 30%–50% of older individuals that harbor AD pathology do not become symptomatic in their lifetime. It is hypothesized that such individuals exhibit cognitive resilience that protects against AD dementia. We hypothesized that in cases with AD pathology structural changes in dendritic spines would distinguish individuals that had or did not have clinical dementia.
Methods
We compared dendritic spines within layers II and III pyramidal neuron dendrites in Brodmann Area 46 dorsolateral prefrontal cortex using the Golgi-Cox technique in 12 age-matched pathology-free controls, 8 controls with AD pathology (CAD), and 21 AD cases. We used highly optimized methods to trace impregnated dendrites from brightfield microscopy images which enabled accurate three-dimensional digital reconstruction of dendritic structure for morphologic analyses.
Results
Spine density was similar among control and CAD cases but reduced significantly in AD. Thin and mushroom spines were reduced significantly in AD compared to CAD brains, whereas stubby spine density was decreased significantly in CAD and AD compared to controls. Increased spine extent distinguished CAD cases from controls and AD. Linear regression analysis of all cases indicated that spine density was not associated with neuritic plaque score but did display negative correlation with Braak staging.
Interpretation
These observations provide cellular evidence to support the hypothesis that dendritic spine plasticity is a mechanism of cognitive resilience that protects older individuals with AD pathology from developing dementia.
INTRODUCTION
Alzheimer’s disease (AD) is the most common cause of dementia in older individuals and a leading cause of death in the developed world. Recent advances in neuroimaging and other biomarker assays that provide the means to detect AD pathophysiology in vivo suggest that the pathological processes of AD initiate years to decades prior to clinical dementia onset1. However some 30%–50% of older individuals that harbor AD pathology do not become symptomatic in their lifetime2.
Large-scale epidemiological studies provide evidence for cognitive resilience to AD pathology, including the Religious Orders Study and the companion Rush Memory and Aging Project. These studies showed that a third of individuals in their eighties are cognitively normal despite levels of β-amyloid (Aβ) plaques and neurofibrillary tangles (NFT) that meet NIA-Reagan criteria for intermediate to high likelihood of AD3. Additionally, the Baltimore Longitudinal Study of Aging, Honolulu-Asia Aging Study, the 90+ Study, and the Medical Research Council Cognitive Function and Ageing Study reported similar disconnect among Aβ plaques, NFTs and cognition4–7. Dating to the work of Ramon y Cajal, it is hypothesized that the brain is capable of protective structural plasticity in the face of aging and disease, a proposed mechanism contributing to cognitive resilience8. However studies providing neurobiological evidence of this in patients with AD pathology are limited.
Cognitively normal individuals with AD pathology are proposed to represent individuals who are resilient to dementia or in preclinical stages of AD2. This cohort allows exploration of mechanisms that are 1) critical for retaining cognitive function in the face of AD pathology (i.e. cognitive resilience) or 2) involved in the transition from preclinical to symptomatic AD. Neuronal synapse loss correlates more strongly with cognitive impairment than classical pathologic markers of AD9, 10, yet whether synapse loss is progressive or synaptic remodeling contributes to cognitive resilience to protect individuals with AD pathophysiology is not known11, 12. Excitatory synapses occur on actin-rich dendritic protrusions called dendritic spines, and synapse strength and activity is inseparably linked to spine morphology13. We hypothesized that in cases with AD pathology structural changes in dendritic spines would distinguish individuals that had or did not have clinical dementia. To test this hypothesis, we used highly optimized three-dimensional modeling of dendritic spines to analyze prefrontal cortex synapse populations from controls, cognitively normal individuals with high AD pathology (CAD), and AD dementia cases.
MATERIALS AND METHODS
Human Brain Tissue
Samples of frontal cortex derived from subjects exhibiting a range of AD pathology were examined. Tissue samples were collected at the Emory University Alzheimer’s Disease Research Center (ADRC). The case diagnosis is based on Mini Mental State Examination (MMSE), Consortium to Establish a Registry for Alzheimer’s disease (CERAD) criteria for the neuropathologic diagnosis of AD, and Braak Staging of neurofibrillary pathology. Cases were categorized into three diagnostic groups which included 1) 12 cognitively normal controls without AD pathology, 2) 8 cognitively normal control subjects showing moderate to severe AD pathology at autopsy, and 3) 21 definite AD cases with severe pathology1, 2. The three groups were matched as closely as possible for age, sex, and postmortem interval. It is important to note that the majority of these cases had no co-existing pathologies, such as stroke or Lewy body disease. Although multiple neuropsychological tests were employed in the cognitive testing of these subjects, the MMSE is the most commonly used test for complaints of memory problems or when a diagnosis of dementia is being considered, and those results are presented in Table 1. Severe to moderate AD patients have MMSE scores of 10–20 out of total possible of 30; at the end stages of disease, impairment is so severe as to prevent testing. Clinical Dementia Rating (CDR) was conducted on three cases14, 15. CDR scores the severity of symptoms of dementia using a composite range of 0–3, where 0 indicates no symptoms of dementia and 3 marks severe impairment. Pathology data on cases is presented in Table 2. Neuritic and diffuse plaques were scored semi-quantitatively according to CERAD methods16. CERAD (0→3 or none, sparse, moderate, frequent) and Braak (0→6) scores are measures for the severity of neuritic plaque and neurofibrillary tangle accumulation, respectively. The Amyloid Braak CERAD (ABC) score was used as a global measure of AD pathology17.
TABLE 1.
Clinical data on postmortem human brain tissue samples.
| Cases | Race/Sex | PMI (h) | Age at Onset | Age at Death | ApoE | MMSE |
|---|---|---|---|---|---|---|
| Control (N =12) | ||||||
| 1 | WF | 3 | 52 | E3/4 | ||
| 2 | AM | 6 | 59 | E2/3 | ||
| 3 | WM | 5.5 | 94 | E3/3 | 29 | |
| 4 | WF | 6 | 91 | E3/3 | 29 | |
| 5 | WM | 12.5 | 56 | |||
| 6 | AF | 6 | 61 | |||
| 7 | WF | 6 | 75 | E3/3 | 29 | |
| 8 | AM | <12 | 61 | E3/4 | CDR = 0 | |
| 9 | WF | 11.5 | 78 | E3/3 | 30 | |
| 10 | WF | 15.5 | 92 | E3/3 | ||
| 11 | WF | 14.5 | 88 | E2/3 | 26 | |
| 12 | AM | 2.5 | 70 | E3/3 | 29 | |
| CAD (N = 8) | ||||||
| 1 | WM | 35.5 | 76 | E2/4 | 29 | |
| 2 | WM | 20 | 81 | E3/3 | 27 | |
| 3 | WF | 17 | 64 | E4/4 | 30 | |
| 4 | WF | 38 | 82 | E3/4 | 30 | |
| 5 | WM | 19 | 89 | E3/3 | 27 | |
| 6 | WM | 5.5 | 80 | E3/4 | 28 | |
| 7 | WM | 20.5 | 87 | E3/4 | 27 | |
| 8 | WF | 5 | 87 | E2/3 | ||
| AD (N = 21) | ||||||
| 1 | WM | 9 | 78 | 84 | E3/4 | 20 |
| 2 | WF | 15.5 | 93 | E3/4 | ||
| 3 | WM | 78 | 77 | E3/4 | 25 | |
| 4 | AF | 6 | 79 | 86 | E3/3 | 15 |
| 5 | WF | 4 | 76 | 94 | E3/4 | 19 |
| 6 | WM | 28 | 63 | 77 | E4/4 | CDR = 3 |
| 7 | WM | 40 | 85 | 94 | E3/4 | 18 |
| 8 | WM | 21 | 69 | 76 | E3/3 | 15 |
| 9 | WF | 5 | 76 | 88 | E3/4 | CDR = 3 |
| 10 | WM | 4 | 72 | 80 | E3/4 | 23 |
| 11 | AM | 7 | 70 | 86 | E4/4 | 12 |
| 12 | WM | 5.5 | 76 | 83 | E3/4 | 10 |
| 13 | WM | 9 | 56 | 64 | E3/4 | |
| 14 | WF | 7 | 59 | 72 | E3/4 | SI |
| 15 | WF | 5 | 93 | E3/4 | 6 | |
| 16 | WM | 4 | 74 | 85 | E3/4 | 13 |
| 17 | WM | 12 | 70 | 77 | E3/4 | SI |
| 18 | WM | 2.5 | 60 | 74 | E3/3 | 6 |
| 19 | WF | 2.5 | 70 | 91 | E3/4 | |
| 20 | WF | 9.5 | 85 | E4/4 | ||
| 21 | WF | 12 | 69 | 81 | E3/4 | 0 |
Twelve cognitively normal, age-equivalent, pathology-free controls were compared to 8 cognitively normal controls with Alzheimer’s disease (AD) pathology (CAD) and 21 sporadic AD cases. If values are blank, then information was not available. Age of onset is not applicable to controls or CAD cases. W, White/Caucasian; A, African American; F, Female; M, male; PMI, postmortem interval; MMSE, Mini Mental State Examination; SI, sight impairment; CDR, Clinical Dementia Rating.
TABLE 2.
Pathology data on postmortem human brain tissue samples.
| Cases | Frontal NP | Frontal DP | Frontal NFT | Braak Stage | CERAD Score | ABC Score |
|---|---|---|---|---|---|---|
| Control (N =12) | ||||||
| 1 | none | frequent | none | 0 | B | Low |
| 2 | none | none | none | I | 0 | None |
| 3 | none | none | none | II | 0 | None |
| 4 | sparse | frequent | none | III | A | Low |
| 5 | none | none | none | I | 0 | None |
| 6 | none | sparse | none | II | 0 | Low |
| 7 | none | none | none | I | 0 | None |
| 8 | none | moderate | none | II | 0 | Low |
| 9 | none | none | none | II | 0 | None |
| 10 | none | none | sparse | III | 0 | None |
| 11 | none | sparse | none | II | 0 | None |
| 12 | none | moderate | none | I | 0 | None |
| CAD (N = 8) | ||||||
| 1 | frequent | moderate | none | IV | C | Intermediate |
| 2 | sparse | moderate | none | II | B | Low |
| 3 | frequent | frequent | sparse | II | C | Low |
| 4 | frequent | frequent | none | III | C | Intermediate |
| 5 | frequent | frequent | none | IV | C | Intermediate |
| 6 | frequent | frequent | sparse | IV | C | Intermediate |
| 7 | moderate | none | sparse | I | B | Intermediate |
| 8 | frequent | frequent | sparse | III | C | Intermediate |
| AD (N = 21) | ||||||
| 1 | frequent | frequent | sparse | IV | C | Intermediate |
| 2 | frequent | frequent | none | III | C | Intermediate |
| 3 | frequent | frequent | none | III | C | Intermediate |
| 4 | frequent | moderate | none | II | C | Low |
| 5 | moderate | frequent | sparse | IV | C | Intermediate |
| 6 | frequent | frequent | frequent | VI | C | Intermediate |
| 7 | frequent | frequent | sparse | I | C | Low |
| 8 | frequent | moderate | sparse | IV | C | Intermediate |
| 9 | frequent | moderate | sparse | IV | C | Intermediate |
| 10 | frequent | frequent | sparse | IV | C | Intermediate |
| 11 | sparse | frequent | sparse | IV | C | Intermediate |
| 12 | frequent | sparse | frequent | V | C | High |
| 13 | frequent | none | frequent | V–VI | C | High |
| 14 | frequent | frequent | moderate | VI | C | High |
| 15 | frequent | moderate | frequent | VI | C | High |
| 16 | frequent | frequent | frequent | VI | C | High |
| 17 | frequent | frequent | frequent | VI | C | High |
| 18 | frequent | frequent | moderate | VI | C | High |
| 19 | frequent | frequent | frequent | VI | C | High |
| 20 | frequent | moderate | moderate | VI | C | High |
| 21 | frequent | none | frequent | VI | C | High |
Twelve cognitively normal, age-equivalent, pathology-free controls were compared to 8 cognitively normal controls with Alzheimer’s disease (AD) pathology (CAD) and 21 sporadic AD cases. NP, neuritic Aβ plaque; DP, diffuse Aβ plaque; CERAD, Consortium to Establish a Registry for Alzheimer’s disease; ABC, Amyloid Braak CERAD score.
Tissue Processing and Golgi-Cox Staining
All tissue samples were fixed in 4% paraformaldehyde immediately following dissection and stored in preservative solution containing sodium azide at 4°C. Tissue blocks of approximately 20 mm × 20 mm × 5 mm taken from the dorsolateral prefrontal cortex (Brodmann area 46) were sectioned into 250 μm slices (about 15 per block) using a Leica Vibratome (Leica VT1000s, Leica Biosystems Inc, Buffalo Grove IL) and stored in preservation buffer (0.1% wt/vol sodium azide in PBS) until Golgi-Cox impregnation. All tissues were stained using the FD Rapid Golgi Stain Kit (PK401, FD Neurotechnologies Inc, Columbia MD) and manufacturer’s instructions with the following modifications. Tissue slices were impregnated in chromation mixture of Solution A (potassium dichromate and mercuric chloride) and Solution B (potassium chromate). The chromation solution was replaced after the first 24 hours, and tissue was then left in chromation in the dark for 6 weeks. Next, tissue slices were immersed in Solution C for 48 hours, and this solution was replaced after 24 hours, according to manufacturer’s instructions. Tissues were then plated on 75 mm × 25 mm gelatin-coated slides (Cat. #PO101, FD Neurotechnologies Inc, Columbia MD) using additional Solution C and allowed to dry in the dark for two hours. Next, tissues were submerged sequentially in mixtures of Solution D, Solution E, and distilled water according to manufacturer’s instructions. After rinsing with distilled water, tissues were dehydrated with graded alcohols (70%, 90%, 100% ethanol in DI-water) and cleared with xylenes (X3P-1GAL, Fisher Scientific). Slides were sealed with Permount Toulene Solution (SP15-100, Fisher Chemicals, Fair Lawn NJ) and cover-slipped with spacers (Secure Seal Spacer, 20mm Diameter × 0.12mm Depth Cat.# 70327-205, Electron Microscopy Sciences, Hartfield, PA) and 50 mm × 24 mm glass (Cover Glass, Rectangles, 24 × 50 mm, Thickness 0.13–0.17 mm, Cat. # 633153, Carolina Biological, Burlington, NC). Slides were stored in darkness.
Dendrite Imaging
Layers II and III pyramidal neuron dendrites in Brodmann Area 46 dorsolateral prefrontal cortex were imaged. For each case, many tissue slices were Golgi-stained. From each tissue slice, two or more cells were imaged and analyzed. 10–20 Golgi-stained cells were sampled per case. From each cell, a single dendritic segment was imaged. The following criteria were used to select cells for imaging: 1) located centrally within the tissue sample depth; 2) not obscured by large staining debris; 3) and fully impregnated. If the cell met the criteria, a single dendritic length was imaged. Dendrite selection criteria: 1) unobstructed/isolated/not overlapping other dendrites; 2) length greater than 30 μm; 3) diameter approximately 1 μm. If more than two dendrites fulfilled the criteria from a single cell, the first dendrite clockwise was the only dendrite selected. If no dendrites from a cell fulfilled the criteria, another cell was viewed and scrutinized. All imaging was conducted by a single, blinded experimenter. Each tissue slice was initially viewed under low 4× magnification to establish the region of interest (layers II and III). Next, a pyramidal cell dendrite within the region of interest was viewed at 60× magnification to determine if the dendrite fulfilled the above criteria. A maximum of two pyramidal cells were imaged per tissue slice. Z-stacks were captured with a z-step size of 0.1μm. Each image was recorded using the following parameters: lamp DIA: 100; field stop: 1.5 mm; exposure: 60 ms; analog gain: 2.0× – 2.4x; image size: 1028 × 1028 (0.1619 μm × 0.1619 μm × 0.1 μm). Images were captured on a Nikon Eclipse Ni upright microscope with Lumen 200 light source and Nikon DS-43 Digital Sight for brightfield microscopy and Nikon Elements 4.20.02. A 60× oil immersion objective (Nikon Plan Apo, N.A. 1.40) was used.
Three-dimensional Digital Image Reconstruction
Dendrite and spine reconstructions were conducted by a single, blinded experimenter. Image stacks of neuronal dendrites were imported to Neurolucida 360 (2.70.1, MBF Biosciences, Williston, Vermont). Dendrites were traced using a semi-automated directional kernel algorithm. Spines were traced using voxel clustering. Initiation and termination points for dendrite reconstruction were established using the following criteria: must be ≥10 μm away from the distal tip of the dendrite; must contain consistent dendrite diameter; must have a level axis with limited movement in the z plane, and must be ≥ 30 μm in length. Next, the experimenter manually scrutinized each assigned point in the x, y, and z plane to verify the point was located on the dendrite or spine and not artificially assigned. Points were scrutinized first by viewing the dendrite at individual x–z or y–z planes and by ensuring that points were correctly positioned at midline of the dendrite. Afterwards, points were verified in the x–y plane, and the diameter of each point was confirmed to match the dendrite diameter. Dendritic spine reconstruction utilized the following parameters for classification: outer range: 7.0 μm; minimum height: 0.3 μm; detector sensitivity: 90–125; minimum count: 8 voxels. Dendritic spines were traced as the experimenter traversed the full dendrite z-plane and inspected the x–y plane at each individual z-step. The morphology of each reconstructed spine was carefully scrutinized by verifying that axial smear did not cause misrepresentation, and the merge and slice tools were used to correct inconsistencies. Spine backbone was used in recording spine extent and in spine classification. The positioning of each backbone point (including point of greatest breadth) was confirmed by the experimenter. To correct a misrepresentative backbone, the spine was viewed from the z-plane, and experimenter moved backbone points in x–y plane. Any re-positioning in the x–z or y–z plane was performed while the spine was being viewed from the lateral angle.
Morphometric analysis was conducted for each spine, and measurements categorized spines into thin, stubby, mushroom, and filopodia classes. Reconstructions were exported to Neurolucida Explorer (2.70.1, MBF Biosciences, Williston, Vermont) where data was collected for quantitative analysis. The dendritic spine measurement parameters included spine extent and spine head diameter, among others. These parameters were exported and collected in Microsoft Excel. Derived measurements, such as spine density per dendrite surface area, were calculated from raw measurement data. For spine classification, the following established parameters were used. Head-to-neck ratio: 1.1; Length-to-Head ratio: 2.5; Mushroom head size: 0.35 um; Filopodium length: 3.0 μm. Spines with a Head-to-neck ratio greater than 1.1 and Head diameter greater than 0.35 μm were classified as mushroom. Spines were classified as filopodia or thin, if head-to-neck ratio was less than 1.1, and either (1) length-to-head ratio was greater than 2.5 or (2) head size was less than 0.35 μm. Of these, if the total length was greater than 3.0 μm, the spine was classified as filopodia; if less than 3.0 μm, thin. Spine density was calculated by determining the number of spines per μm of dendrite length or the number of spines per μm2 of dendrite surface area. Spine extent was defined as the curvilinear backbone length from the insertion point to the most distal point of the spine head. Head diameter was defined as the breadth of the spine head at its widest, cross-sectional point. Both morphological measurements were confirmed by experimenter in backbone reconstruction.
Notably, our spine structure and density measurements are consistent with similar studies assessing dendritic spine density and morphology in human samples. Prior investigations using electron microscopy in aged neocortex exhibit strong similarities to our reported spine length and head diameter18–20. Additional studies measuring spine structure characteristics in human and non-human primates using confocal and light microscopy report spine measurements that are highly consistent with our findings21–24. In total, 5569 μm of dendrite length and 4297 spines were analyzed in this study. Approximately 118 spines per control case, 109 spines per CAD case, and 95 spines per AD case were analyzed.
Statistical Analysis
Statistical analyses were conducted with Graphpad Prism 6.0. Data are presented as mean ± SEM, and all graph error bars represent SEM. All statistical tests were two-tailed with threshold for statistical significance set at 0.05. To compare aggregate spine densities among conditions, the mean spine density per patient was calculated. These patient means were then averaged per condition and reported as a condition mean. Mean spine densities for each spine class were similarly accumulated. Statistical comparisons included unpaired t-test; one-way ANOVA with Tukey comparison’s test; two-way ANOVA with Tukey or Bonferroni multiple comparison’s test; linear regression analysis; and, two-sample Kolmogorov-Smirnov test. Possible co-variants were assessed for spine densities and morphology. Sex, age, and postmortem interval (PMI) were compared against the patient means for each parameter using two-way ANOVA, linear regression, or t-tests. For spine morphology, cumulative distributions of dendritic spine extent or head diameter are reported for each condition. The D’Agostino & Pearson omnibus normality test identified that these spine morphology parameters were not normally distributed, so non-parametric Kolmogorov-Smirnov tests were used. Two-sample Kolmogorov-Smirnov tests compared the frequency of spine morphology among spine populations between each pair of conditions25, 26. Additionally, one-way ANOVA with Tukey Post-hoc was performed to compare morphology among conditions.
RESULTS
Using the Golgi-Cox technique, we compared the density of dendritic spines within layers II and III pyramidal neuron dendrites of Brodmann Area 46 (BA46) dorsolateral prefrontal cortex (DLPFC) in controls, CAD and AD cases (Tables 1–2). BA46 was selected because it is a region tightly linked to cognitive performance, including working memory, and is highly vulnerable in AD27, 28. We developed and optimized a method to trace impregnated dendrites from brightfield microscopy images which enabled accurate three-dimensional digital reconstruction of dendritic structure (Fig. 1). Spine density, measured per dendrite length or dendrite surface area, was similar among control and CAD cases but reduced in AD (Fig. 2, A–D and Supplementary Tables 1–2). The mean ages of controls, CAD, and AD groups were not significantly different (Fig. 2E and Supplementary Table 2). Linear regression analysis indicated that spine density was independent of sex or postmortem interval and that spine density changes within disease states were not associated with age (Fig. 2, F–H and Supplementary Tables 2–3). However, collective analysis of all cases revealed that age was inversely proportional to spine density (F1,39=6.570, R2=0.1442, P=0.0143), which supports past findings in aging mammals29, 30 (Fig. 2I and Supplementary Table 3).
FIGURE 1.

Highly optimized three-dimensional modeling of dendritic spines in controls, CAD, and AD cases. (A, C, E) Representative brightfield images of Golgi-impregnated dendrites. Scale bars represent 5 μm. (B, D, F) Three-dimensional digital reconstructions of the same dendrites generated in Neurolucida360. (G) (Left to Right) Representative zoomed-in brightfield image of a single Golgi-impregnated spine in the XY plane. Three-dimensional digital reconstruction of the spine in the XY plane with a grey line representing the head diameter measurement. Clockwise rotation in XYZ dimensions with a grey line representing the spine extent measurement. Further rotation in XYZ with grey lines representing spine head diameter and extent.
FIGURE 2.

Comparison of dendritic spin density in controls, CAD, and AD cases. (A) Mean spine density per 10 μm was reduced significantly in AD compared to controls and CAD (One-way ANOVA: F2,38=10.31, P=0.0003; Tukey: controls P=0.0032, CAD P=0.0013). Each case is expressed as an individual data point, and each data point is an average of 10–20 dendrites. (B) Distribution of spine density measured per 10 μm of dendrite. Each dot represents the average spine density per 10 μm for each dendrite that was imaged. (C) Aggregate distribution of spine density measured by surface area of dendrite in control, CAD, and AD cases. Each dot represents the average spine density per surface area of dendrite for each individual case. Spine density measured per dendrite surface area is reduced in AD cases compared to controls (One-way ANOVA: P=0.0398, F2,38 = 3.515; Tukey: controls P=0.0725). Lines represent the mean ± SEM. (D) Distribution of spine density measured per surface area of dendrite in control, CAD, and AD cases. Each dot represents the average spine density per surface area of dendrite for each individual dendrite that was imaged. Case numbers refer to patients that are described in Table 1. (E) Mean age was similar among controls, CAD, and AD. (F) Average spine density per 10 μm of dendrite for each individual was graphed based on disease state and sex. (G) Linear regression analysis of spine density measured per 10 μm of dendrite across all cases with postmortem interval (PMI). Each dot represents the average spine density per 10 μm for each individual case. The density of spines per 10 μm of dendrite was plotted against the PMI for each individual. PMI represented in hours. (H) Linear regression analysis of spine density measured per 10 μm of dendrite in control, CAD, and AD cases with age. Each dot represents the average spine density per 10 μm for each individual case. The density of spines per 10 μm of dendrite was plotted against the age of each individual. Age represented in years. (I) Linear regression analysis of spine density measured per 10 μm of dendrite in all cases with age. Each dot represents the average spine density per 10 μm for each individual case. The density of spines per 10 μm of dendrite was plotted against the age of each individual. Age was inversely proportional to spine density (F1,39 =6.570, R2 = 0.1442, P=0.0143). Dashed lines represent 95% confidence intervals.
The amyloid hypothesis of AD posits that increased soluble and insoluble Aβ levels induce a cascade of processes that manifest in NFT formation and synaptic loss, resulting in clinical dementia31. Linear regression analysis of all cases indicated that, irrespective of disease state, spine density was not associated with Aβ plaque severity (neuritic or diffuse plaque scores) but did display negative correlation with the degree of NFT distribution (F1,39=6.495, R2=0.1428, P=0.0149) and Braak staging (F1,37=22.65, R2=0.4754, P<0.0001) (Fig. 3, A–D and Supplementary Table 3). Notably, among AD cases there was no correlation with spine density and Braak staging (Fig. 3E and Supplementary Table 3).
FIGURE 3.
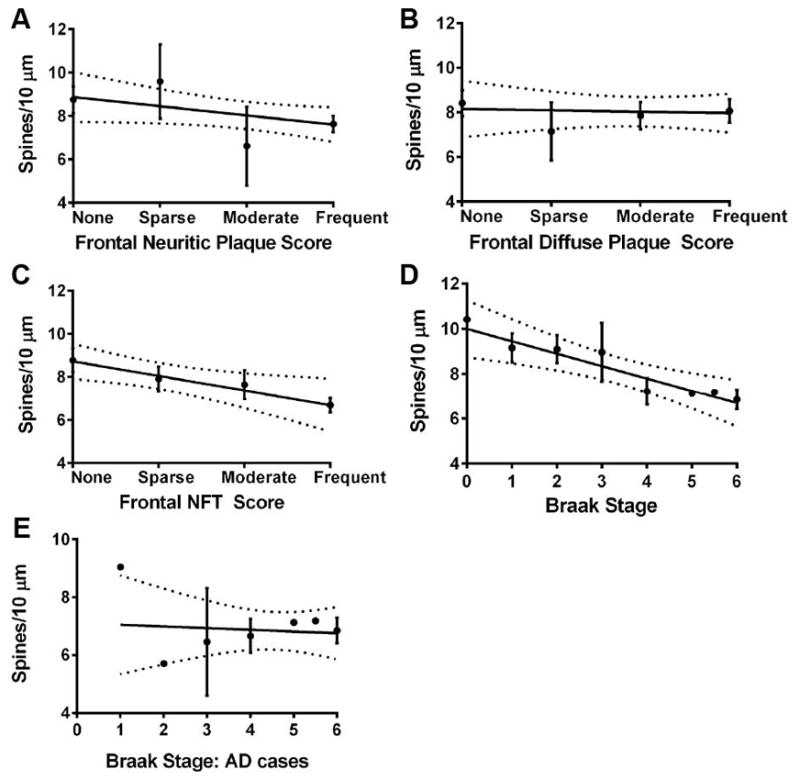
Linear regression analysis of spine density and AD pathology. (A) Spine density does not correlate with neuritic plaque score. (B) Spine density does not correlate with diffuse plaque score. (C) There is negative correlation of spine density with NFT score (F1,39=6.495, R2=0.1428, P=0.0149). (D) There is negative correlation of spine density with Braak staging (F1,37=11.63, R2=0.2392, P=0.0016). (E) Spine density does not correlate with Braak staging among AD cases. Dashed lines represent 95% confidence intervals. NFT, neurofibrillary tangle.
Despite high levels of Aβ plaques and NFTs in CAD brains, the mean spine density measurements were not significantly different from controls (Fig. 2, A–D and Supplementary Tables 1–2). This may contribute to the lack of cognitive impairment in CAD cases; however we hypothesized that maintenance of cognitive function in an environment of AD pathology would involve structural remodeling of dendritic spines. To test this, we assessed spine morphology across control, CAD, and AD cases. Dendritic spine morphology influences excitatory neurotransmission and synaptic plasticity, and spines can be classified on the basis of their three-dimensional structure as stubby, mushroom, or thin13, 32, 33. Stubby spines are theorized to be transitional, mushroom spines represent more stable structures, and thin spines are more dynamic. Dendritic filopodia are actin-rich protrusions that are widely considered the precursors of spines34. Thin spines were reduced significantly in AD compared to CAD cases (Two-way ANOVA P=0.0003; Tukey: P=0.0004), whereas stubby spine density was decreased significantly in CAD and AD compared to controls (Tukey: CAD P=0.031, AD P=0.0054). Numbers of mushroom spines were reduced significantly in AD compared to CAD (Tukey: P=0.0405), but filopodia did not differ significantly among disease states (Fig. 4A and Supplementary Tables 1–2). Linear regression analysis across all cases revealed that age or sex did not correlate with spine classification densities (Fig. 4, B–C and Supplementary Table 3).
FIGURE 4.

Comparison of dendritic spine morphology classes in controls, CAD, and AD cases. (A) Mean number of thin, stubby, or mushroom spines and filopodia per 10 μm. Thin spines are reduced significantly in AD cases compared to CAD (Two-way ANOVA: P=0.0003; Tukey: CAD P=0.0004). Stubby spines are reduced in CAD and AD cases compared to controls (Tukey: CAD P=0.031, AD P=0.0054). (B) Linear regression analysis of spine classification densities measured per 10 μm of dendrite in all cases with age. Each dot represents the average spine class density per 10 μm for each individual case. The density of spine class per 10 μm of dendrite was plotted against the age of each individual. Age represented in years. (C) Average spine class density per 10 μm of dendrite for each individual was graphed based on sex. Lines represent the mean ± SEM.
To further analyze spine structure, spine extent (length) was measured among control, CAD, and AD dendrites. Mean spine extent was increased significantly in CAD cases compared to controls or AD (ANOVA: F2,4548=36.17, P<0.0001; Tukey: controls P<0.0001, AD P<0.0001) (Fig. 5, A & C and Supplementary Tables 1–2). To examine this change in length with more detail, the cumulative distribution of spine extents for each disease state was plotted. The cumulative frequency plots indicated that CAD cases segregate from controls and AD based on spine extent (Kolmogorov-Smirnov: controls D=0.1221, P<0.0001, AD D=0.1455, P<0.0001) (Fig. 5B and Supplementary Table 2). Notably, age or sex did not influence overall mean spine extent (Fig. 5, D–E and Supplementary Tables 2–3). Comparison among spine classes revealed that stubby spine extent was increased selectively and significantly in CAD cases compared to controls and AD (Kolmogorov-Smirnov: controls D=0.1502, P<0.0001; AD D=0.2190, P<0.0001) (Fig. 5, H–I and Supplementary Tables 1–2). Thin spine extent was reduced in AD cases compared to CAD, and mushroom spine extent was increased in CAD cases compared to controls and AD. However, these results were not significant (Fig. 5, F–G, J–K and Supplementary Tables 1–2).
FIGURE 5.

Comparison of dendritic spine extent in controls, CAD, and AD cases. (A) Mean spine extent was increased significantly in CAD compared to controls or AD (ANOVA: P<0.0001; Tukey: controls P<0.0001, AD P<0.0001). (B) The cumulative frequency plots of individual spines indicate that CAD segregates based on spine extent (Kolmogorov-Smirnov: controls D=0.1221, P<0.0001; AD D=1455, P<0.0001). (C) Distribution of spine extent in control, CAD, and AD cases. Each dot represents the average spine extent per individual dendrite that was imaged. (D) Linear regression analysis of spine extent measured across all cases with age. Each dot represents the average spine extent for each individual case. The average spine extent was plotted against the age of each individual. Age represented in years. (E) Average spine extent per individual was graphed based on sex. (F) Mean extent for thin spines was reduced in AD cases compared to CAD (ANOVA: P=0.0486; Tukey: AD P=0.0748). (G) The cumulative distribution of thin spine extent for each disease state was plotted. (H) Mean extent for stubby spines was increased significantly in CAD compared to controls or AD (ANOVA: P<0.0001; Tukey: controls-CAD P=0.0204, controls-AD P<0.0001, CAD-AD P<0.0001). (I) The cumulative distribution of stubby spine extent for each disease state was plotted. The cumulative frequency plots indicated that AD cases segregate from controls and CAD based on stubby spine extent (Kolmogorov-Smirnov: controls D=0.1502, P<0.0001; CAD D=0.2190, P<0.0001). (J) A trending increase in mean extent for mushroom spines was observed in CAD cases compared to controls and AD (ANOVA: P=0.1105; Tukey: AD P=0.0914). (K) The cumulative distribution of mushroom spine extent for each disease state was plotted. The cumulative frequency plots indicated that CAD cases segregate from AD based on mushroom spine extent (Kolmogorov-Smirnov: AD D=0.1165, P=0.0410). Lines represent the mean ± SEM.
Next, spine head diameter was measured among control, CAD, and AD dendrites. Mean spine head diameter was reduced significantly in AD cases compared to controls (ANOVA: F2,4407=5.763, P=0.0032; Tukey: AD P=0.0032) (Fig. 6A and Supplementary Tables 1–2). To examine this change in size with more detail, the cumulative distribution of spine head diameters for each disease state was plotted. The cumulative frequency plots indicated that each group segregates based on spine head diameter (Kolmogorov-Smirnov: controls-CAD D=0.09061, P=0.0002; controls-AD D=0.06866, P=0.0005; CAD-AD D=0.06968, P=0.0070) (Fig. 6B and Supplementary Table 2). Notably, controls segregate from CAD at <0.4 μm head diameter, likely due to reduced thin spine head diameter in CAD cases. Notably, age or sex did not influence overall mean spine head diameter (Fig. 6, D–E and Supplementary Tables 2–3). Analysis of spine classes revealed that thin spine head diameter was reduced selectively in CAD cases compared to controls and AD (ANOVA: F2,1635=5.652, P=0.0036; Tukey: controls P=0.057, AD P=0.0024) (Fig. 6, F–G and Supplementary Tables 1–2). Stubby spine head diameter was reduced significantly in AD compared to controls and CAD (ANOVA: F2,1483=10.33, P<0.0001; Tukey: controls P=0.0003, CAD P=0.0015) (Fig. 6, H–I and Supplementary Tables 1–2). Mushroom spine head diameter was similar among controls, CAD and AD (Fig. 6, J–K and Supplementary Tables 1–2).
FIGURE 6.

Comparison of dendritic spine head diameter in controls, CAD, and AD cases. (A) Mean spine head diameter was reduced significantly in AD compared to controls (ANOVA: P=0.0032; Tukey: AD P=0.0032), while CAD was reduced compared to controls (ANOVA: CAD P=0.0611). (B) The cumulative frequency plots of individual spines indicates that each group segregates based on spine head diameter (Kolmogorov-Smirnov: controls-CAD D=0.09061, P=0.0002; controls-AD D=0.06866, P=0.0005; CAD-AD D=0.06968, P=0.0070). (C) Distribution of spine head diameter in control, CAD, and AD cases. Each dot represents the average spine head diameter per individual dendrite that was imaged. (D) Linear regression analysis of spine head diameter measured across all cases with age. Each dot represents the average spine head diameter for each individual case. The average spine head diameter was plotted against the age of each individual. Age represented in years. (E) Average spine head diameter per individual was graphed based on sex. (F) Mean head diameter for thin spines was reduced in CAD cases compared to controls and AD (ANOVA: P=0.0036; Tukey: controls P=0.057, AD P=0.0024). (G) The cumulative distribution of thin spine head diameters for each disease state was plotted. The cumulative frequency plots indicated that CAD cases segregate from AD based on thin spine head diameter Kolmogorov-Smirnov: AD D=0.1034, P=0.0101). (H) Mean head diameter was reduced significantly for stubby spines in AD compared to CAD and controls (ANOVA: P<0.0001; Tukey: CAD P=0.0015, controls P=0.0003). (I) The cumulative distribution of stubby spine head diameters for each disease state was plotted. The cumulative frequency plots indicated that AD cases segregate from controls and CAD based on stubby spine head diameter (Kolmogorov-Smirnov: controls D=0.1421, P<0.0001; CAD D=0.1512, P=0.0010). (J) Mean head diameter for mushroom spines was similar among control, CAD, and AD cases. (K) The cumulative distribution of mushroom spine head diameters for each disease state was plotted. The cumulative frequency plots indicated overlap among controls, CAD, and AD cases based on mushroom spine head diameter. Lines represent the mean ± SEM.
DISCUSSION
In this study, we used optimized three-dimensional modeling of dendritic spines to reveal that maintenance of thin and mushroom spine populations combined with cumulative increased spine extent distinguished CAD cases from AD. These observations provide cellular evidence to support the hypothesis that spine plasticity is a mechanism of cognitive resilience that protects older individuals with AD pathophysiology from developing dementia35.
Concomitant alternations in extent and head diameter among spine classes in CAD cases may reflect more rapid plasticity to maintain information storage36. For instance, cumulative increases in spine extent through the DLPFC could sustain working memory in an environment of Aβ plaques and NFTs by extending their reach to maintain degenerating connections or facilitating new synaptic inputs. Moreover, preservation of thin and mushroom spine density in CAD appears to be important for cognitive maintenance, whereas stubby spines may be less essential. These results support findings in rhesus monkeys where selective loss of thin spines in area 46 associates with age-related memory impairment30. Maintenance of thin spines suggests preservation of dynamic synapses that are formed or remodeled during learning and memory in adulthood37, 38.
Recently, positron emission tomography (PET) imaging of tau indicated that neurofibrillary tangle distribution across cognitively normal older individuals and AD patients strongly correlated to Braak staging in postmortem tissue39. Using the findings here, a comparison of PET tau imaging and its correlative Braak stage could be used to extrapolate a hypothetical representation of synaptic density and structure in the DLPFC. Yet, no correlation with spine density and Braak staging was observed among AD cases, suggesting that a clinical diagnosis of AD associates with reduced spine density irrespective of Braak stage (Fig. 3E and Supplementary Table 3). However, the limited numbers of AD cases that display Braak stage I–III at autopsy hinder this analysis.
11C-Pittsburgh compound B imaging studies suggest that only 13% of cognitively normal individuals that are positive for Aβ will transition to mild cognitive impairment or AD40. Based on this, comparison of structural plasticity among controls, CAD, and AD cases may be interpreted in two ways. If the CAD individuals lived to develop dementia, then the observed phenotypes could reflect necessary synaptic structure changes during the transition from preclinical to symptomatic AD. Alternatively, if the CAD individuals lived and remained immune to dementia, then the observed phenotypes could represent an inherent protective mechanism that prevents the onset of dementia (Fig. 7). In either scenario, these findings emphasize spine plasticity as a mechanism of cognitive resilience and highlight structural plasticity as a substrate for therapeutic intervention during the preclinical phase of AD.
FIGURE 7.

Representative illustration of dendrites from control, CAD, and AD cases (not to scale).
Supplementary Material
Acknowledgments
We thank Drs. Sharon Swanger and Linda Overstreet-Wadiche for critical reading of this manuscript and acknowledge Dr. Yaakov Stern for constructive discussions. This work was supported by the National Institutes of Health through NIA AG054719 to J.H.H. and NIA AG043552-05 to J.H.H., Emory Neuroscience NINDS Core Facilities grant P30NS055077, and the Emory University Alzheimer’s Disease Research Center grant AG025688. Additional support stemmed from a New Investigator Research Grant 2015-NIRG-339422 to J.H.H. from the Alzheimer’s Association.
Footnotes
Author Contributions
J.H.H., B.D.B., and M.G. conceived the experiments; B.D.B., K.M.G., E.G.G., K.A.C., E.L.B., M.G., and J.H.H. performed the experiments and analyzed the data; and B.D.B. and J.H.H. wrote the article.
Potential Conflicts of Interests
Nothing to report.
References
- 1.Sperling RA, Aisen PS, Beckett LA, et al. Toward defining the preclinical stages of Alzheimer’s disease: recommendations from the National Institute on Aging-Alzheimer’s Association workgroups on diagnostic guidelines for Alzheimer’s disease. Alzheimers Dement. 2011;7:280–292. doi: 10.1016/j.jalz.2011.03.003. [DOI] [PMC free article] [PubMed] [Google Scholar]
- 2.Driscoll I, Troncoso J. Asymptomatic Alzheimer’s disease: a prodrome or a state of resilience? Curr Alzheimer Res. 2011;8:330–335. doi: 10.2174/156720511795745348. [DOI] [PMC free article] [PubMed] [Google Scholar]
- 3.Bennett DA, Schneider JA, Arvanitakis Z, et al. Neuropathology of older persons without cognitive impairment from two community-based studies. Neurology. 2006;66:1837–1844. doi: 10.1212/01.wnl.0000219668.47116.e6. [DOI] [PubMed] [Google Scholar]
- 4.Head E, Corrada MM, Kahle-Wrobleski K, et al. Synaptic proteins, neuropathology and cognitive status in the oldest-old. Neurobiology of aging. 2009;30:1125–1134. doi: 10.1016/j.neurobiolaging.2007.10.001. [DOI] [PMC free article] [PubMed] [Google Scholar]
- 5.O’Brien RJ, Resnick SM, Zonderman AB, et al. Neuropathologic studies of the Baltimore Longitudinal Study of Aging (BLSA) J Alzheimers Dis. 2009;18:665–675. doi: 10.3233/JAD-2009-1179. [DOI] [PMC free article] [PubMed] [Google Scholar]
- 6.Savva GM, Wharton SB, Ince PG, et al. Age, neuropathology, and dementia. The New England journal of medicine. 2009;360:2302–2309. doi: 10.1056/NEJMoa0806142. [DOI] [PubMed] [Google Scholar]
- 7.White L. Brain lesions at autopsy in older Japanese-American men as related to cognitive impairment and dementia in the final years of life: a summary report from the Honolulu-Asia aging study. J Alzheimers Dis. 2009;18:713–725. doi: 10.3233/JAD-2009-1178. [DOI] [PubMed] [Google Scholar]
- 8.Ramon y Cajal S. On a special ganglion of the spheno-occipital cortex. Trabajos del Laboratorio de lnvestigaciones Biologicas de la universidad de Madrid. 1901 [Google Scholar]
- 9.DeKosky ST, Scheff SW. Synapse loss in frontal cortex biopsies in Alzheimer’s disease: correlation with cognitive severity. Ann Neurol. 1990;27:457–464. doi: 10.1002/ana.410270502. [DOI] [PubMed] [Google Scholar]
- 10.Terry RD, Masliah E, Salmon DP, et al. Physical basis of cognitive alterations in Alzheimer’s disease: synapse loss is the major correlate of cognitive impairment. Ann Neurol. 1991;30:572–580. doi: 10.1002/ana.410300410. [DOI] [PubMed] [Google Scholar]
- 11.Jack CR, Jr, Lowe VJ, Senjem ML, et al. 11C PiB and structural MRI provide complementary information in imaging of Alzheimer’s disease and amnestic mild cognitive impairment. Brain. 2008;131:665–680. doi: 10.1093/brain/awm336. [DOI] [PMC free article] [PubMed] [Google Scholar]
- 12.Mintun MA, Larossa GN, Sheline YI, et al. [11C]PIB in a nondemented population: potential antecedent marker of Alzheimer disease. Neurology. 2006;67:446–452. doi: 10.1212/01.wnl.0000228230.26044.a4. [DOI] [PubMed] [Google Scholar]
- 13.Hayashi Y, Majewska AK. Dendritic spine geometry: functional implication and regulation. Neuron. 2005;46:529–532. doi: 10.1016/j.neuron.2005.05.006. [DOI] [PubMed] [Google Scholar]
- 14.Hughes CP, Berg L, Danziger WL, et al. A new clinical scale for the staging of dementia. Br J Psychiatry. 1982;140:566–572. doi: 10.1192/bjp.140.6.566. [DOI] [PubMed] [Google Scholar]
- 15.Morris JC. The Clinical Dementia Rating (CDR): current version and scoring rules. Neurology. 1993;43:2412–2414. doi: 10.1212/wnl.43.11.2412-a. [DOI] [PubMed] [Google Scholar]
- 16.Mirra SS, Heyman A, McKeel D, et al. The Consortium to Establish a Registry for Alzheimer’s Disease (CERAD) Part II. Standardization of the neuropathologic assessment of Alzheimer’s disease. Neurology. 1991;41:479–486. doi: 10.1212/wnl.41.4.479. [DOI] [PubMed] [Google Scholar]
- 17.Montine TJ, Phelps CH, Beach TG, et al. National Institute on Aging-Alzheimer’s Association guidelines for the neuropathologic assessment of Alzheimer’s disease: a practical approach. Acta neuropathologica. 2012;123:1–11. doi: 10.1007/s00401-011-0910-3. [DOI] [PMC free article] [PubMed] [Google Scholar]
- 18.Jacobs B, Driscoll L, Schall M. Life-span dendritic and spine changes in areas 10 and 18 of human cortex: a quantitative Golgi study. The Journal of comparative neurology. 1997;386:661–680. [PubMed] [Google Scholar]
- 19.Jacobs B, Schall M, Prather M, et al. Regional dendritic and spine variation in human cerebral cortex: a quantitative golgi study. Cereb Cortex. 2001;11:558–571. doi: 10.1093/cercor/11.6.558. [DOI] [PubMed] [Google Scholar]
- 20.Rask-Andersen H, Tylstedt S, Kinnefors A, Illing R. Synapses on human spiral ganglion cells: a transmission electron microscopy and immunohistochemical study. Hearing research. 2000;141:1–11. doi: 10.1016/s0378-5955(99)00179-3. [DOI] [PubMed] [Google Scholar]
- 21.Benavides-Piccione R, Ballesteros-Yanez I, DeFelipe J, Yuste R. Cortical area and species differences in dendritic spine morphology. Journal of neurocytology. 2002;31:337–346. doi: 10.1023/a:1024134312173. [DOI] [PubMed] [Google Scholar]
- 22.Benavides-Piccione R, Fernaud-Espinosa I, Robles V, et al. Age-based comparison of human dendritic spine structure using complete three-dimensional reconstructions. Cereb Cortex. 2013;23:1798–1810. doi: 10.1093/cercor/bhs154. [DOI] [PMC free article] [PubMed] [Google Scholar]
- 23.Young ME, Ohm DT, Dumitriu D, et al. Differential effects of aging on dendritic spines in visual cortex and prefrontal cortex of the rhesus monkey. Neuroscience. 2014;274:33–43. doi: 10.1016/j.neuroscience.2014.05.008. [DOI] [PMC free article] [PubMed] [Google Scholar]
- 24.Tang G, Gudsnuk K, Kuo SH, et al. Loss of mTOR-dependent macroautophagy causes autistic-like synaptic pruning deficits. Neuron. 2014;83:1131–1143. doi: 10.1016/j.neuron.2014.07.040. [DOI] [PMC free article] [PubMed] [Google Scholar]
- 25.Ruszczycki B, Szepesi Z, Wilczynski GM, et al. Sampling issues in quantitative analysis of dendritic spines morphology. BMC bioinformatics. 2012;13:213. doi: 10.1186/1471-2105-13-213. [DOI] [PMC free article] [PubMed] [Google Scholar]
- 26.Swanger SA, Mattheyses AL, Gentry EG, Herskowitz JH. ROCK1 and ROCK2 inhibition alters dendritic spine morphology in hippocampal neurons. Cellular logistics. 2015;5:e1133266. doi: 10.1080/21592799.2015.1133266. [DOI] [PMC free article] [PubMed] [Google Scholar]
- 27.van Veluw SJ, Sawyer EK, Clover L, et al. Prefrontal cortex cytoarchitecture in normal aging and Alzheimer’s disease: a relationship with IQ. Brain structure & function. 2012;217:797–808. doi: 10.1007/s00429-012-0381-x. [DOI] [PubMed] [Google Scholar]
- 28.Wong S, Flanagan E, Savage G, et al. Contrasting prefrontal cortex contributions to episodic memory dysfunction in behavioural variant frontotemporal dementia and Alzheimer’s disease. PloS one. 2014;9:e87778. doi: 10.1371/journal.pone.0087778. [DOI] [PMC free article] [PubMed] [Google Scholar]
- 29.Bloss EB, Janssen WG, Ohm DT, et al. Evidence for reduced experience-dependent dendritic spine plasticity in the aging prefrontal cortex. J Neurosci. 2011;31:7831–7839. doi: 10.1523/JNEUROSCI.0839-11.2011. [DOI] [PMC free article] [PubMed] [Google Scholar]
- 30.Dumitriu D, Hao J, Hara Y, et al. Selective changes in thin spine density and morphology in monkey prefrontal cortex correlate with aging-related cognitive impairment. J Neurosci. 2010;30:7507–7515. doi: 10.1523/JNEUROSCI.6410-09.2010. [DOI] [PMC free article] [PubMed] [Google Scholar]
- 31.Hardy J, Selkoe DJ. The amyloid hypothesis of Alzheimer’s disease: progress and problems on the road to therapeutics. Science. 2002;297:353–356. doi: 10.1126/science.1072994. [DOI] [PubMed] [Google Scholar]
- 32.Harris KM, Jensen FE, Tsao B. Three-dimensional structure of dendritic spines and synapses in rat hippocampus (CA1) at postnatal day 15 and adult ages: implications for the maturation of synaptic physiology and long-term potentiation. J Neurosci. 1992;12:2685–2705. doi: 10.1523/JNEUROSCI.12-07-02685.1992. [DOI] [PMC free article] [PubMed] [Google Scholar]
- 33.Hering H, Sheng M. Dendritic spines: structure, dynamics and regulation. Nat Rev Neurosci. 2001;2:880–888. doi: 10.1038/35104061. [DOI] [PubMed] [Google Scholar]
- 34.Ziv NE, Smith SJ. Evidence for a role of dendritic filopodia in synaptogenesis and spine formation. Neuron. 1996;17:91–102. doi: 10.1016/s0896-6273(00)80283-4. [DOI] [PubMed] [Google Scholar]
- 35.Mufson EJ, Mahady L, Waters D, et al. Hippocampal plasticity during the progression of Alzheimer’s disease. Neuroscience. 2015 doi: 10.1016/j.neuroscience.2015.03.006. [DOI] [PMC free article] [PubMed] [Google Scholar]
- 36.Grutzendler J, Kasthuri N, Gan WB. Long-term dendritic spine stability in the adult cortex. Nature. 2002;420:812–816. doi: 10.1038/nature01276. [DOI] [PubMed] [Google Scholar]
- 37.Holtmaat AJ, Trachtenberg JT, Wilbrecht L, et al. Transient and persistent dendritic spines in the neocortex in vivo. Neuron. 2005;45:279–291. doi: 10.1016/j.neuron.2005.01.003. [DOI] [PubMed] [Google Scholar]
- 38.Holtmaat A, Svoboda K. Experience-dependent structural synaptic plasticity in the mammalian brain. Nat Rev Neurosci. 2009;10:647–658. doi: 10.1038/nrn2699. [DOI] [PubMed] [Google Scholar]
- 39.Scholl M, Lockhart SN, Schonhaut DR, et al. PET Imaging of Tau Deposition in the Aging Human Brain. Neuron. 2016;89:971–982. doi: 10.1016/j.neuron.2016.01.028. [DOI] [PMC free article] [PubMed] [Google Scholar]
- 40.Rowe CC, Bourgeat P, Ellis KA, et al. Predicting Alzheimer disease with beta-amyloid imaging: results from the Australian imaging, biomarkers, and lifestyle study of ageing. Annals of neurology. 2013;74:905–913. doi: 10.1002/ana.24040. [DOI] [PubMed] [Google Scholar]
Associated Data
This section collects any data citations, data availability statements, or supplementary materials included in this article.