

Abstract
An increasing number of G protein-coupled receptor (GPCR) crystal structures provide important—albeit static—pictures of how small molecules or peptides interact with their receptors. These high-resolution structures represent a tremendous opportunity to apply molecular dynamics (MD) simulations to capture atomic-level dynamical information that is not easy to obtain experimentally. Understanding ligand binding and unbinding processes, as well as the related responses of the receptor, is crucial to the design of better drugs targeting GPCRs. Here, we discuss possible ways to study the dynamics involved in the binding of small molecules to GPCRs, using long timescale MD simulations or metadynamics-based approaches.
Keywords: Molecular dynamics, Ligand binding, Small-molecule drugs, GPCRs, Enhanced-sampling methods, Interaction fingerprints, Allosteric communication
1 Introduction
One of the main challenges of developing novel small molecules which target G protein-coupled receptors (GPCRs) is that these proteins are highly dynamic and exist in an ensemble of conformations rather than single inactive and activated states. While the dynamics of GPCRs represent a challenge for the discovery of novel ligands using traditional methods of computer-aided drug discovery (CADD), they also represent an opportunity to develop improved therapeutics by virtue of exploiting them to achieve functional selectivity. Increases in computing power and advancements in parallelization of molecular dynamics (MD) simulations, as well as the application of enhanced sampling algorithms, have led to the increasing use of these approaches to capture, at an atomic level of detail, dynamical processes such as ligand binding and ligand-induced conformational changes in the receptor. When considering the ensemble of conformations in which GPCRs exist, docking into an available crystal structure may not be able to capture the correct binding pose of a ligand, especially one that is chemically different from the cocrystallized ligand. This is even more true for allosteric ligands, which bind to a site other than the canonical orthosteric binding site, where endogenous ligands normally bind. As this site typically corresponds to variable and flexible loop regions, the bound conformation of an allosteric ligand may not be readily identified from a crystal structure with only an orthosteric ligand. For instance, while a positive allosteric modulator (PAM) was found to be bound at the extracellular side of the M2 muscarinic receptor crystal structure (PDB: 4MQT [1]), the negative allosteric modulators (NAMs) cocrystallized with the chemokine receptors CCR9 (PDB: 5LWE [2]) and CCR2 (PDB: 5T1A [3]) were found at the intracellular side. Notably, allosteric GPCR ligands are of great interest from a drug discovery perspective due to their expected greater subtype selectivity, their ability to maintain temporal and spatial characteristics of endogenous signals, and their potentially limited on-target overdosing risks [4].
Another hallmark of GPCRs that can be particularly useful for drug discovery is their ability to mediate several signaling pathways due to possible activation of various intracellular proteins, including G proteins and β-arrestins. Although functionally selective ligands may, in principle, bind to the orthosteric binding site, they are capable of inducing changes in the receptor conformation which lead to the activation of selected signaling pathways, thereby separating beneficial from adverse side effects. For example, the observation that analgesic properties of opioids are mostly due to the activation of the G protein signaling pathway while signaling through the β-arrestin pathway leads to adverse side effects, including constipation, tolerance, and respiratory depression, led to the development of the G protein-biased agonist TRV-130, which is currently in clinical trials for FDA approval [5].
MD simulations have been used by our group [6–8] and others (e.g., [9–11]) to answer two key questions with respect to functionally selective and allosteric ligands targeting GPCRs: (1) what are the energetically preferred binding pathways and modes of ligand binding, and (2) how does the ligand transfer information from the ligand binding site to the intracellular side of the receptor? The ability of long timescale, unbiased MD simulations to predict the crystallographic binding pose of a small molecule, as well as to characterize its binding pathway to a GPCR crystal structure, was first shown for the binding of several beta blockers to the β2 adrenergic receptor (β2AR) [10]. Long unbiased MD simulations have recently been used to predict poses of TRV-130 to the μ-opioid receptor (MOR) [7], allosteric ligands to the M2 muscarinic receptor (M2) [9], and ML056 to the sphingosine-1-phosphate receptor 1 (S1P1R) [12]. We pioneered the use of metadynamics [13] to study ligand binding to GPCRs [14] and have recently used this enhanced MD algorithm to predict the binding pose of a PAM, BMS-986187, to the δ-opioid receptor (DOR) [8], as well as kurkinorin, a G protein-biased agonist, to MOR [6]. Notably, our experimentally validated allosteric binding site of BMS-986187 at DOR [8] was not similar to any of the top-ranked poses from docking with Glide XP version 6.2 [15]. While accelerated MD (aMD) [16] was able to characterize the binding of the partial agonist arecoline and the agonist acetylcholine to the M3 muscarinic receptor [17], neither aMD [17] nor unbiased MD simulations [11] were able to recapitulate the crystallographic binding pose of the much larger and flexible antagonist tiotropium to M3, which shows that there are still limitations to these methods.
While the determination of the binding pose and binding pathway is a crucial part of understanding how ligands and receptors interact, understanding how information is communicated between the binding site and intracellular parts of the receptor is also necessary. The dynamical information derived from MD simulations can lead to the identification of the specific GPCR residues and ligand-receptor interactions that are responsible for this allosteric transmission (see e.g. [7, 18, 19]). This information is likely to impact the design of allosteric ligands which modulate the action of endogenous ligands, as well as functionally selective ligands that only activate desired therapeutic pathways.
Here, we discuss the computational methods that we used to predict energetically preferred binding poses of two functionally selective ligands, TRV-130 [7] and kurkinorin [6], and an allosteric ligand, BMS-986187 [8], as well as the analysis that led us to identify interesting allosteric communication differences in MOR between the classical unbiased agonist morphine and the G protein-biased agonist TRV-130 [7].
2 Materials
While there are many alternatives, the software and web-servers that we have used to set up, run, and analyze the MD simulations discussed here are described below. Most of the software listed below is available free of charge to academic researchers.
Crystal structures of GPCRs frequently require modifications (e.g., adding hydrogens) before they can be used in simulations. If the crystal structure is missing loops and/or side-chains, they can be added using modeling software packages such as MODELLER [20] or ROSETTA [21].
Once the protein structure is complete, it needs to be embedded in a membrane. The CHARMM-GUI webserver (charmm-gui.org) [22] is very user friendly and can be used to build membranes of many different compositions. An alternative is to use a tool known as InflateGRO2 [23], which can automatically and efficiently embed the receptor in a pre-equilibrated membrane.
In most cases, the parameters of a small-molecule ligand are not readily available in standard force fields and need to be generated by the user in a manner that is consistent with the force field used to describe the protein and lipids (see Note 1). We generally use the CHARMM force field and generate initial ligand parameters using the CHARMM General Force Field (CGenFF) webserver (cgenff.paramchem.org [24, 25]). The parameters must be validated according to the procedures described in [26]. Validation requires performing quantum mechanics calculations, which we usually carry out with Gaussian for which a license must be purchased.
There are several software packages available to perform MD simulations. We frequently use GROMACS [27] or NAMD [28], which are both freely available (see Note 2). Metadynamics simulations can be implemented in either of these packages using the PLUMED plug-in [29].
Two programs that can be used to visualize structures and trajectories from MD simulations are VMD [30] and PyMOL [31]. Postprocessing and simulation analysis can be performed with GROMACS tools and in-house scripts. We typically use the PyEMMA python library [32] to construct Markov State Models (MSMs).
3 Methods
3.1 Protein Setup
In our recently published work, we used the crystal structures of the inactive DOR (PDB: 4N6H [33]), inactive MOR (PDB: 4DKL [34]), and activated MOR (PDB: 5C1M [35]) (see Note 3). First, with the exception of the crystallographic waters, the non-receptor atoms, including the ligands, lipids, and some of the proteins required for crystallization (BRIL for DOR and T4L for inactive MOR), were removed. Many crystal structures of GPCRs are missing segments of intracellular or extracellular loops that are too flexible to be resolved crystallographically or were removed to insert fusion proteins necessary for crystallization. These segments such as most of the intracellular loop 3 (ICL3) missing from the inactive MOR crystal structure (PDB: 4DKL [34]), need to be built ab initio or modeled by homology using an available, close template structure, as a reference. In our recently published studies, we used MODELLER to perform homology modeling of MOR ICL3 based on the corresponding segment in the ultra-high-resolution DOR crystal structure (PDB: 4N6H [33]) (see Notes 4 and 5). To crystallize activated forms of GPCRs, G protein mimetic nanobodies have been used to maintain the conformational changes on the intracellular side of the receptor that accompany receptor activation. We retained the nanobody cocrystallized with the MOR activated crystal structure in simulations of TRV-130 binding to avoid deactivation of the receptor while the ligand was still in the bulk, but removed it in simulations where we studied allosteric communication in MOR induced by TRV-130 or morphine [7].
Once the protein construct to be simulated is complete, it needs to be embedded in a membrane and solvated. Since cholesterol (CHOL) is an integral part of the plasma membrane, we typically use a membrane with a 1-palmitoyl,2-oleoyl-sn-glycero-3-phosphocholine (POPC)/10%CHOL composition. A user-friendly way to construct the protein/membrane/solvent system is to use the MEMBRANE BUILDER module [36] of the CHARMM-GUI [22], which can output input files for several MD packages [37], including GROMACS, CHARMM, and NAMD.
The final step is to equilibrate the system. First, we typically perform an energy minimization to remove steric clashes. Then, we equilibrate the system in a constant-temperature, constant-pressure (NPT) ensemble at 300 K and 1 bar to equilibrate the box size. To ensure stability of the system it is generally best to start by placing position restraints on the heavy atoms of the lipids and protein, and reduce the position restraints in stages by changing the force constant (e.g., k = 1000, 500, 100, and 50 kJ/mol/nm2). Finally, we typically perform an NPT run without position restraints.
3.2 Trajectory Generation with Unbiased MD
To generate binding trajectories and identify the bound pose(s) of ligands, we have used two approaches in recently published works: (1) long-timescale MD and (2) multiple-walker metadynamics. Here, we discuss how to set up and run these types of simulations.
Normally, unbiased MD is unable to capture the timescale on which GPCR ligand binding from the bulk occurs, but thanks to specially designed hardware, e.g., D. E. Shaw Research’s Anton supercomputer [38], this problem is partially alleviated. To further enhance the probability of ligand binding, the concentration of the ligand is increased in the simulation box instead of only using one molecule. For example, we added ten TRV-130 molecules to our recently published simulations [7]. They can be manually placed in the simulation box using PyMOL [31] at a distance of at least 1 nm from the receptor. Multiple copies of the system need to be created to further enhance the probability of a binding event. In the case of TRV-130, eight starting conformations were generated by randomly assigning initial velocities. The individual MD trajectories can be run until a binding event occurs or when all ligands are bound to the membrane. Once a ligand binds to the membrane it is unlikely to be released back into the bulk during typical timescales of ligand binding (several microseconds on Anton). For the recently published TRV-130 simulations, the initial eight simulations were run for between 1 and 8.4 μs each (39.10 μs total) [7]. Despite initiating eight trajectories, binding of TRV-130 at the orthosteric site only occurred in one trajectory, which was not sufficient to derive conclusions about the sampled binding pathway and adopted ligand bound poses. To enhance sampling, new trajectories were started from conformations in which the ligand was not in the orthosteric site but was at a bound position along the binding pathway. This second set of 25 simulations were run for between 0.2 and 1.0 μs each (5.15 μs total) and resulted in eight additional binding events.
3.3 Trajectory Generation with Multiple Walker Metadynamics
A more computationally efficient method of identifying ligand binding pathways and binding poses is to use metadynamics, which applies a history-dependent bias term on collective variables (CVs) to enhance the sampling of rare transitions [13]. The CVs, which are defined by the user, should account for the slow degrees of freedom of the system and must be able to distinguish between states. Multiple walker metadynamics [39] increases the efficiency of metadynamics by running several copies of the system in parallel. For the recently published simulations of the binding of BMS-986187 to DOR [8], two CVs were biased: (1) the distance between the centers-of-mass of the transmembrane (TM) bundle of the protein and the heavy atoms of the ligand and (2) a measure of the polar and hydrophobic contacts formed between the ligand and receptor sidechains. CV2 was defined as:
where rij is the distance between the atoms of the ligand and the receptor and r0 was set to 5 Å. The same two CVs were biased in our recently published simulations which predict the binding pose of kurkinorin [6]. While the starting configuration of the walkers should be independent of the final results, sampling is more efficient if each walker starts from a different initial structure, including structures in which the ligand is in the orthosteric binding site as well as in the bulk. An easy way to generate the starting structures is to perform a metadynamics simulation in which only CV1 is biased. To restrict sampling of the ligand in the bulk to the area of interest (i.e., close to the protein) and prevent the ligand from binding to the membrane, limits can be placed on the xy-position of the ligand.
Since all replicas in multiple-walker metadynamics experience a bias, the trajectories must be reweighed to recover the Boltzmann distribution using, for instance, the method developed by Tiwary et al. [40]. The reweighting procedure can also be used to reconstruct the free-energy surface as a function of other CVs to aid in discriminating between ligand binding poses, which have similar values of CV1 and CV2 but different orientations with respect to the receptor. For the simulations of the PAM binding to DOR, CV3 was defined as the z-component of a vector connecting centers of mass of the tricyclic moiety (green in Fig. 1) and the ortho-substituted benzyl ring (purple in Fig. 1) while CV4 was simply the xy-component of CV1. The 4-D free energy surface was then divided into microstates by dividing each CV into 75 bins. Only those microstates with energies less than 5 kJ/mol were included in further analysis.
Fig. 1.
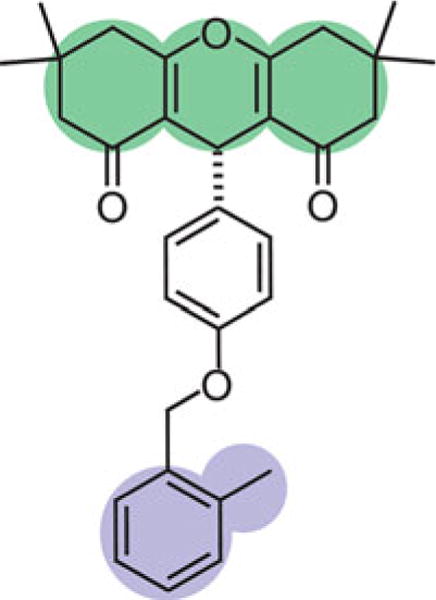
The structure of BMS-986187, a DOR PAM, for which multiple-walker metadynamics was used to predict the binding pose at an allosteric site on DOR. The parts of the ligand which were used to calculate CV3 are the tricyclic moiety (green) and the ortho-substituted benzyl ring (purple). Adapted with permission from Shang Y, Yeatman HR, Provasi D, Alt A, Christopoulos A, Canals M, Filizola M (2016) Proposed mode of binding and action of positive allosteric modulators at opioid receptors. ACS Chemical Biology 11(5):1220–1229. Copyright 2016 American Chemical Society
3.4 Clustering to Identify the Binding Pose and Metastable States
To determine representative poses of the bound ligand and metastable states, the poses sampled during the simulations are clustered. In recently published work [6–8], we have used two types of interaction fingerprints, which describe the interactions between the ligand and the receptor. The first considers the number and type of ligand-receptor interaction with the interaction type classified as hydrophobic, polar, or aromatic. The polar interactions can be direct, between the ligand and the receptor in which the receptor is either the H-bond donor or acceptor, or water-mediated, in which one water molecule interacts with both the ligand and receptor at the same time. The aromatic interactions are divided into π-cation, edge-to-face, and edge-to-edge interactions. In the second type of interaction fingerprint, the ligand is divided into fragments and the interactions between the fragments and receptor residues are clustered regardless of the type of interaction. For example, TRV-130 was split into four fragments [7]: (1) the methoxy-thiophene moiety, (2) the pyridine, (3) the 6-oxaspiro [4.5]decan-9-yl, and (4) the amine moiety (see Fig. 2). Sometimes, the definition of which interactions to cluster needs to be extended based on the problem of interest. For example, since we were only interested in defining the binding pose of kurkinorin [6], only the interactions between the ligand and receptor were considered. In the case of TRV-130, we were interested in the full binding pathway so interactions between the ligand and lipid headgroups were considered in addition to those between the ligand and the receptor since the ligand spent some time outside the extracellular vestibule. Finally, when determining the binding poses of the PAM BMS-986187 to DOR [8], the interactions between the PAM and the orthosteric ligand SNC-80 were also considered since they could come into contact. Using the Tanimoto dissimilarity coefficient as the distance metric, we then apply a density-based spatial clustering of applications with noise (DBSCAN) [41] algorithm to perform the clustering. This is our currently preferred method since it does not require the user to input the desired number of clusters as is necessary, for instance, in k-means clustering. Finally, the free energy of each cluster is calculated to determine which is the lowest energy ligand binding pose. The energy is directly proportional to the population of each cluster for unbiased simulations, but in the case of the metadynamics simulations, the free energy of a cluster α is calculated as
where s is a microstate within cluster α and Z is the partition function.
Fig. 2.
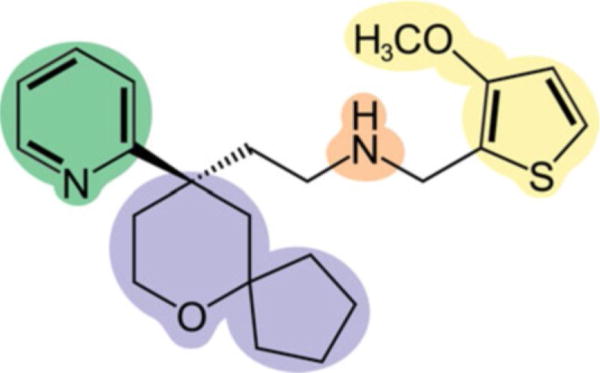
Structure of TRV-130 which shows the four fragments into which the structure was broken to compute the interaction fingerprints to identify the ligand bound pose and metastable sites along the binding pathway: (1) the methoxy-thiophene moiety (yellow), (2) the pyridine moiety (green), (3) the 6-oxaspiro[4.5]decan-9-yl moiety (purple), and (4) the amine moiety (orange). Adapted with permission from Schneider S, Provasi D, Filizola M (2016) How oliceridine (TRV-130) binds and stabilizes a mu-opioid receptor conformational state that selectively triggers G protein signaling pathways. Biochemistry 55 (46):6456–6466. Copyright 2016 American Chemical Society
3.5 Characterizing Pathway Connectivity
Markov state models (MSM) can be used to derive kinetic information from MD simulations and are useful in characterizing transitions between states. While our simulations of TRV-130 binding [7] were not comprehensive enough to derive converged rate constants, we applied the PyEMMA python library [32] to determine likely transitions between identified metastable states (see Note 6). An alternative set of libraries for the construction of MSMs is MSMBUILDER [42].
A very extensive set of simulations totaling 831 μs was recently carried out by Stanley et al. [12] to examine the kinetics of binding of ML056 to S1P1R. Specifically, a first set of 1000 trajectories totaling 579 μs was followed by two iterations of trajectory respawning to increase sampling of binding events. From the kinetic model, the simulations were able to show that the rate-limiting step of the binding of ML056, which occurs via the membrane, corresponds to entry into the vestibule region of the receptor and not to movement into the orthosteric site, an observation that is consistent with the work by Dror et al. [10].
3.6 Allosteric Communication Between the Orthosteric Ligand Binding Site and the Intracellular Side of the Receptor
While a comparison of the inactive and activated crystal structures of GPCRs can provide some clues as to how communication can travel from the orthosteric binding site to the intracellular side of the receptor, the use of computational analysis methods based on MD simulations of these crystal structures allows an assessment of these communication pathways based on dynamics. Extracting relevant allosteric pathways from simulations of proteins is a longstanding problem and a number of approaches have been developed (see e.g. [43–45] for reviews of these methods). Such methods have been applied to study various GPCRs, including the A2A-adenosine receptor [46], β2AR [18], dopamine receptors [47], luteinizing hormone receptor [48], MOR [7], rhodopsin [49, 50], and 5HT2A serotonin receptor [51, 52].
We recently applied the N-body Information Theory (NbIT) analysis [53] of LeVine and Weinstein to study the allosteric communication between the MOR orthosteric binding site and the intracellular end of the receptor, in the presence of bound TRV-130 or bound morphine. NbIT provides a more detailed picture of allosteric communication because it is determined using an information theory-based analysis of N-body correlated motions derived from the configurational entropy of the system rather than simply pairwise atomic fluctuation correlations from MD.
To compare the allosteric communication between morphine bound to the activated MOR crystal structure and TRV-130 bound to activated MOR, we performed three 1 μs simulations for each ligand/MOR complex. While the nanobody used to crystallize activated MOR was retained in the simulations of TRV-130 binding, it was removed to study MOR communication in order to ensure we captured the communication in the receptor due to only the bound ligand. The first step was to define two sets of residues, the “transmitting” (T) region and the “receiving” (R) region. The T residues were selected as those within 5 Å of the ligand in the initial conformation of the ligand-protein complex. The selected R residues were those within 5 Å of the nanobody in the activated MOR crystal structure. Within the NbIT formalism [53], the mutual information (MI) between the T and R residues is defined as
where H is the configurational entropy of the residues in the set X (either R or T).
Here, CM is the covariance matrix for all of the heavy atoms in the corresponding R or T region.
Furthermore, the co-information for the R and T regions, given the channel (C), is
in which the last term is the conditional mutual information,
To determine the contribution of a specific residue in the C region, the CI is calculated with that residue removed from the C region and then normalized by the MI between the T and R regions, MI(T,R). For further details on the NbIT method, please see Ref [53]. From the NbIT analysis, we were able to deduce key differences in the allosteric communication between morphine bound to MOR and TRV-130 bound to MOR [7].
Acknowledgments
This work was supported by National Institutes of Health grants MH107053, DA026434, and DA034049. Computations discussed here were run on resources available through (a) the Scientific Computing Facility at the Icahn School of Medicine at Mount Sinai, (b) the Extreme Science and Engineering Discovery Environment (XSEDE) under MCB080077, which is supported by National Science Foundation grant number ACI-1053575, and (c) the Pittsburgh Supercomputing Center which provided Anton computer time (under PSCA14006) through grant R01GM116961 from the National Institutes of Health. The Anton machine at PSC was generously made available by D.E. Shaw Research
Footnotes
It is important to ensure that ligands are parameterized with the same force field one is using for the protein and lipids to be simulated. A ligand parameterized with CGenFF cannot be used with the AMBER force field and vice-versa.
Some of the TRV-130 simulations discussed here were performed on the Anton supercomputer [38] at the Pittsburgh Supercomputing Center for which a very specific simulation setup is required.
Since an activated structure of DOR has not been solved yet, we elected to use the receptor’s inactive crystal structure to simulate the binding of BMS-986187 to DOR. Also, at the time we started the kurkinorin simulations, the activated MOR crystal structure was not available yet, requiring us to use the receptor’s inactive structure. A comparison of the orthosteric binding sites of the inactive and activated MOR crystal structures shows that they are very similar, and we expect the same to be true for DOR.
In some cases, e.g., the muscarinic receptor, the missing loops from crystal structures are very long and we typically choose not to add them to the structure to be simulated. Instead the ends of the helices are capped.
When preparing the opioid receptor structures to simulate, we chose to remove the N-terminal fragment that is present in the activated MOR [35] and inactive DOR [33] crystal structures. The high flexibility of these fragments and the inability to sample their conformations thoroughly make the study of ligand binding more challenging in their presence than without them.
Building a MSM requires the selection of parameters (e.g., lag time, number of macrostates) which are dependent on the system of interest. Please see the documentation and tutorials on the http://emma-project.org webpage for more details.
References
- 1.Kruse AC, Ring AM, Manglik A, Hu J, Hu K, Eitel K, Hubner H, Pardon E, Valant C, Sexton PM, Christopoulos A, Felder CC, Gmeiner P, Steyaert J, Weis WI, Garcia KC, Wess J, Kobilka BK. Activation and allosteric modulation of a muscarinic acetylcholine receptor. Nature. 2013;504(7478):101–106. doi: 10.1038/nature12735. https://doi.org/10.1038/nature12735. [DOI] [PMC free article] [PubMed] [Google Scholar]
- 2.Oswald C, Rappas M, Kean J, Doré AS, Errey JC, Bennett K, Deflorian F, Christopher JA, Jazayeri A, Mason JS, Congreve M, Cooke RM, Marshall FH. Intracellular allosteric antagonism of the CCR9 receptor. Nature. 2016;540(7633):462–465. doi: 10.1038/nature20606. https://doi.org/10.1038/nature20606. [DOI] [PubMed] [Google Scholar]
- 3.Zheng Y, Qin L, Zacarías NVO, de Vries H, Han GW, Gustavsson M, Dabros M, Zhao C, Cherney RJ, Carter P, Stamos D, Abagyan R, Cherezov V, Stevens RC, Ijzerman AP, Heitman LH, Tebben A, Kufareva I, Handel TM. Structure of CC chemokine receptor 2 with orthosteric and allosteric antagonists. Nature. 2016;540(7633):458–461. doi: 10.1038/nature20605. https://doi.org/10.1038/nature20605. [DOI] [PMC free article] [PubMed] [Google Scholar]
- 4.Wootten D, Christopoulos A, Sexton PM. Emerging paradigms in GPCR allostery: implications for drug discovery. Nat Rev Drug Discov. 2013;12(8):630–644. doi: 10.1038/nrd4052. https://doi.org/10.1038/nrd4052. [DOI] [PubMed] [Google Scholar]
- 5.DeWire SM, Yamashita DS, Rominger DH, Liu G, Cowan CL, Graczyk TM, Chen X-T, Pitis PM, Gotchev D, Yuan C, Koblish M, Lark MW, Violin JD. A G protein-biased ligand at the μ-opioid receptor is potently analgesic with reduced gastrointestinal and respiratory dysfuncation compared with morphine. J Pharmacol Exp Ther. 2013;344:708–717. doi: 10.1124/jpet.112.201616. https://doi.org/10.1124/jpet.112.201616. [DOI] [PubMed] [Google Scholar]
- 6.Crowley RS, Riley AP, Sherwood AM, Groer CE, Shivaperumal N, Biscaia M, Paton K, Schneider S, Provasi D, Kivell BM, Filizola M, Prisinzano TE. Synthetic studies of neo-clerodane diterpenes from salvia divinorum: identification of a potent and centrally acting μ opioid analgesic with reduced abuse liability. J Med Chem. 2016;59(24):11027–11038. doi: 10.1021/acs.jmedchem.6b01235. https://doi.org/10.1021/acs.jmedchem.6b01235. [DOI] [PMC free article] [PubMed] [Google Scholar]
- 7.Schneider S, Provasi D, Filizola M. How oliceridine (TRV-130) binds and stabilizes a mu-opioid receptor conformational state that selectively triggers G protein signaling pathways. Biochemistry. 2016;55(46):6456–6466. doi: 10.1021/acs.biochem.6b00948. https://doi.org/10.1021/acs.biochem.6b00948. [DOI] [PMC free article] [PubMed] [Google Scholar]
- 8.Shang Y, Yeatman HR, Provasi D, Alt A, Christopoulos A, Canals M, Filizola M. Proposed mode of binding and action of positive allosteric modulators at opioid receptors. ACS Chem Biol. 2016;11(5):1220–1229. doi: 10.1021/acschembio.5b00712. https://doi.org/10.1021/acschembio.5b00712. [DOI] [PMC free article] [PubMed] [Google Scholar]
- 9.Dror RO, Green HF, Valant C, Borhani DW, Valcourt JR, Pan AC, Arlow DH, Canals M, Lane JR, Rahmani R, Baell JB, Sexton PM, Christopoulos A, Shaw DE. Structural basis for modulation of a G-protein-coupled receptor by allosteric drugs. Nature. 2013;503(7475):295–299. doi: 10.1038/nature12595. https://doi.org/10.1038/nature12595. [DOI] [PubMed] [Google Scholar]
- 10.Dror RO, Pan AC, Arlow DH, Borhani DW, Maragakis P, Shan Y, Xu H, Shaw DE. Pathway and mechanism of drug binding to G-protein-coupled receptors. Proc Natl Acad Sci U S A. 2011;108(32):13118–13123. doi: 10.1073/pnas.1104614108. [DOI] [PMC free article] [PubMed] [Google Scholar]
- 11.Kruse AC, Hu J, Pan AC, Arlow DH, Rosenbaum DM, Rosemond E, Green HF, Liu T, Chae PS, Dror RO, Shaw DE, Weis WI, Wess J, Kobilka BK. Structure and dynamics of the M3 muscarinic acetylcholine receptor. Nature. 2012;482:552–556. doi: 10.1038/nature10867. https://doi.org/10.1038/nature10867. [DOI] [PMC free article] [PubMed] [Google Scholar]
- 12.Stanley N, Pardo L, Fabritiis GD. The pathway of ligand entry from the membrane bilayer to a lipid G protein-coupled receptor. Sci Rep. 2016;6:22639. doi: 10.1038/srep22639. https://doi.org/10.1038/srep22639. [DOI] [PMC free article] [PubMed] [Google Scholar]
- 13.Laio A, Parrinello M. Escaping free-energy minima. Proc Natl Acad Sci U S A. 2002;99(20):12562–12566. doi: 10.1073/pnas.202427399. https://doi.org/10.1073/pnas.202427399. [DOI] [PMC free article] [PubMed] [Google Scholar]
- 14.Provasi D, Bortolato A, Filizola M. Exploring molecular mechanisms of ligand recognition by opioid receptors with metadynamics. Biochemistry. 2009;48(42):10020–10029. doi: 10.1021/bi901494n. https://doi.org/10.1021/bi901494n. [DOI] [PMC free article] [PubMed] [Google Scholar]
- 15.Friesner RA, Murphy RB, Repasky MP, Frye LL, Greenwood JR, Halgren TA, Sanschagrin PC, Mainz DT. Extra precision glide: docking and scoring incorporating a model of hydrophobic enclosure for protein–ligand complexes. J Med Chem. 2006;49(21):6177–6196. doi: 10.1021/jm051256o. https://doi.org/10.1021/jm051256o. [DOI] [PubMed] [Google Scholar]
- 16.Hamelberg D, Mongan J, McCammon JA. Accelerated molecular dynamics: a promising and efficient simulation method for biomolecules. J Chem Phys. 2004;120(24):11919–11929. doi: 10.1063/1.1755656. [DOI] [PubMed] [Google Scholar]
- 17.Kappel K, Miao Y, McCammon JA. Accelerated molecular dynamics simulations of ligand binding to a muscarinic G-protein-coupled receptor. Q Rev Biophys. 2015;48(4):479–487. doi: 10.1017/S0033583515000153. https://doi.org/10.1017/S0033583515000153. [DOI] [PMC free article] [PubMed] [Google Scholar]
- 18.Bhattacharya S, Vaidehi N. Differences in allosteric communication pipelines in the inactive and active states of a GPCR. Biophys J. 2014;107(2):422–434. doi: 10.1016/j.bpj.2014.06.015. https://doi.org/10.1016/j.bpj.2014.06.015. [DOI] [PMC free article] [PubMed] [Google Scholar]
- 19.Miao Y, Nichols SE, Gasper PM, Metzger VT, McCammon JA. Activation and dynamic network of the M2 muscarinic receptor. Proc Natl Acad Sci U S A. 2013;110(27):10982–10987. doi: 10.1073/pnas.1309755110. [DOI] [PMC free article] [PubMed] [Google Scholar]
- 20.Fiser A, Do RKG, Sali A. Modeling of loops in protein structures. Protein Sci. 2000;9:1753–1773. doi: 10.1110/ps.9.9.1753. [DOI] [PMC free article] [PubMed] [Google Scholar]
- 21.Rohl CA, Strauss CEM, Chivian D, Baker D. Modeling structurally variable regions in homologous proteins with rosetta. Proteins. 2004;55(3):656–677. doi: 10.1002/prot.10629. https://doi.org/10.1002/prot.10629. [DOI] [PubMed] [Google Scholar]
- 22.Jo S, Kim T, Iyer VG, Im W. CHARMM-GUI: a web-based graphical user interface for CHARMM. J Comput Chem. 2008;29(11):1859–1865. doi: 10.1002/jcc.20945. https://doi.org/10.1002/jcc.20945. [DOI] [PubMed] [Google Scholar]
- 23.Schmidt TH, Kandt C. LAMBADA and InflateGRO2: efficient membrane alignment and insertion of membrane proteins for molecular dynamics simulations. J Chem Inf Model. 2012;52(10):2657–2669. doi: 10.1021/ci3000453. https://doi.org/10.1021/ci3000453. [DOI] [PubMed] [Google Scholar]
- 24.Vanommeslaeghe K, MacKerell AD. Automation of the CHARMM general force field (CGenFF) I: bond perception and atom typing. J Chem Inf Model. 2012;52(12):3144–3154. doi: 10.1021/ci300363c. https://doi.org/10.1021/ci300363c. [DOI] [PMC free article] [PubMed] [Google Scholar]
- 25.Vanommeslaeghe K, Raman EP, MacKerell AD. Automation of the CHARMM general force field (CGenFF) II: assignment of bonded parameters and partial atomic charges. J Chem Inf Model. 2012;52(12):3155–3168. doi: 10.1021/ci3003649. https://doi.org/10.1021/ci3003649. [DOI] [PMC free article] [PubMed] [Google Scholar]
- 26.Vanommeslaeghe K, Hatcher E, Acharya C, Kundu S, Zhong S, Shim J, Darian E, Guvench O, Lopes P, Vorobyov I, Mackerell AD. CHARMM general force field: a force field for drug-like molecules compatible with the CHARMM all-atom additive biological force fields. J Comput Chem. 2010;31(4):671–690. doi: 10.1002/jcc.21367. https://doi.org/10.1002/jcc.21367. [DOI] [PMC free article] [PubMed] [Google Scholar]
- 27.Abraham MJ, Murtola T, Schulz R, Páll S, Smith JC, Hess B, Lindahl E. GRO-MACS: high performance molecular simulations through multi-level parallelism from laptops to supercomputers. SoftwareX. 2015;1–2:19–25. https://doi.org/10.1016/j.softx.2015.06.001. [Google Scholar]
- 28.Phillips JC, Braun R, Wang W, Gumbart J, Tajkhorshid E, Villa E, Chipot C, Skeel RD, Kalé L, Schulten K. Scalable molecular dynamics with NAMD. J Comput Chem. 2005;26(16):1781–1802. doi: 10.1002/jcc.20289. https://doi.org/10.1002/jcc.20289. [DOI] [PMC free article] [PubMed] [Google Scholar]
- 29.Tribello GA, Bonomi M, Branduardi D, Camilloni C, Bussi G. PLUMED 2: new feathers for an old bird. Comput Phys Commun. 2014;185(2):604–613. https://doi.org/10.1016/j.cpc.2013.09.018. [Google Scholar]
- 30.Humphrey W, Dalke A, Schulten K. VMD: visual molecular dynamics. J Mol Graph. 1996;14(1):33–38. doi: 10.1016/0263-7855(96)00018-5. https://doi.org/10.1016/0263-7855(96)00018-5. [DOI] [PubMed] [Google Scholar]
- 31.Delano WL. The PyMOL molecular graphics system. 2002 doi:citeulike-article-id:2816763. [Google Scholar]
- 32.Scherer MK, Trendelkamp-Schroer B, Paul F, Pérez-Hernández G, Hoffmann M, Plattner N, Wehmeyer C, Prinz J-H, Noé F. PyEMMA 2: a software package for estimation, validation, and analysis of Markov models. J Chem Theory Comput. 2015;11(11):5525–5542. doi: 10.1021/acs.jctc.5b00743. https://doi.org/10.1021/acs.jctc.5b00743. [DOI] [PubMed] [Google Scholar]
- 33.Fenalti G, Giguere PM, Katritch V, Huang XP, Thompson AA, Cherezov V, Roth BL, Stevens RC. Molecular control of delta-opioid receptor signalling. Nature. 2014;506(7487):191–196. doi: 10.1038/nature12944. https://doi.org/10.1038/nature12944. [DOI] [PMC free article] [PubMed] [Google Scholar]
- 34.Manglik A, Kruse AC, Kobilka TS, Thian FS, Mathiesen JM, Sunahara RK, Pardo L, Weis WI, Kobilka BK, Granier S. Crystal structure of the micro-opioid receptor bound to a morphinan antagonist. Nature. 2012;485(7398):321–326. doi: 10.1038/nature10954. https://doi.org/10.1038/nature10954. [DOI] [PMC free article] [PubMed] [Google Scholar]
- 35.Huang W, Manglik A, Venkatakrishnan AJ, Laeremans T, Feinberg EN, Sanborn AL, Kato HE, Livingston KE, Thorsen TS, Kling RC, Granier S, Gmeiner P, Husbands SM, Traynor JR, Weis WI, Steyaert J, Dror RO, Kobilka BK. Structural insights into micro-opioid receptor activation. Nature. 2015;524(7565):315–321. doi: 10.1038/nature14886. https://doi.org/10.1038/nature14886. [DOI] [PMC free article] [PubMed] [Google Scholar]
- 36.Wu EL, Cheng X, Jo S, Rui H, Song KC, Davila-Contreras EM, Qi Y, Lee J, Monje-Galvan V, Venable RM, Klauda JB, Im W. CHARMM-GUI membrane builder toward realistic biological membrane simulations. J Comput Chem. 2014;35(27):1997–2004. doi: 10.1002/jcc.23702. https://doi.org/10.1002/jcc.23702. [DOI] [PMC free article] [PubMed] [Google Scholar]
- 37.Lee J, Cheng X, Swails JM, Yeom MS, Eastman PK, Lemkul JA, Wei S, Buckner J, Jeong JC, Qi Y, Jo S, Pande VS, Case DA, Brooks CL, 3rd, AD MK, Jr, Klauda JB, Im W. CHARMM-GUI input generator for NAMD, GROMACS, AMBER, OpenMM, and CHARMM/OpenMM simulations using the CHARMM36 additive force field. J Chem Theory Comput. 2016;12(1):405–413. doi: 10.1021/acs.jctc.5b00935. https://doi.org/10.1021/acs.jctc.5b00935. [DOI] [PMC free article] [PubMed] [Google Scholar]
- 38.Shaw DE, Deneroff MM, Dror RO, Kuskin JS, Larson RH, Salmon JK, Young C, Batson B, Bowers KJ, Chao JC, Eastwood MP, Gagliardo J, Grossman JP, Ho CR, Ierardi DJ, In K, Jl K, Layman T, Mcleavey C, Moraes MA, Mueller R, Priest EC, Shan Y, Spengler J, Theobald M, Towles B, Wang SC. Anton, a special-purpose machine for molecular dynamics simulation. Commun ACM. 2008;51(7):91–97. https://doi.org/10.1145/1364782.1364802. [Google Scholar]
- 39.Raiteri P, Laio A, Gervasio FL, Micheletti C, Parrinello M. Efficient reconstruction of complex free energy landscapes by multiple walkers metadynamics. J Phys Chem B. 2006;110(8):3533–3539. doi: 10.1021/jp054359r. https://doi.org/10.1021/jp054359r. [DOI] [PubMed] [Google Scholar]
- 40.Tiwary P, Parrinello M. A time-independent free energy estimator for metadynamics. J Phys Chem B. 2015;119(3):736–742. doi: 10.1021/jp504920s. https://doi.org/10.1021/jp504920s. [DOI] [PubMed] [Google Scholar]
- 41.Sander J, Ester M, Kriegel H-P, Xu X. Density-based clustering in spatial databases: the algorithm GDBSCAN and its applications. Data Min Knowl Disc. 1998;2(2):169–194. https://doi.org/10.1023/A:1009745219419. [Google Scholar]
- 42.Beauchamp KA, Bowman GR, Lane TJ, Maibaum L, Haque IS, Pande VS. MSMBuilder2: modeling conformational dynamics on the picosecond to millisecond scale. J Chem Theory Comput. 2011;7(10):3412–3419. doi: 10.1021/ct200463m. https://doi.org/10.1021/ct200463m. [DOI] [PMC free article] [PubMed] [Google Scholar]
- 43.Collier G, Ortiz V. Emerging computational approaches for the study of protein allostery. Arch Biochem Biophys. 2013;538(1):6–15. doi: 10.1016/j.abb.2013.07.025. https://doi.org/10.1016/j.abb.2013.07.025. [DOI] [PubMed] [Google Scholar]
- 44.Feher VA, Durrant JD, Van Wart AT, Amaro RE. Computational approaches to mapping allosteric pathways. Curr Opin Struct Biol. 2014;25:98–103. doi: 10.1016/j.sbi.2014.02.004. https://doi.org/10.1016/j.sbi.2014.02.004. [DOI] [PMC free article] [PubMed] [Google Scholar]
- 45.Stolzenberg S, Michino M, LeVine MV, Weinstein H, Shi L. Computational approaches to detect allosteric pathways in transmembrane molecular machines. Biochim Biophys Acta. 2016;1858(7, Part B):1652–1662. doi: 10.1016/j.bbamem.2016.01.010. https://doi.org/10.1016/j.bbamem.2016.01.010. [DOI] [PMC free article] [PubMed] [Google Scholar]
- 46.Fanelli F, Felline A. Dimerization and ligand binding affect the structure network of A2A adenosine receptor. Biochim Biophys Acta Biomembr. 2011;1808(5):1256–1266. doi: 10.1016/j.bbamem.2010.08.006. https://doi.org/10.1016/j.bbamem.2010.08.006. [DOI] [PubMed] [Google Scholar]
- 47.Michino M, Free RB, Doyle TB, Sibley DR, Shi L. Structural basis for Na+−sensitivity in dopamine D2 and D3 receptors. Chem Commun. 2015;51(41):8618–8621. doi: 10.1039/c5cc02204e. https://doi.org/10.1039/C5CC02204E. [DOI] [PMC free article] [PubMed] [Google Scholar]
- 48.Angelova K, Felline A, Lee M, Patel M, Puett D, Fanelli F. Conserved amino acids participate in the structure networks deputed to intramolecular communication in the lutropin receptor. Cell Mol Life Sci. 2011;68(7):1227–1239. doi: 10.1007/s00018-010-0519-z. https://doi.org/10.1007/s00018-010-0519-z. [DOI] [PMC free article] [PubMed] [Google Scholar]
- 49.Kong Y, Karplus M. The signaling pathway of rhodopsin. Structure. 2007;15(5):611–623. doi: 10.1016/j.str.2007.04.002. https://doi.org/10.1016/j.str.2007.04.002. [DOI] [PubMed] [Google Scholar]
- 50.Isin B, Schulten K, Tajkhorshid E, Bahar I. Mechanism of signal propagation upon retinal isomerization: insights from molecular dynamics simulations of rhodopsin restrained by normal modes. Biophys J. 2008;95(2):789–803. doi: 10.1529/biophysj.107.120691. https://doi.org/10.1529/biophysj.107.120691. [DOI] [PMC free article] [PubMed] [Google Scholar]
- 51.LeVine MV, Perez-Aguilar JM. Weinstein H N-body information theory (NbIT) analysis of rigid-body dynamics in intracellular loop 2 of the 5-HT2A receptor. In: Ortuño F, Rojas I, editors. International Work-Conference on Bioinformatics and Biomedical Engineering; Granada. 2014. [Google Scholar]
- 52.Perez-Aguilar JM, Shan J, LeVine MV, Khelashvili G, Weinstein H. A functional selectivity mechanism at the serotonin-2A GPCR involves ligand-dependent conformations of intracellular loop 2. J Am Chem Soc. 2014;136(45):16044–16054. doi: 10.1021/ja508394x. https://doi.org/10.1021/ja508394x. [DOI] [PMC free article] [PubMed] [Google Scholar]
- 53.LeVine MV, Weinstein H. NbIT - a new information theory-based analysis of allosteric mechanisms reveals residues that underlie function in the leucine transporter LeuT. PLoS Comput Biol. 2014;10(5):e1003603. doi: 10.1371/journal.pcbi.1003603. https://doi.org/10.1371/journal.pcbi.1003603. [DOI] [PMC free article] [PubMed] [Google Scholar]