. 2017 Dec 27;6:e31683. doi: 10.7554/eLife.31683

Figure 1. TF-dependent noncoding transcription defines regulatory elements.

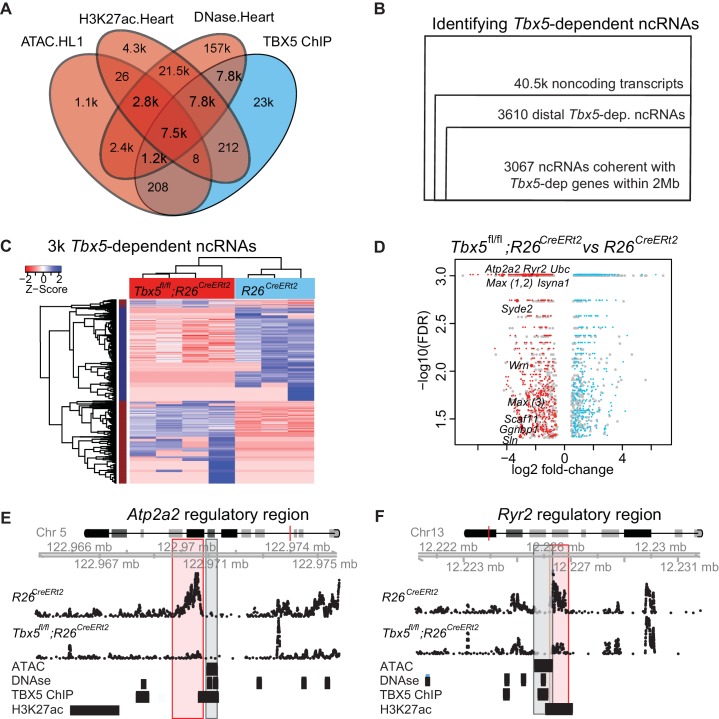
(A) Venn-diagram of peak call overlaps for HL-1 ATAC-sequencing (ATAC.HL1), histone 3 lysine 27 acetylation in mouse heart (H3K27ac.Heart, GSE52123), DNase hypersensitivity in mouse heart (DNase.heart, ENCODE) and TBX5 ChIP-seq (TBX5.HL1, GSE21529). (B) Workflow for identifying TF-dependent ncRNAs. Total noncoding transcripts from mouse left atrium were narrowed to Tbx5-dependent distal intergenic ncRNAs, defined as >1 kbp away from the known transcriptional start sites of known coding genes (GENCODE mm10), and narrowed again to coherent changes with nearby Tbx5-dependent genes within a 2-Mbp window. (C). Heatmap of identified Tbx5-dependent ncRNAs in Tbx5fl/fl;R26CreERt2 (red, left) and corresponding R26CreERt2 control (blue, right) in left atrial tissue. The hierarchical cluster analysis is based on the Euclidean distances of normalized sequencing counts. 1577 Tbx5-activated ncRNAs were downregulated after Tbx5 deletion and 1490 Tbx5-repressed ncRNAs were upregulated after Tbx5 deletion across n = 5 and n = 3 resp. (D) Volcano-plot of significantly misregulated TF-dependent ncRNAs, select identifications were labeled by nearest TBX5-dependent gene. Plot of log2 fold-change of ncRNAs in Tbx5fl/fl;R26CreERt2 compared to R26CreERt2 vs –log10 false discovery rate (FDR) for the same comparison (FDR < 0.05, |FC| > 2). The ncRNAs within 2 Mb of coherently mis-expressed TBX5-dependent genes are red or blue for activated and repressed, respectively. Gray dots represent those ncRNAs without coherently mis-expressed coding genes in the 2-Mb window. (E, F) Example genomic views of two of the most significantly TF-dependent ncRNAs, adjacent to the Atp2a2 (E) and Ryr2 (F) genes, respectively. Top track is chromosomal location, followed by the ncRNA read density from R26CreErt2control and Tbx5fl/fl;R26CreERt2. Below is ATAC-Seq peak call in HL-1 cells, cardiac DNase hypersensitivity (ENCODE), TBX5 ChIP-seq (GSE21529) and cardiac H3k27 acetylation (GSE52123). The identified differential ncRNA is marked in the red box, and the putative regulatory element, as defined by the enhancer marks above, is marked in the gray box.

Figure 1.

Figure 1—figure supplement 1. Genomic features of the identified TF-dependent ncRNAs recapitulate known features of annotated lincRNAs.

Figure 1—figure supplement 1.

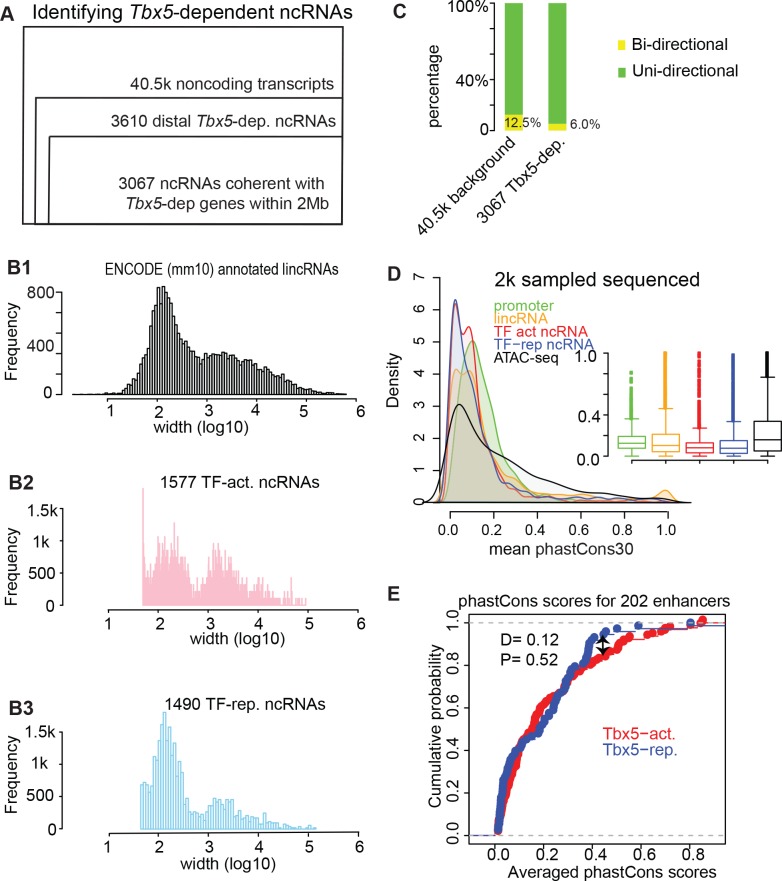
(A) Pie chart showing the composition for the identified TBX5-dependent ncRNAs using de novo assembly (Cufflinks). The 3067 ncRNAs were categorized into six groups. GENCODE (mm10)-annotated ncRNAs with relatively few instances were grouped together as ‘predicted ncRNAs’. De novo indicates a previously unannotated noncoding transcript. (B) Histogram distribution of the ncRNA width on log10 scale. The distribution of GENCODE annotated lincRNAs (B1), the identified TF-activated ncRNAs (B2), and the TF-repressed ncRNAs (B3) are shown. (C) Stacked bar-graphs showing percentage of unidirectional (green) and bi-directional (yellow) noncoding transcripts among the total noncoding transcript calls, the Tbx5-activated ncRNAs, and the Tbx5-repressed ncRNAs. (D) Histograms and boxplots of average phastCons30 sequence conservation scores for promoter regions (green), GENCODE annotated lincRNAs (yellow), TBX5-activated and TBX5-repressed ncRNAS (red and blue, respectively), and ATAC-Seq (black). (E) Two-sample Kolmogorov–Smirnov statistics. The cumulative probabilities exhibit no difference in conservation between Tbx5-activated and Tbx5-repressed cis-regulatory elements (red and blue lines, respectively).

Figure 1—figure supplement 2. Genomic view of nine TF-dependent ncRNAs (mm9).

Figure 1—figure supplement 2.

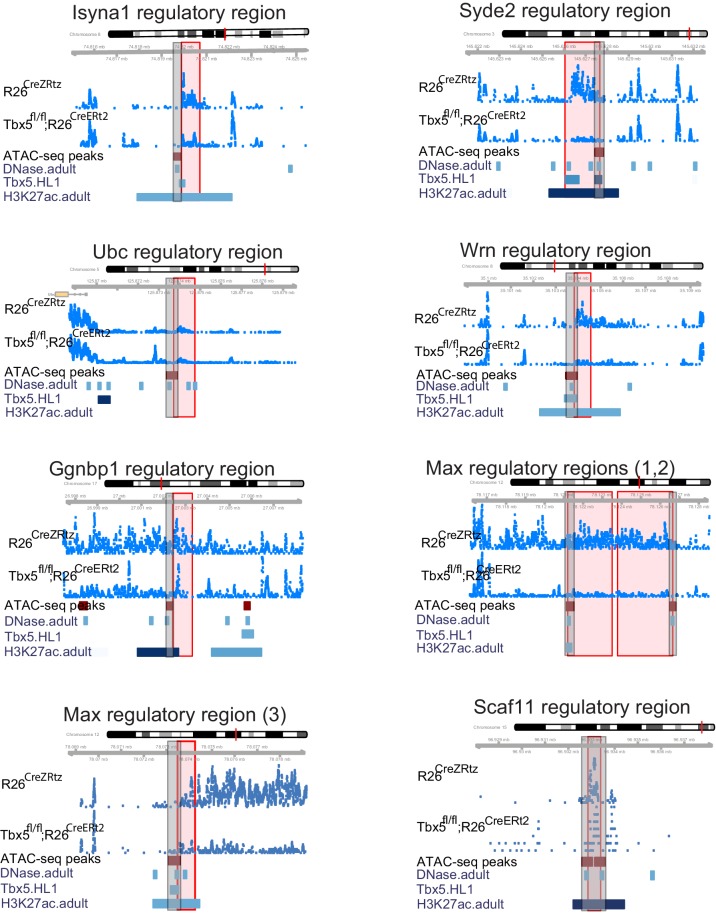
Long noncoding RNAs (lncRNAs) are labeled by nearest TBX5-dependent coding gene. Top track is chromosomal location, followed by the ncRNA read density from R26CreErt2 control and Tbx5fl/fl;R26CreERt2. Below is ATAC-Seq peak call in HL-1 cells, cardiac DNase hypersensitivity (ENCODE), TBX5 ChIP-seq (GSE21529) and cardiac H3k27 aAcetylation (GSE52123). The identified differential ncRNA is marked in the red box, the putative regulatory element as defined by the enhancer marks above is in the gray box.

Figure 1—figure supplement 3. Identifying TF-dependent ncRNA targets from TF-dependent expressed genes.

Figure 1—figure supplement 3.

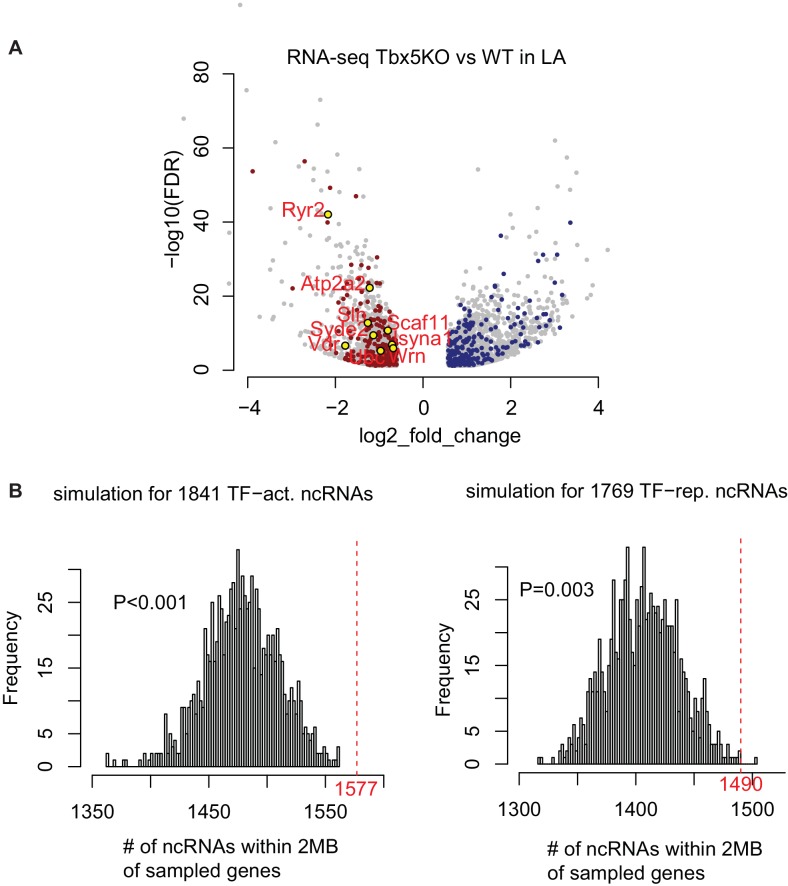
(A) TF-dependent genes are coherent with TF-dependent ncRNAs. Volcano-plot of TF-dependent genes (FDR < 0.05, |FC| > 1.5). Genes residing within 2 Mb of coherently TBX5-dependent ncRNAs are colored red for Tbx5-activated, blue for Tbx5-repressed ncRNAs. (B) Simulation study shows the empirical significance of Tbx5-dependent ncRNAs within a 2-Mb window of Tbx5-dependent coding-genes. The histograms show the distribution of randomly sampled ncRNAs within 2 Mb window of randomly sampled genes. The red dashed line showing the observed number iof Tbx5-activated or Tbx5-repressed ncRNAs, respectively. An empirical P-value was calculated.

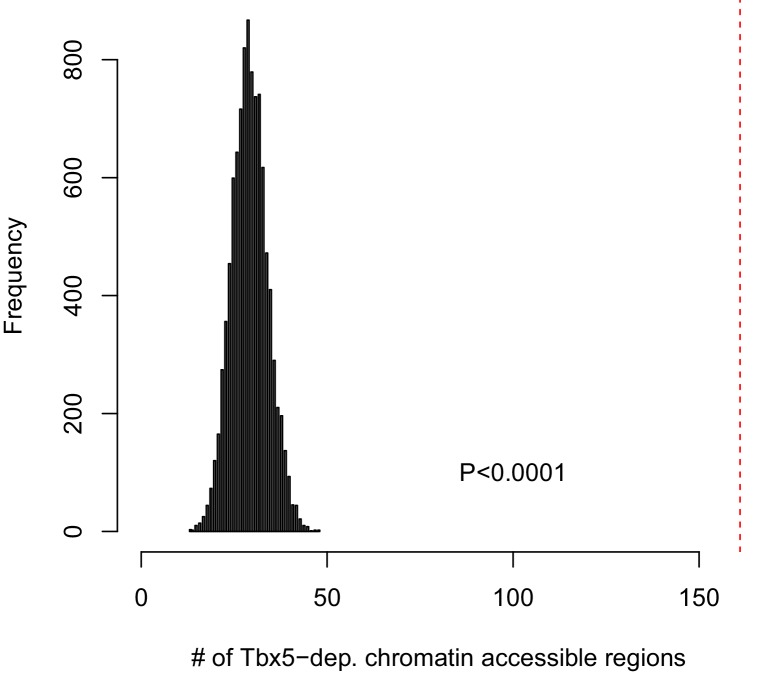
Figure 1—figure supplement 4. Identifying TF-dependent ncRNA targets from open chromatin regions.

Figure 1—figure supplement 4.

161 Tbx5-dependent ncRNAs at open chromatin regions were determined by the overlap between ncRNAs and ATAC peaks (allowing up to 500-bp edge-to-edge distance). The empirical significance of Tbx5-dependent ncRNAs at open chromatin regions was determined by comparing the observed overlap (161 ncRNAs) with that estimated by simulation using randomly sampled noncoding transcripts within this distance to total open chromatin regions. The histogram shows the distribution of the number of regions with overlap from each simulation, performed 10,000 times. In contrast, the red dashed line shows the observed number for the identified Tbx5-dependent transcripts. In every case, the simulation estimated a lower number, resulting in an empirical P-value (p<0.0001).