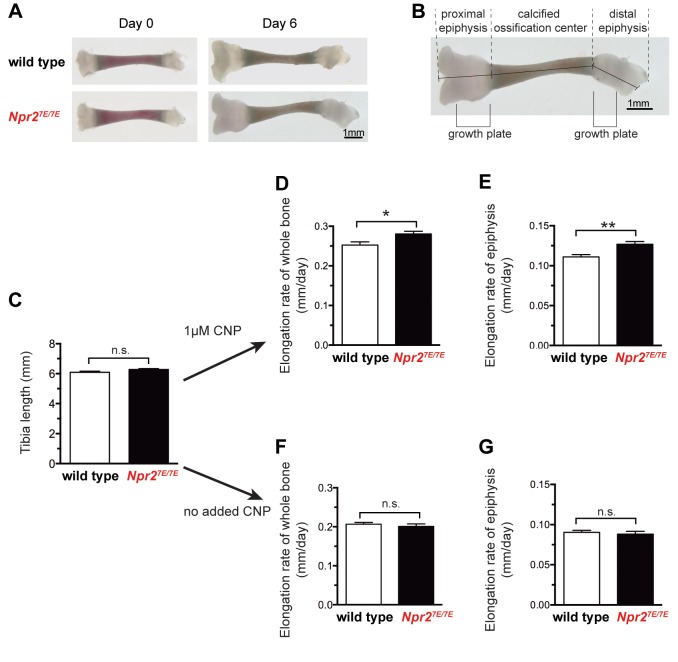
Figure 2. Npr27E/7E mice have longer bones due to a direct effect on the bone.
(A) Representative wild type and Npr27E/7E tibia from 3 to 4 day old mice, cultured in vitro for 6 days in the presence of 1 μM CNP. (B) Diagram showing the methods of measurement, and the position of the growth plates. Graphs C,D, and F depict measurements of the sum of the three indicated lengths: the proximal epiphysis (left), the calcified ossification center, and the distal epiphysis (right). Graphs E and G depict measurements of the length of the proximal epiphysis only. For graphs D-G, the elongation rate was determined by subtracting the length at day 0 from the length at day 6, and dividing by 6 days. (C) Tibia length immediately after dissection. 44 wild type and 79 Npr27E/7E bones were measured. (D,E) Rates of bone elongation in the presence of 1 μM CNP. (D) shows the elongation rate of the entire bone, and E shows the elongation rate of the proximal epiphysis. 21 wild type and 41 Npr27E/7E bones were measured. (F,G) Rates of bone elongation in the absence of added CNP. (F) shows the elongation rate of the entire bone, and G shows the elongation rate of the proximal epiphysis. 23 wild type and 38 Npr27E/7E bones were measured. Data were analyzed by unpaired t-tests. *p≤0.05; **p≤0.01.

