Abstract
Cardiovascular diseases are closely related to structural blood capillaries lesions. Herein, microscopic investigations of mouse blood capillaries were performed at multiple spatial resolution by using synchrotron X-ray in-line phase contrast tomography and scanning transmission X-ray microscopy (STXM). The chemically fixed blood capillaries without any contrast agents were selected. For the first time, a periodic bamboo-shaped structure was observed at nanoscale resolution by STXM, and the three-dimensional tomographic slices at sub-micrometer resolution further confirmed the periodic wave profile of the blood capillaries. Then, a periodic microstructural model was suggested based on the microscopic images. By using high-performance imaging techniques, this work provides a better understanding of the relationship between the structure and function of blood capillaries, will be helpful in elucidating the causes of cardiovascular system diseases.
OCIS codes: (170.0180) Microscopy, (170.3880) Medical and biological imaging, (180.7460) X-ray microscopy, (170.7440) X-ray imaging, (110.6955) Tomographic imaging
1. Introduction
Blood capillaries are the most widely distributed vessels in the human body. Without capillaries substance exchange between blood and tissues is impossible. More importantly, vessel lesions especially that of capillaries are closely related to cardiovascular disease development. For example, the common microvascular lesions caused by diabetes can damage multiple target organs, including the retina, kidney and myocardium [1]. The distortion of blood capillaries can lead to myocardial ischemia in hypertensive cardiomyopathy [2]. The generation and deterioration of solid tumors is directly related to tumor vasculature [3–5], leading to the development of antiangiogenic therapies [6, 7]. Therefore, to view the blood vessels straightforwardly is crucial to understanding the related mechanisms. Yet the small size of blood capillaries make it difficult to perform microscopic structural analysis.
In recent years, increasing types of biological samples have been studied by various X-ray microscopies, such as phase contrast micro-tomography and zone plate based scanning/full-field transmission X-ray microscopy. The microscopies can perform structural analysis at high resolution without destroy the tested samples owe to the strong penetration power and short wavelength of X-rays [8–12]. Especially with the development of synchrotron radiation light sources worldwide, X-ray microscopies show broader biological applications. To realize sub-micrometer resolution structures of blood capillaries, phase contrast X-ray tomography is a good choice. The advantage of phase-contrast X-ray tomography is the high phase contrast to low-Z materials such as biological tissues compared with that of conventional absorption-based imaging techniques [13]. Phase contrast techniques are based on the Fresnel diffraction theory, whereby tiny density differences can cause obvious phase variations during X-ray propagation [14–16]. Among different phase contrast imaging techniques, the in-line phase contrast method renders high quality three-dimensional images with lower complexity [15–18]. With the aid of the high phase contrast sensitivity of X-rays, mass regions of dense lipid and muscle were identified in macroscopic coronary arteries containing atherosclerotic plaques [19].
Owing to the minimal size of blood capillaries, higher resolution studies are necessary to recognize internal structures [20]. Soft X-rays (0.1~2 keV) are less penetrating but more easily focused using a zone plate than hard X-rays [21]. Due to focusing element advances, the focused soft X-ray spot has been narrowed to 30~50 nm. Thus, scanning transmission soft X-ray microscopy (STXM) has gained substantial attention due to the higher resolution [22–25]. STXM has recently shown broad applications in various fields, such as energy science, materials science, especially in biological science for cellular imaging [22, 26–28].
In this paper, for the first time, we investigated the microstructure of blood capillaries near the mouse aorta by using synchrotron X-ray microscopy at multiple spatial resolutions non-destructively. A periodic bamboo-shaped microstructure was observed by using both hard X-ray in-line phase contrast tomography and scanning transmission soft X-ray microscopy (STXM). The study realized the microscopic analysis of blood capillaries, and provided a better understanding of the relationship between the structure and function.
2. Materials and methods
2.1 Blood capillaries collection
The experimental protocol conformed to the National Institutes of Health Guide for the Care and Use of Laboratory Animals. Blood capillaries were obtained from three mice. The aorta of the mouse, including abundant blood capillaries from the aortic arch to crotch of the iliac artery, was collected 24 h after sacrifice and fixed in 4% formalin for 48 h. Then, the vessels were immersed in water for 30 min, followed by treatment with 70% ethanol 12 hours, 80% ethanol for 1 h, 90% ethanol for 1 h, 95% ethanol for 1 h, 100% ethanol for 30 min and another solution of 100% ethanol for 30 min. At last the blood capillaries were dried under vacuum condition.
2.2 Scanning transmission soft X-ray microscopy (STXM)
The STXM experiment was performed at the 08U1A beamline of Shanghai Synchrotron Radiation Facility (SSRF) (Fig. 1). Monochromatic soft X-rays at a specific energy were selected and then focused to a spot by the zone plate (ZP). The stray high order diffraction light of ZP were filtered out by an order-sorting aperture. Then the X-rays transmitted the sample were recorded by a photomultiplier tube. By raster scanning horizontally and vertically of a piezoelectric sample stage with nanometer precision, 2D projection images formed.
Fig. 1.
Schematic diagram of soft X-ray transmission microscopy (STXM).
Considering the thickness of blood capillaries and X-ray flux, 1.6 keV monochromatic X-rays were selected. The blood capillary was fixed on a 30-nm-thick silicon nitride membrane. The membrane was then stick to a sample holder. The sample holder was inserted onto the piezoelectric stage. Both the X-ray spot and the scanning step were set to 50 nm. The exposure time was adjusted to 4 ms. The total time for a projection is about 20 minutes. The projection was normalized by using Beer–Lambert law, and the absorption coefficient was achieved.
2.3 In-line phase contrast X-ray tomography
The experiment was performed at the X-ray imaging and biomedical application beamline (BL13W1) of SSRF (Fig. 2). Monochromatic X-rays with a specific energy were selected from white light X-rays using the monochromator. A slit was inserted into the light path to control the field of view. The distance between the sample and CCD detector was determined by both image contrast and Fresnel diffraction theory. When X-ray beams travelled through the sample, the downstream beams carried the absorption and phase shift information. After propagating specific distance, the phase-shifts in the downstream beams are transformed into measurable intensity variations by Fresnel diffraction. The CCD detector was used to record 2D projections at different angles when the sample rotated from 0° to 180°.
Fig. 2.
Schematic diagram of in-line phase contrast X-ray microscopy.
In the experiment, to make the best of in-line phase contrast imaging and obtain a high signal-to-noise ratio, the distance of the sample to CCD detector was adjusted to 15 cm, and the exposure time was set to 8 s for one projection with X-ray energy of 12 keV. A CCD detector with a maximum display resolution of 2048 × 2048 pixels was used to collect projections at 0.65 μm pixel resolution. Before the image acquisition, a calibration process was strictly performed to make the sample rotating platform axis parallel to the CCD camera. The detector collected 1200 projection images from 0° to 180° with a 0.15° rotation interval. The experimental parameters were determined by taking into account the size of the sample, radiation damage, experimental time and the detector pixel size at the same time [10, 15-16]. Two flat images without sample in beam path were collected every 200 projections used to calibrate the background. At last, 5 dark images, without X-rays in the beam path, were recorded to eliminate the CCD dark noises. The total time of the data acquisition was 12600 s. During the experiment all samples were chemically fixed and dehydrated. The pre-preparation of samples make ultra-structures stable under irradiation. Moreover, high energy X-rays (12 keV) was used in the experiment. Owe to the high penetration power, most X-rays passed through the samples, rather than were absorbed. The absorbed doses was limited to minimum, and there was no radiation damages observed.
The tomographic reconstruction, including background correction, rotating axis position correction, and filtered back projection (FBP) reconstruction, were carried out by a CT software compiled by the BL13W1 station [29, 30]. A Shepp-Logan filter was used. Reconstruction of a tomographic slice (1400 × 1400 pixels) takes about 0.6 s using a HP Z800 workstation (Dual Intel Xeon X5675 3.07 Hz). The projections were directly reconstructed without phase retrievals. In this case the intensity corresponds to the second derivative of the refractive index, showing the effect of edge enhancement, by which the characteristic microstructures with obvious boundaries can be visualized. Subsequently, the three-dimensional images of the sample were visualized with Amira software.
3. Results and discussion
3.1 Two-dimensional structural analysis at nanoscale resolution
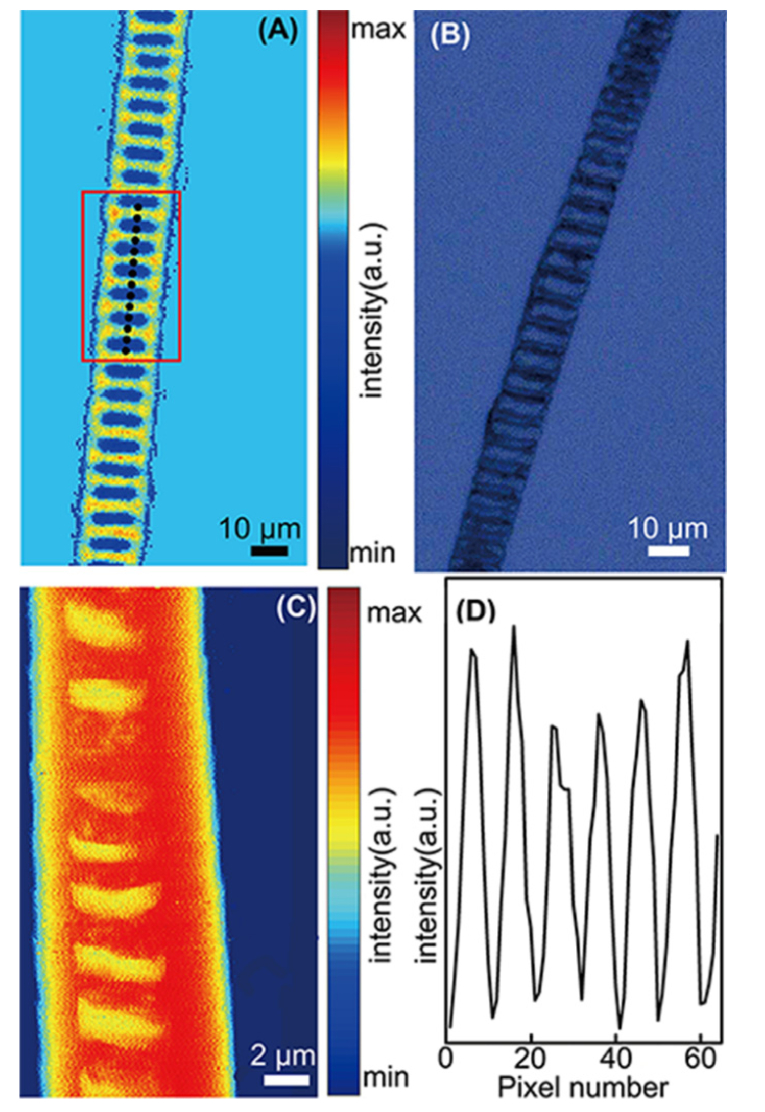
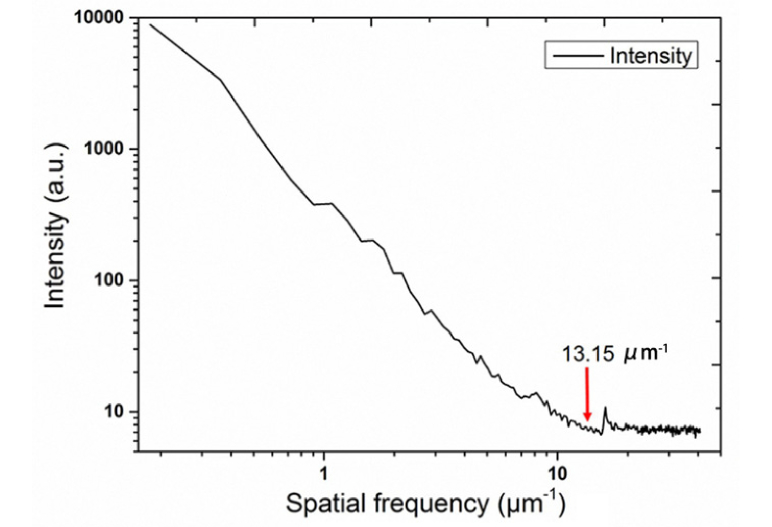
A periodic bamboo-shaped structure of blood capillaries from different mice was observed using in-line phase contrast X-ray radiography (Fig. 3(a)), transmission optical microscopy (Fig. 3(b)), and soft X-ray scanning transmission microscopy (Fig. 3(c)). The diameter of the capillaries were 20 μm (Fig. 3(a)), 12.5 μm (Fig. 3(b)), and 8 μm (Fig. 3(c)) respectively. The periodic structures can be observed roughly in optical image (B) while clear in the in-line phase contrast X-ray radiography. A line scan (Fig. 3(d)) was used to analyse the periodic profile (Fig. 3(a)). The periodic blue regions are similar to shape of “windows” whose width and length are ~4 μm and 12 μm (Fig. 3(a)). Notably, in comparison with the other two imaging methods, STXM provides more precise images with 50 nm pixel resolution (Fig. 3(c)). In addition, we calculated the resolution by using the power spectral density (PSD) (Fig. 4). Noises brought by the fluctuation of X-rays or instability of detector decreased the cut-off frequency to be 13.15 μm−1, and the responding spatial resolution in real space was approximately 76 nm. In theory, single cells could be resolved in the capillaries at the nanoscale resolution. But here only continuous structures were observed. This maybe owe to that the capillaries were chemical fixed and the structures were changed during the process. In this case for smaller capillaries the fine structures indicated that the window edges were not straight but rough. The width and length of the periodic structures are roughly ~2 μm and 4 μm (Fig. 3(c)). These fine structures could not be observed clearly in the optical images and in-line phase contrast X-ray radiography. Compared with the capillary thickness, the “window” length represents the inner diameter of the blood channel, the blood channels have different occupancy levels ranging from 40% to 60% in different blood capillaries.
Fig. 3.
2D images of three different blood capillaries observed by different methods at various spatial resolutions. (A) In-line phase contrast X-ray radiography. The red rectangle labels a small section used for line scan analysis. (B) Optical image. (C)STXM image. (D) The line scan of the region labelled in the red rectangle.
Fig. 4.
The power spectral density (PSD) reveals that the STXM resolution was ~76 nm.
3.2 Three-dimensional microstructural analysis
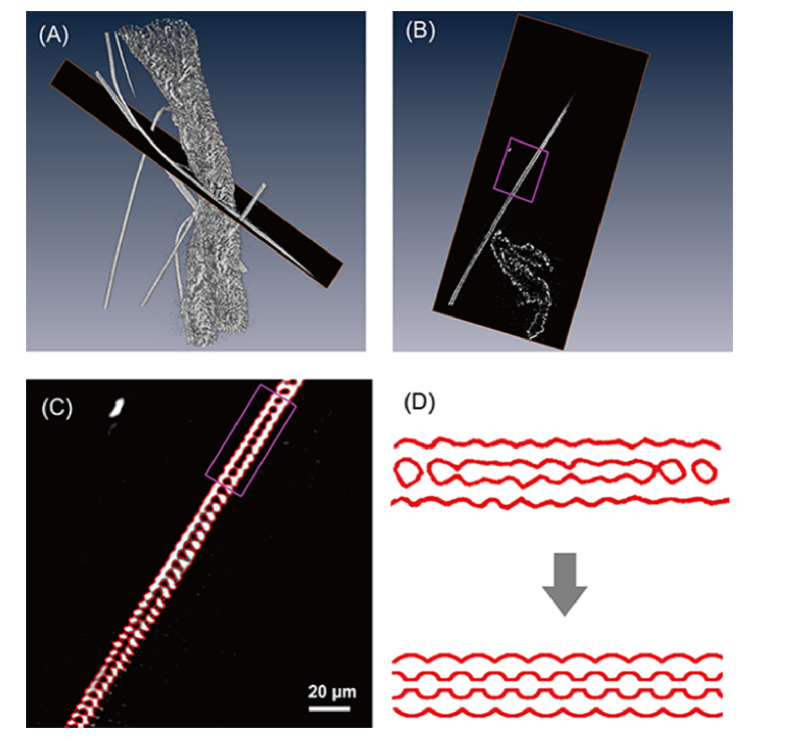
Two-dimensional projection image is the result of overlapping layers from the X-ray transmission between the source and the detector. Thus three-dimensional reconstruction is necessary to directly observe the internal structures. 3D tomographic reconstruction provide the internal structures, and could realize the data analyse slice by slice (Fig. 5). A 3D movie of micro-CT as supplementary materials (see Visualization 1 (24.8MB, mpg) ) is supplied to understand the structure. A virtual cross-section can be extracted non-destructively from the 3D images (Fig. 5(a), 5(b)).Figure 5(c) illustrates the details of the extracted blood capillary, and the profile of high densities was depicted by red curves. A numerical model was suggested based on the phase contrast tomographic virtual slice (Fig. 5(c)) and 2D STXM images (Fig. 3(c)). As shown in Fig. 5(d), the original model abstracted from a tomographic slice (Fig. 5(c)) is so rough that the periodic structures were hardly recognized. Phase contrast microscopy, which is limited by the resolution, only provides the rough frame. Then the model was further modified with the help of STXM images (Fig. 3(c)) and the final model was achieved. Based on the morphology of the capillary, the periodic structure model was suggested (Fig. 5(d)). Externally, it appears as a wave shape. Inside of the capillary, blood flows through the channel at an uneven width. Because the blood capillary is not straight, not all of the slices cut along the thickest position of the blood capillary. Hence, some positions appear upright with many truncations.
Fig. 5.
(A) 3D rendering of a blood capillary (see Visualization 1 (24.8MB, mpg) ). (B) A virtual slice extracted from the 3D image. (C) Zoomed-in view of the blood capillary. The red curve was plotted along its profile. (D) The contour and periodic structure model suggested.
3.3 Structure-function relationship and potential mechanism analysis
Because of the oxygen and energy demands of millions and millions of cells or tissues, blood capillaries are the most widely distributed vessels in mammals. Unlike a smooth surface, a wavy surface increases the surface area between blood and capillaries, and the increased surface area improves the efficiency of substance exchange between blood and tissues.
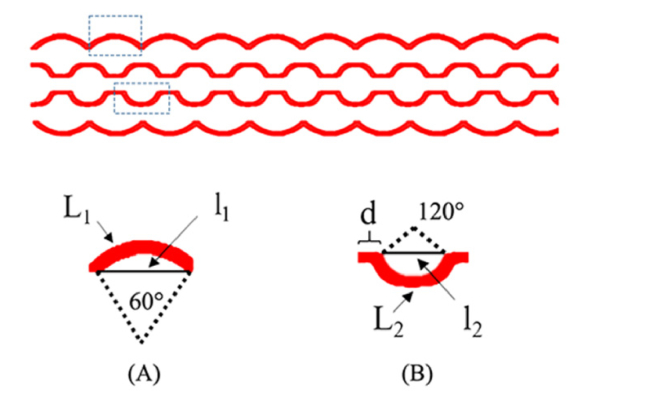
In this study, we performed the structural analysis of different capillaries at multiscale resolution by using phase contrast X-ray tomography and STXM. By analysing the structure of capillaries from micron to nanoscale resolution, we suggested a numerical model. According to the model (Fig. 6), an approximate value R that represents the increased rate of substance exchange can be calculated by the following equations:
| (1) |
| (2) |
| (3) |
in which R1 and R2 represent the external (Fig. 6(a)) and internal (Fig. 6(b)) substance exchange rates; L1 and L2 represent the external arc and internal arc; l1 (4 µm) and l2 (2.5 µm) represent the external and internal chord; and d (0.75 µm) represents the internal straight length. According to the basic geometric calculation, the increased rate of substance exchange R was calculated as 17.2%.
Fig. 6.
(A) Outside surface of wave structure. L1, arc length; r, radius; l1 chord length. The central angle is 60°. (B) Inside surface of wave structure. L2, arc length; l2, chord length; d, straight length of the capillary. The central angle is ~120°.
The substance exchange rate will increase based on geometric calculations. But this structural trait might include hidden dangers. The uneven or wave profile inside a blood capillary might easily cause blockage when high blood fat levels are present. Most cardiovascular diseases are closely related to the blood vessel lesions. However, structural analysis of blood capillaries at sub-micrometre resolution is quite difficult and seldom reported. The periodic bamboo-shaped structure provides a better understanding of the relationship between the structure and function. Moreover, the capillaries in the study were chemical fixed and further studies of capillaries in the native state will be performed later.
Herein the cutting-edge imaging techniques at synchrotron facilities, i.e. phase contrast X-ray tomography and STXM, were applied to study the multiply-scale structures of mouse blood capillaries at microscale to nanoscale resolution. Phase contrast microscopy is based on the phase shift of X-ray. For low-Z materials such as soft tissues imaged with high energy X-ray, phase variations can be two to three orders of magnitude larger than the absorption ones, and increased image contrast can be achieved [15, 16]. We used in-line phase contrast X-ray tomography, the simplest and the most straightforward among all types of the phase contrast microscopy, to noninvasively investigate the external morphology and internal microstructures of capillaries. By taking advantage of the effect of edge enhancement, 3D fine structures of the blood capillaries were achieved non-destructively. Traditionally, the microstructures can be achieved by histological section, in which serial sections are stained and observed by light microscopy or scanning and transmission electron microscopy. However, the anatomical approaches are destructive and time consuming, making measurements of large numbers of samples impractical. This work exhibited high efficiency, high precision, and wide potential applications of synchrotron X-ray phase contrast tomography in non-destructive investigation of biology. Using STXM, we performed structural analysis of blood capillaries at ~76 nm resolution. In this case, more structural details that are difficulty to observe in phase contrast microscopy at micron resolution were observed. However, with higher spatial resolution and lower penetration depth of soft X-ray used, the sample size was limited. The diameter of capillaries in STXM is less than 10 µm while 20-30 µm even larger in phase contrast microscopy.
By combining the two X-ray microscopies, microstructures of biological specimens were achieved efficiently and precisely from microscale to nanoscale resolution. The multiple scale approach points to the future of the X-ray imaging, which shows broader applications in biology.
4. Conclusions
In summary, microscopic investigations of mouse blood capillaries were performed at multiple spatial resolution by using synchrotron X-ray in-line phase contrast tomography and scanning transmission X-ray microscopy. For the first time, the periodic structure of the capillaries with the wave profile was observed, and a model was suggested based on microscopic images. The model imply that the wave profile of the blood capillary increases the efficiency of substance exchange.
Acknowledgments
We thank the staff at the Shanghai Synchrotron Radiation Facility (13W1 and 08U1) for the assistance with data acquisition.
Funding
Natural Science Foundation of China (NSFC) (31430031, 31630027 and U1332118); National Distinguished Young Scholars grant (31225009).
Disclosures
The authors declare that there are no conflicts of interest related to this article.
References and links
- 1.Sohn M.-W., Epstein N., Huang E. S., Huo Z., Emanuele N., Stukenborg G., Guihan M., Li J., Budiman-Mak E., “Visit-to-visit systolic blood pressure variability and microvascular complications among patients with diabetes,” J. Diabetes Complications 31(1), 195–201 (2017). [DOI] [PMC free article] [PubMed] [Google Scholar]
- 2.Mundhenke M., Schwartzkopff B., Strauer B. E., “Structural analysis of arteriolar and myocardial remodelling in the subendocardial region of patients with hypertensive heart disease and hypertrophic cardiomyopathy,” Virchows Arch. 431(4), 265–273 (1997). [DOI] [PubMed] [Google Scholar]
- 3.Carmeliet P., “Angiogenesis in life, disease and medicine,” Nature 438(7070), 932–936 (2005). [DOI] [PubMed] [Google Scholar]
- 4.Kerbel R. S., “Tumor angiogenesis,” N. Engl. J. Med. 358(19), 2039–2049 (2008). [DOI] [PMC free article] [PubMed] [Google Scholar]
- 5.Datta M., Via L. E., Kamoun W. S., Liu C., Chen W., Seano G., Weiner D. M., Schimel D., England K., Martin J. D., Gao X., Xu L., Barry C. E., 3rd, Jain R. K., “Anti-vascular endothelial growth factor treatment normalizes tuberculosis granuloma vasculature and improves small molecule delivery,” Proc. Natl. Acad. Sci. U.S.A. 112(6), 1827–1832 (2015). [DOI] [PMC free article] [PubMed] [Google Scholar]
- 6.Jain R. K., “Normalization of tumor vasculature: an emerging concept in antiangiogenic therapy,” Science 307(5706), 58–62 (2005). [DOI] [PubMed] [Google Scholar]
- 7.Ferrara N., Kerbel R. S., “Angiogenesis as a therapeutic target,” Nature 438(7070), 967–974 (2005). [DOI] [PubMed] [Google Scholar]
- 8.Rabin O., Manuel Perez J., Grimm J., Wojtkiewicz G., Weissleder R., “An X-ray computed tomography imaging agent based on long-circulating bismuth sulphide nanoparticles,” Nat. Mater. 5(2), 118–122 (2006). [DOI] [PubMed] [Google Scholar]
- 9.Sombke A., Lipke E., Michalik P., Uhl G., Harzsch S., “Potential and limitations of X-Ray micro-computed tomography in arthropod neuroanatomy: a methodological and comparative survey,” J. Comp. Neurol. 523(8), 1281–1295 (2015). [DOI] [PMC free article] [PubMed] [Google Scholar]
- 10.Zhao Y., Brun E., Coan P., Huang Z., Sztrókay A., Diemoz P. C., Liebhardt S., Mittone A., Gasilov S., Miao J., Bravin A., “High-resolution, low-dose phase contrast X-ray tomography for 3D diagnosis of human breast cancers,” Proc. Natl. Acad. Sci. U.S.A. 109(45), 18290–18294 (2012). [DOI] [PMC free article] [PubMed] [Google Scholar]
- 11.Xuan R., Zhao X., Hu D., Jian J., Wang T., Hu C., “Three-dimensional visualization of the microvasculature of bile duct ligation-induced liver fibrosis in rats by x-ray phase-contrast imaging computed tomography,” Sci. Rep. 5, 11500 (2015). [DOI] [PMC free article] [PubMed] [Google Scholar]
- 12.Wang H., Berujon S., Herzen J., Atwood R., Laundy D., Hipp A., Sawhney K., “X-ray phase contrast tomography by tracking near field speckle,” Sci. Rep. 5, 8762 (2015). [DOI] [PMC free article] [PubMed] [Google Scholar]
- 13.Momose A., Takeda T., Itai Y., Hirano K., “Phase-contrast X-ray computed tomography for observing biological soft tissues,” Nat. Med. 2(4), 473–475 (1996). [DOI] [PubMed] [Google Scholar]
- 14.Gureyev T. E., Mayo S., Wilkins S. W., Paganin D., Stevenson A. W., “Quantitative in-line phase-contrast imaging with multienergy X rays,” Phys. Rev. Lett. 86(25), 5827–5830 (2001). [DOI] [PubMed] [Google Scholar]
- 15.Liu Y., Nelson J., Holzner C., Andrews J. C., Pianetta P., “Recent advances in synchrotron-based hard x-ray phase contrast imaging,” J. Phys. D Appl. Phys. 46, 494001 (2013). [Google Scholar]
- 16.Liu Y., Kiss A. M., Larsson D. H., Yang F., Pianetta P., “To get the most out of high resolution X-ray tomography: A review of the post-reconstruction analysis,” Spectrochim. Acta B At. Spectrosc. 117, 29–41 (2016). [Google Scholar]
- 17.Mayo S. C., Stevenson A. W., Wilkins S. W., “In-line phase-contrast X-ray imaging and tomography for materials science,” Materials (Basel) 5(5), 937–965 (2012). [DOI] [PMC free article] [PubMed] [Google Scholar]
- 18.Wu X., Liu H., Yan A., “Phase-contrast X-ray tomography: contrast mechanism and roles of phase retrieval,” Eur. J. Radiol. 68(3 Suppl), S8–S12 (2008). [DOI] [PubMed] [Google Scholar]
- 19.Shinohara M., Yamashita T., Tawa H., Takeda M., Sasaki N., Takaya T., Toh R., Takeuchi A., Ohigashi T., Shinohara K., “Atherosclerotic plaque imaging using phase-contrast X-ray computed tomography,” Am. J. Physiol.- Heart C. 294, H1094–H1100 (2008). [DOI] [PubMed] [Google Scholar]
- 20.Bennett H. S., Luft J. H., Hampton J. C., “Morphological classifications of vertebrate blood capillaries,” Am. J. Physiol. 196(2), 381–390 (1959). [DOI] [PubMed] [Google Scholar]
- 21.Chao W., Fischer P., Tyliszczak T., Rekawa S., Anderson E., Naulleau P., “Real space soft X-ray imaging at 10 nm spatial resolution,” Opt. Express 20(9), 9777–9783 (2012). [DOI] [PubMed] [Google Scholar]
- 22.de Smit E., Swart I., Creemer J. F., Hoveling G. H., Gilles M. K., Tyliszczak T., Kooyman P. J., Zandbergen H. W., Morin C., Weckhuysen B. M., de Groot F. M. F., “Nanoscale chemical imaging of a working catalyst by scanning transmission X-ray microscopy,” Nature 456(7219), 222–225 (2008). [DOI] [PubMed] [Google Scholar]
- 23.Schneider G., Guttmann P., Heim S., Rehbein S., Mueller F., Nagashima K., Heymann J. B., Müller W. G., McNally J. G., “Three-dimensional cellular ultrastructure resolved by X-ray microscopy,” Nat. Methods 7(12), 985–987 (2010). [DOI] [PMC free article] [PubMed] [Google Scholar]
- 24.Niclis J. C., Murphy S. V., Parkinson D. Y., Zedan A., Sathananthan A. H., Cram D. S., Heraud P., “Three-dimensional imaging of human stem cells using soft X-ray tomography,” J. R. Soc. Interface 12(108), 20150252 (2015). [DOI] [PMC free article] [PubMed] [Google Scholar]
- 25.Conesa J. J., Otón J., Chiappi M., Carazo J. M., Pereiro E., Chichón F. J., Carrascosa J. L., “Intracellular nanoparticles mass quantification by near-edge absorption soft X-ray nanotomography,” Sci. Rep. 6, 22354 (2016). [DOI] [PMC free article] [PubMed] [Google Scholar]
- 26.Zhu Y., Earnest T., Huang Q., Cai X., Wang Z., Wu Z., Fan C., “Synchrotron-based X-ray-sensitive nanoprobes for cellular imaging,” Adv. Mater. 26(46), 7889–7895 (2014). [DOI] [PubMed] [Google Scholar]
- 27.Zhu Y., Zhang J., Li A., Zhang Y., Fan C., “Synchrotron-based X-ray microscopy for sub-100nm resolution cell imaging,” Curr. Opin. Chem. Biol. 39, 11–16 (2017). [DOI] [PubMed] [Google Scholar]
- 28.Kirz J., Jacobsen C., Howells M., “Soft X-ray Microscopes and Their Biological Applications,” Q. Rev. Biophys. 28(1), 33–130 (1995). [DOI] [PubMed] [Google Scholar]
- 29.Chen R.-C., Dreossi D., Mancini L., Menk R., Rigon L., Xiao T.-Q., Longo R., “PITRE: software for phase-sensitive X-ray image processing and tomography reconstruction,” J. Synchrotron Radiat. 19(Pt 5), 836–845 (2012). [DOI] [PubMed] [Google Scholar]
- 30.Flannery B. P., Deckman H. W., Roberge W. G., D’Amico K. L., “Three-dimensional X-ray microtomography,” Science 237(4821), 1439–1444 (1987). [DOI] [PubMed] [Google Scholar]


