

Abstract
The bulbar conjunctiva is a thin, vascularized membrane covering the sclera of the eye. Non-invasive imaging techniques have been utilized to assess the conjunctival vasculature as a means of studying microcirculatory hemodynamics. However, eye motion often confounds quantification of these hemodynamic properties. In the current study, we present a novel optical imaging system for automated stabilization of the conjunctival microvasculature images by real-time eye motion tracking and realignment of the optical path. The ability of the system to stabilize conjunctival images acquired over time by reducing image displacements and maintaining the imaging area was demonstrated.
Index Terms: Eye, Motion Compensation and Analysis, Registration, Tracking (time series analysis), Conjunctiva
I. Introduction
The bulbar conjunctiva is a thin and densely vascularized membrane covering the sclera of the eye. The conjunctival microvasculature is easily imaged by non-invasive techniques, thereby allowing study of in situ microcirculatory hemodynamics [1]. Previous studies have reported alterations to the conjunctival microvasculature in systemic pathologies including diabetes [2, 3], Alzheimer’s disease [4], and sickle cell anemia [5–7]. Therefore, assessment of the conjunctival microcirculation may improve understanding of the abnormalities that occur in microvascular hemodynamics due to various systemic diseases.
Several commercially available retinal imaging systems have been modified to assess the hemodynamic properties of the conjunctiva, including the Retinal Functional Imager [8] and Heidelberg Retinal Flowmeter [9]. Additionally, dedicated optical imaging systems have also been developed based on Orthogonal Polarization Spectral imaging [10], slitlamp biomicroscopy [1, 5, 11, 12] and intravital microscopy [3, 13]. These systems assess the conjunctival hemodynamics by analyzing image sequences captured at high frame rates and magnifications. High magnification imaging is achieved with either additional optics [1, 5, 11, 12] or modification of the telephoto zoom via camera settings [14–16]. Nevertheless, these optical imaging systems have not incorporated image stabilization instrumentation to remove eye motion artifacts, a necessary step for quantification of conjunctival hemodynamics. One common approach to remove motion artifacts has been spatial registration of image sequences. However, automated image registration may be hindered by poor image quality and contrast and manual image registration requires extensive user interaction and time. Furthermore, since both registration methods are applied after image acquisition, data loss along the boundaries of the imaged area is unavoidable. In contrast, automated real-time image stabilization methodologies that allow for continuous imaging of a conjunctival microvasculature region while maintaining the imaged area would be beneficial for the study of microvascular hemodynamics. Specifically, image stabilization facilitates acquisition of image data over a large microvasculature network region, shortens imaging time for patients, and reduces post-acquisition image processing. These advantages likely increase the sensitivity and accuracy for detection and monitoring of pathologies, thereby improving assessment of the conjunctival hemodynamics.
Image stabilization techniques that use infrared light reflectance from the optic disk have been incorporated into retinal imaging systems, such as scanning laser ophthalmoscopes [17, 18] and optical coherence tomography systems [19]. However, the optic disk is not visible during conjunctival imaging, making this method of tracking impractical. Previously, imaging of the conjunctival microvasculature has been used to estimate ocular motion [20], however real-time image stabilization was not attempted. In the current study, we report a novel optical imaging system that performs automated image stabilization of the conjunctival microvasculature by real-time ocular motion tracking and optical path realignment.
II. Materials and Methods
A. Instrumentation
A schematic diagram of the optical imaging system for realtime image stabilization of the conjunctival microvasculature is shown in Fig 1. The optical setup was assembled on a steel bread board which was mounted on a translating table with three degrees of motion, allowing precise alignment of the optics with respect to the eye. A slit lamp biomicroscope’s white light source (27 W, BC900, Haag-Streit AG, Koniz, Switzerland) was fitted with a bandpass filter (530 ± 5 nm, Thorlabs, Newton, NJ) to illuminate the conjunctiva at a power of 130 μW. This wavelength was chosen to increase the contrast between the conjunctival microvasculature and the surrounding scleral tissue. Reflected light from the conjunctiva was directed by two mirrors attached to rotational galvanometers, (Model 6240H, Cambridge Tech, Bedford, MA) which were mounted in a perpendicular orientation using a customized X–Y mount (Cambridge Tech, Bedford, MA). The galvanometers were powered by two dedicated 10-V DC power supplies and controlled using a DAQ board (BNC 2120, National Instruments, Austin, TX) attached to the control computer (Optiplex 990, Windows 7 64-bit, Dell). Rotation of the mirrors in an X–Y configuration permitted optical beam path realignment in both the horizontal and vertical dimensions. A 150 mm focal length lens (Thorlabs, Newton, NJ) collected light from the conjunctival plane and collimated the image prior to bifurcation. The optical beam path was bifurcated using a 90/10 polarizing pellicle beam splitter (Thorlabs, Newton, NJ). The 10% beam path contained an adjustable aperture and a second 150 mm focus length lens (Thorlabs, Newton, New Jersey) to generate a 1× magnified image which was captured by a charge coupled device (CCD) camera (Prosilica GT 1380, Allied Vision Technologies GmbH). This CCD camera acquired 8-bit gray scale images for tracking. The 90% beam path contained a beam expander and camera arm mount of a slitlamp biomicroscope optical head (Zeiss, Jena, Germany) to generate a 3.8× magnified image on a second, identical CCD camera (Prosilica GT 1380, Allied Vision Technologies GmbH). This imaging CCD camera acquired magnified 8-bit gray scale image sequences for evaluation of image stabilization. A 90/10 polarizing pellicle beam splitter was chosen to maximize light directed to the imaging camera, since the higher magnification optics required more light. Both CCD cameras were aligned to share the same image focal plane and used an interline Sony ICX285 sensor with a pixel size of 6.45 μm, a fill factor of 100%, a quantum efficiency of 50% at the imaging wavelength. Each camera was controlled by a dedicated GigE network interface card mounted to the control computer’s motherboard. Real-time image stabilization and acquisition were controlled using a customized software program (LabView 2014, National Instruments, Austin, TX).
Fig 1.
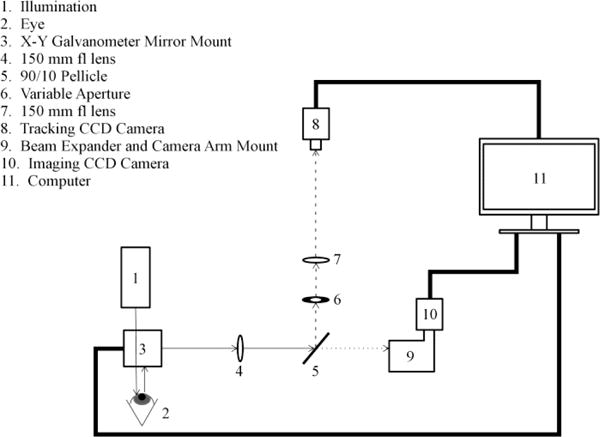
Schematic diagram of the optical imaging system for automated realtime image stabilization. Thick lines indicate hardware interfaces and thin lines indicate optical beam paths. The dash and dotted lines indicate the optical beam paths for tracking and imaging, respectively.
B. Real-time Image Stabilization
The control program simultaneously and independently coordinated image acquisition on both cameras at different frames per second (FPS) rates. The tracking camera operated at either 60 or 90 FPS by using a region of interest (ROI) on the camera sensor (200×200 pixels; 1.29×1.29 mm). The maximum displacement in both x and y dimensions that could be corrected by the system was limited by the field of view of the tracking camera and was 1.29 mm. The imaging camera operated at 50 FPS using a ROI on the camera sensor (550×550 pixels; 0.94×0.94 mm). Image stabilization was performed by tracking at one of the two FPS conditions while simultaneously realigning the optical beam path by galvanometer rotation of the two perpendicular mirrors.
Tracking was achieved by determining the displacement of a template image in consecutive tracking camera image frames using a normalized 2D cross correlation algorithm provided by an open source computer vision and machine learning software library [21] (OpenCV, version 3.0.0). First, the template image was created by cropping the initial tracking camera image frame to a user-assigned ROI of ~50 × 50 pixels. Second, the OpenCV cross-correlation function (cvMatchTemplate) generated a 2D array of correlation coefficients by sliding the template image over the current tracking camera image frame in a 2D pixel-wise manner and calculating a correlation coefficient at each location. This function produced normalized correlation coefficients by using the normalized matching method argument (CV_TM_CCOEFF_NORMED). Third, the location corresponding to the maximum correlation value was used to determine the frame-to-frame pixel displacements in both Cartesian axes. The time required to execute the cross correlation algorithm was ~2 ms. If the maximum correlation value was greater than a threshold of 0.7, pixel displacements were converted to galvanometer voltages using an empirically derived calibration factor. This threshold was determined experimentally based on its ability to provide consistent results during image stabilization of the target. The resulting voltages were applied and the mirrors were rotated in real time to realign the optical path and stabilize the image of the conjunctival microvasculature. If the maximum correlation value was < 0.7, mirror voltages were not calculated or applied and image stabilization ceased.
C. Dynamic Response of the Control System
The dynamic response of the control system was assessed by determining the frequency response, settling time, and steady state displacement error. A transparent ruler with millimeter scale precision served as an imaging target. The target was spatially modulated by applying voltage to a rotating DC motor shaft (Model 50JB, Source Engineering Inc., Santa Clara, CA). Image sequences before and during image stabilization were captured. The imaging camera’s exposure, gain and image acquisition rate were 18 ms, 25, and 50 FPS, respectively. The tracking camera’s exposure, gain and image acquisition rate were 11 ms, 31, and 90 FPS, respectively.
The frequency response of the control system was determined by measuring the decibel suppression of target motion during image stabilization. The target was vertically modulated by applying voltages from 1 to 21 V, in 1V increments, to the DC motor, producing a spatial oscillation of ~780 μm at frequencies ranging from 0.15 to 2.63 Hz. Image sequences acquired before and during stabilization were used to determine the frequency of the spatial oscillations and the target displacement, respectively. The suppression in target motion achieved by image stabilization at each target frequency was calculated in decibels as 10*log10(Δdisp / d0), where Δdisp was the difference in displacement between before and during image stabilization and do was the displacement before image stabilization. A Bode plot of decibel suppression and target oscillation frequency was generated and fitted with a standard exponential function. The frequency response bandwidth was determined from the fitted exponential as the cutoff frequency corresponding to a Δdisp equal to half of do, or equivalently a decibel suppression of -3 dB.
The settling time of the control system was determined by applying an immediate step-wise displacement and tracking image displacement as a function of time during image stabilization. An immediate displacement of 85 μm was achieved by applying a voltage of 0.15 V to the x-axis galvanometer between successive frames during image stabilization. Image sequences during this perturbation were acquired and settling time was determined by the time required to stabilize the image to within 5 pixels of the original position.
The steady state displacement error of the control system was determined by immobilizing the target and tracking image displacement during image stabilization. Image displacement was averaged over 30 successive image frames and a mean displacement from two repeated measurements was calculated.
D. Experimental Design – Target and Conjunctiva
Image stabilization was assessed in a spatially modulated target and the conjunctival microvasculature of human subjects. Image sequences were acquired under three conditions: before image stabilization, during image stabilization at 60 FPS, and during image stabilization at 90 FPS. The imaging camera exposure, gain and FPS were 18 ms, 25, and 50 FPS, respectively. The tracking camera exposure, gain and FPS were 11 ms, 31, and 60 or 90 FPS, respectively.
The target was translated at an average speed of 0.9 mm/s which corresponded to a DC motor voltage of 10V. This voltage was chosen to represent a substantial challenge to the system without exceeding the cutoff frequency. During translation, three 5-second image sequences were acquired at each image stabilization condition.
Five human subjects (4 male, 1 female, age = 33 ± 11 years) were seated in front of the optical imaging system with their head resting on a chin and forehead support. A point source of light was provided as fixation to the right eye while the left eye was imaged. In each subject, between three and four 5-second image sequences of the temporal conjunctival microvasculature were acquired at each image stabilization condition.
E. Assessment of Image Stabilization
Image stabilization was assessed by three metrics: 1) image sharpness, 2) image displacement and 3) field of view. All image analyses were performed by algorithms developed in Matlab (Matlab 2013, MathWorks, Natick, MA). First, a mean image was generated from the image sequence by averaging all frames and then a sharpness score (SS) was calculated by determining the average magnitude of the horizontal and vertical pixel-to-pixel intensity gradients, according to equation 1.
| (1) |
I (x,y) is the 2D array of intensity values obtained from the mean image, ∂/∂x and ∂/∂y are intensity gradients in the x and y dimensions respectively, and N is the number of elements in the 2D array. The intensity gradients were calculated using the Matlab function gradient. Higher sharpness scores indicated increased image contrast. Second, the relative frame-to-frame displacement of a manually defined ROI through the image sequence was detected. The standard deviations of the shift amplitudes were calculated in the x and y Cartesian axes (SDX and SDY, respectively). The total magnitude of the displacements was calculated as SDT:
| (2) |
Lower values of SDT indicate decreased displacement between consecutive image frames and better image stabilization. Third, the effect of image stabilization on maintaining the imaged area was assessed by calculating the percentage of the field of view (FOV) that was maintained during image acquisition. The maintained FOV (FOVM) corresponds to the percentage of the original FOV which was constantly observable throughout the image sequence, and was calculated as:
| (3) |
where IX, IY, DX, and DY are the image dimensions and maximal displacements in the x and y Cartesian axes, respectively. Higher values of FOVM indicate smaller maximal displacements and better image stabilization.
The dynamic response of the control system was evaluated using the SDT metric. Target image stabilization was assessed with SS and SDT metrics. Conjunctival microvasculature image stabilization was demonstrated using SS, SDT, and FOVM metrics.
F. Data Analysis
Mean SS, SDT, FOVM values were calculated by averaging repeated measurements at each image stabilization condition. From conjunctival microvasculature images, the repeatability of SDT and FOVM was assessed by calculating the standard deviation of repeated measurements averaged over all subjects at each image stabilization condition. General linear model repeated measures analysis was used to evaluate the effect of image stabilization on stabilization metrics (SS, SDT, and FOVM). Pairwise comparisons were performed with Bonferroni adjustments for multiple comparisons. Significance was accepted at P < 0.05. SPSS software (version 22, SPSS, Chicago, IL, USA) was used to perform statistical analyses.
III. Results
The cutoff frequency of the control system was 2.33 Hz, indicating effective stabilization at mean target velocities of less than 1.82 mm/s. The mean settling time from two repeated measurements was 328 ± 8 ms, indicating recovery from instantaneous displacements of 85 μm within a third of a second. The steady state displacement error of the system was 0.6 ± 0.2 pixels, corresponding to 1.0 ± 0.3 μm.
Mean images of the target before and during image stabilization are shown in Fig 2a. Left, center and right columns of Fig 2a correspond to mean images generated before image stabilization, during image stabilization at 60 FPS, and during image stabilization at 90 FPS, respectively. Image contrast and sharpness of the target mean images was improved with image stabilization. Mean SS values of the target images under each stabilization condition are shown in Fig 2B. Mean SS values before and during image stabilization at 60 and 90 FPS were 0.54 ± 0.14, 0.70 ± 0.03, 0.77 ± 0.00, respectively. Mean SDT values in the target before and during image stabilization at 60 and 90 FPS are shown in Fig 2c. Before image stabilization, SDT was 285 ± 16 μm. SDT during image stabilization at 60 and 90 FPS were 77 ± 1 μm and 60 ± 1 μm, respectively.
Fig 2.

Mean images of the vertically modulated target at a mean linear velocity of 0.9 mm/s (a) before image stabilization (left column), during image stabilization at 60 FPS (center column), and during image stabilization at 90 FPS (right column); (b) Mean SS of the target image at each image stabilization condition. (c) Mean SDT of the target at each image stabilization condition. Error bars indicate standard deviation.
Repeatability of SDT measurements during conjunctival image stabilization at 60 and 90 FPS were 7 μm and 3 μm, respectively. Repeatability of FOVM measurements during conjunctival image stabilization at 60 and 90 FPS were 10%, and 3%, respectively. Mean conjunctival microvasculature images from one human subject before and during image stabilization at 60 and 90 FPS are shown in Fig 3a. Image stabilization is demonstrated by increased contrast, sharpness and the ability to distinguish fine details of the microvasculature, as indicated by arrow heads. Mean SS values of conjunctival images in all human subjects obtained before and during image stabilization are shown in Fig 3b. There was a significant effect of image stabilization on SS (P = 0.02). Image stabilization at 60 and 90 FPS increased SS as compared to before stabilization (P ≤ 0.05), whereas there was no significant difference in SS between image stabilization at 60 and 90 FPS (P = 1.0).
Fig 3.

(a) Mean conjunctival microvasculature images acquired from a human subject before (left) and during image stabilization at 60 FPS (center) and 90 FPS (right). Arrowhead indicates area of increased sharpness and contrast, allowing for better visualization of the conjunctival microvasculature. (b) Mean SS of the conjunctival microvasculature images in all subjects at each image stabilization condition. Error bars and asterisks indicate standard deviation of means and statistically significant differences between stabilization conditions, respectively.
Mean SDT and FOVM in all subjects before and during image stabilization at 60 and 90 FPS are displayed in Fig 4a and 4b, respectively. Before and during image stabilization at 60 and 90 FPS, mean SDT was 176 ± 24 μm, 39 ± 6 μm and 30 ± 7 μm, respectively. There was a significant effect of image stabilization on SDT (P < 0.001). Image stabilization at 60 and 90 FPS decreased SDT compared to before stabilization (P = 0.001). There was also a significant difference in SDT between image stabilization at 60 and 90 FPS (P = 0.004). Mean FOVM before and during image stabilization at 60 and 90 FPS was 24 ± 11%, 66 ± % and 75 ± 3%, respectively. Image stabilization significantly affected FOVM (P = 0.001). Image stabilization at 60 and 90 FPS increased FOVM compared with that before stabilization (P ≤ 0.008). FOVM also increased with image stabilization at 90 FPS as compared to 60 FPS (P = 0.03).
Fig 4.

(a) Mean SDT and (b) mean FOVM of the conjunctival microvasculature at each image stabilization condition. Error bars and asterisks indicate standard deviation of means and statistically significant differences between stabilization conditions, respectively.
IV. Discussion
We developed a novel optical imaging system to perform automated real-time image stabilization of the conjunctival microvasculature. The system uses a normalized cross correlation algorithm to detect conjunctival microvasculature motion and control galvanometer scanners to realign the optical imaging path. Image stabilization was repeatable and reduced displacements of the target and conjunctival microvasculature, while also maintaining a larger field of view of the microvasculature.
The dynamic response of the control system for conjunctival microvasculature image stabilization was established. The cutoff frequency corresponded to a mean velocity of 1.82 mm/s, which is substantially greater than eye motion from saccade and gaze drift [22]. Increased SS of the target image and decreased SDT during image stabilization were demonstrated, confirming the capability of the system to suppress sustained motion at a velocity within the frequency response of the control system. The settling time of the system was less than a third of a second, adequate to stabilize saccade eye motion which occurs every ~700 ms during fixation and has a latency of ~200 ms [22, 23].
Conjunctival microvasculature images acquired during image stabilization demonstrated significantly improved visualization of fine details. This observation was confirmed by increased SS and a reduction in SDT during image stabilization. Furthermore, image stabilization at 90 FPS reduced SDT to ~30 μm, which was significantly lower than SDT at 60 FPS. In addition, FOVM of the conjunctival microvasculature significantly increased during image stabilization. FOVM was ~75% during image stabilization at 90 FPS, and significantly greater than FOVM at 60 FPS. These results support the potential of the system to image blood vessels within a fixed region to monitor dynamic changes in conjunctival hemodynamics over time.
In the current configuration, a dedicated optical imaging system was developed for conjunctival microvasculature image stabilization. In the future, it may be feasible to design and develop a more compact and modular system that can be integrated into commercial slit lamp biomicroscopes, which would facilitate application of this technology for multicenter clinical studies. As with all optical imaging techniques, image quality affects the system’s performance. Although image stabilization was demonstrated at high frame rates, image quality can be adversely affected due to the prerequisite short exposures. Since the light levels used in the current study were low, a possible solution is to deliver more light to the eye or improve light efficiency along the tracking optical path. Furthermore, since image acquisition and cross correlation occur in series, computation time of the cross correlation algorithm can also directly affect performance. The cross correlation algorithm had a runtime of up to 2 ms and can limit the effective frame rates of both the tracking and imaging cameras. A possible solution is to reduce computation time by performing the cross correlation on the graphics processing unit using compute unified device architecture. The current study established the feasibility of the image stabilization method in a small cohort of healthy subjects. Future studies are needed to determine effects of gender, race, age, and pathologies on the performance of the system.
V. CONCLUSION
A technique for automated real-time image stabilization of the conjunctival microvasculature was demonstrated. This technique was shown to significantly reduce displacements of the target and conjunctival microvasculature as well as maintain the original imaged area during image acquisition. Therefore, this technique may enable further advancements in the study of microvascular pathophysiology. While the optical imaging system was used for stabilized conjunctival microvasculature imaging, the technique described here is applicable to other disciplines and tissues which require image stabilization to further improve the efficacy of image analysis algorithms.
Acknowledgments
This work was supported by NIH grants DK104393 and EY001792, Senior Scientific Investigator (MS) and departmental awards from Research to Prevent Blindness.
Contributor Information
Anthony E. Felder, Department of Bioengineering, University of Illinois at Chicago, Chicago, IL, 60607, USA
Cesare Mercurio, Currently at Motorola, Chicago, IL, 60607, USA.
Justin Wanek, Department of Ophthalmology and Visual Sciences, University of Illinois at Chicago, Chicago, IL, 60612, USA.
Rashid Ansari, Department of Electrical and Computer Engineering, University of Illinois at Chicago, Chicago, IL, 60607, USA.
Mahnaz Shahidi, Department of Ophthalmology and Visual Sciences, University of Illinois at Chicago, Chicago, IL, 60612, USA.
References
- 1.Shahidi M, Wanek J, Gaynes B, Wu T. Quantitative assessment of conjunctival microvascular circulation of the human eye. Microvasc Res. 2010 Mar;79:109–113. doi: 10.1016/j.mvr.2009.12.003. [DOI] [PMC free article] [PubMed] [Google Scholar]
- 2.Cheung AT, Ramanujam S, Greer DA, Kumagai LF, Aoki TT. Microvascular abnormalities in the bulbar conjunctiva of patients with type 2 diabetes mellitus. Endocr Pract. 2001 Sep-Oct;7:358–63. doi: 10.4158/EP.7.5.358. [DOI] [PubMed] [Google Scholar]
- 3.Cheung AT, Tomic MM, Chen PC, Miguelino E, Li CS, Devaraj S. Correlation of microvascular abnormalities and endothelial dysfunction in Type-1 Diabetes Mellitus (T1DM): a real-time intravital microscopy study. Clin Hemorheol Microcirc. 2009;42:285–95. doi: 10.3233/CH-2009-1199. [DOI] [PubMed] [Google Scholar]
- 4.Smith MM, Chen PC, Li CS, Ramanujam S, Cheung AT. Whole blood viscosity and microvascular abnormalities in Alzheimer’s Disease. Clin Hemorheol Microcirc. 2009;41:229–39. doi: 10.3233/CH-2009-1174. [DOI] [PubMed] [Google Scholar]
- 5.Wanek J, Gaynes B, Lim JI, Molokie R, Shahidi M. Human bulbar conjunctival hemodynamics in hemoglobin SS and SC disease. Am J Hematol. 2013 Aug;88:661–4. doi: 10.1002/ajh.23475. [DOI] [PMC free article] [PubMed] [Google Scholar]
- 6.Kord Valeshabad A, Wanek J, Zelkha R, Lim JI, Camardo N, Gaynes B, et al. Conjunctival microvascular haemodynamics in sickle cell retinopathy. Acta Ophthalmol. 2014 Nov 27; doi: 10.1111/aos.12593. [DOI] [PMC free article] [PubMed] [Google Scholar]
- 7.Paton D. The conjunctival sign of sickle-cell disease. Arch Ophthalmol. 1961 Jul;66:90–4. doi: 10.1001/archopht.1961.00960010092020. [DOI] [PubMed] [Google Scholar]
- 8.Jiang H, Ye Y, DeBuc DC, Lam BL, Rundek T, Tao A, et al. Human conjunctival microvasculature assessed with a retinal function imager (RFI) Microvasc Res. 2013 Jan;85:134–7. doi: 10.1016/j.mvr.2012.10.003. [DOI] [PMC free article] [PubMed] [Google Scholar]
- 9.Duench S, Simpson T, Jones LW, Flanagan JG, Fonn D. Assessment of variation in bulbar conjunctival redness, temperature, and blood flow. Optometry and Vision Science. 2007 Jun;84:511–516. doi: 10.1097/OPX.0b013e318073c304. [DOI] [PubMed] [Google Scholar]
- 10.van Zijderveld R, Ince C, Schlingemann RO. Orthogonal polarization spectral imaging of conjunctival microcirculation. Graefes Arch Clin Exp Ophthalmol. 2014 May;252:773–9. doi: 10.1007/s00417-014-2603-9. [DOI] [PubMed] [Google Scholar]
- 11.Koutsiaris AG, Tachmitzi SV, Papavasileiou P, Batis N, Kotoula MG, Giannoukas AD, et al. Blood velocity pulse quantification in the human conjunctival pre-capillary arterioles. Microvasc Res. 2010 Sep;80:202–8. doi: 10.1016/j.mvr.2010.05.001. [DOI] [PubMed] [Google Scholar]
- 12.Koutsiaris AG, Tachmitzi SV, Batis N. Wall shear stress quantification in the human conjunctival pre-capillary arterioles in vivo. Microvasc Res. 2013 Jan;85:34–9. doi: 10.1016/j.mvr.2012.11.003. [DOI] [PubMed] [Google Scholar]
- 13.Cheung AT, Perez RV, Chen PC. Improvements in diabetic microangiopathy after successful simultaneous pancreas-kidney transplantation: a computer-assisted intravital microscopy study on the conjunctival microcirculation. Transplantation. 1999 Oct 15;68:927–32. doi: 10.1097/00007890-199910150-00005. [DOI] [PubMed] [Google Scholar]
- 14.Jiang H, Zhong J, DeBuc DC, Tao A, Xu Z, Lam BL, et al. Functional slit lamp biomicroscopy for imaging bulbar conjunctival microvasculature in contact lens wearers. Microvasc Res. 2014 Mar;92:62–71. doi: 10.1016/j.mvr.2014.01.005. [DOI] [PMC free article] [PubMed] [Google Scholar]
- 15.Wang L, Yuan J, Jiang H, Yan W, Cintron-Colon HR, Perez VL, et al. Vessel Sampling and Blood Flow Velocity Distribution With Vessel Diameter for Characterizing the Human Bulbar Conjunctival Microvasculature. Eye Contact Lens. 2015 Apr 1; doi: 10.1097/ICL.0000000000000146. [DOI] [PMC free article] [PubMed] [Google Scholar]
- 16.Xu Z, Jiang H, Tao A, Wu S, Yan W, Yuan J, et al. Measurement variability of the bulbar conjunctival microvasculature in healthy subjects using functional slit lamp biomicroscopy (FSLB) Microvasc Res. 2015 Sep;101:15–9. doi: 10.1016/j.mvr.2015.05.003. [DOI] [PMC free article] [PubMed] [Google Scholar]
- 17.Burns SA, Tumbar R, Elsner AE, Ferguson D, Hammer DX. Large-field-of-view, modular, stabilized, adaptive-optics-based scanning laser ophthalmoscope. Journal of the Optical Society of America a-Optics Image Science and Vision. 2007 May;24:1313–1326. doi: 10.1364/josaa.24.001313. [DOI] [PMC free article] [PubMed] [Google Scholar]
- 18.Hammer DX, Ferguson RD, Bigelow CE, Iftimia NV, Ustun TE, Burns SA. Adaptive optics scanning laser ophthalmoscope for stabilized retinal imaging. Optics Express. 2006 Apr 17;14:3354–3367. doi: 10.1364/oe.14.003354. [DOI] [PMC free article] [PubMed] [Google Scholar]
- 19.Hammer DX, Ferguson RD, Iftimia NV, Ustun T, Wollstein G, Ishikawa H, et al. Advanced scanning methods with tracking optical coherence tomography. Optics Express. 2005 Oct 3;13:7937–7947. doi: 10.1364/opex.13.007937. [DOI] [PMC free article] [PubMed] [Google Scholar]
- 20.Nakagomi H, Hoshino K. Measurement of rotational eye movement using conjunctiva blood vessel tracking. System Integration (SII), 2012 IEEE/SICE International Symposium on. 2012:758–763. [Google Scholar]
- 21.Bradski G. The OpenCV library. Dr Dobbs Journal. 2000 Nov;25:120–+. [Google Scholar]
- 22.Cherici C, Kuang X, Poletti M, Rucci M. Precision of sustained fixation in trained and untrained observers. J Vis. 2012;12 doi: 10.1167/12.6.31. [DOI] [PMC free article] [PubMed] [Google Scholar]
- 23.Yang Q, Bucci MP, Kapoula Z. The latency of saccades, vergence, combined eye movements in children and in adults. Invest Ophthalmol Vis Sci. 2002 Sep;43:2939–49. [PubMed] [Google Scholar]