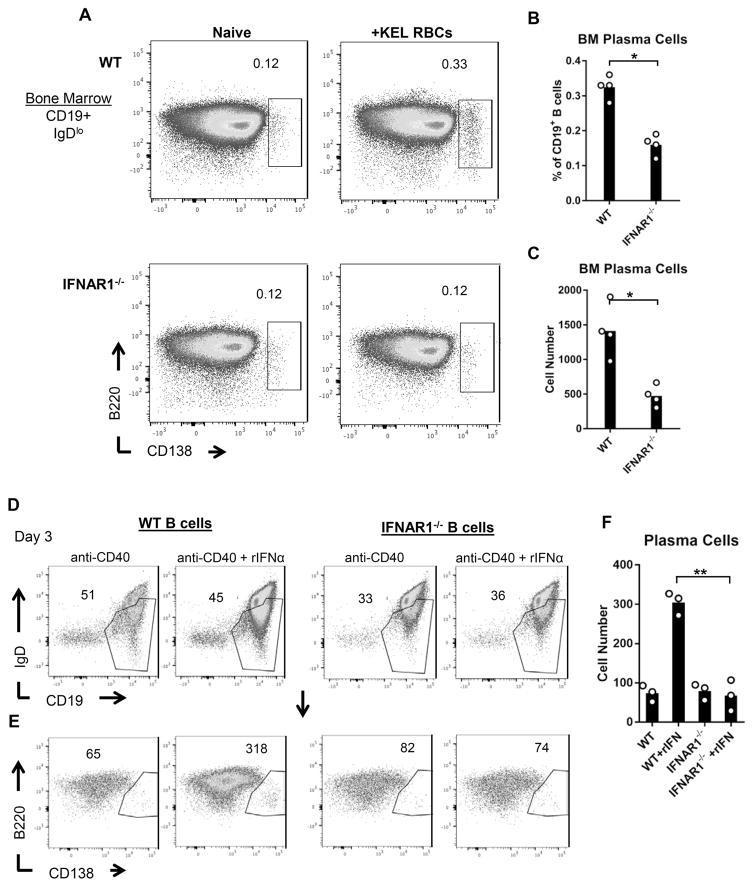
Figure 6. IFNα/β promotes plasma cell differentiation.
(A–C) WT and IFNAR1−/− mice were transfused 28 days following an initial transfusion, and plasma cells were analyzed 14 days later. (A) Representative flow cytometric analysis of plasma cells (CD19+IgDloB220loCD138+) from bone marrow of naïve and transfused mice. Plots are gated on live CD19+IgDlo cells. Numbers on plots indicate the percent of CD19+ B cells within the drawn region. (B–C) Bone marrow plasma cells were quantified as (B) percent of CD19+ B cells and (C) cell number. Data show one of two independent experiments with 4 mice per group. *p<0.05 by Mann Whitney U test. Data from a repeated independent experiment are shown in Supplemental Figure 4. (D–F) B cells were isolated from spleens of WT and IFNAR1−/− mice by magnetic cell separation. Cells were cultured for 72 hrs in the presence of anti-CD40 +/− rIFNα. (D–E) Representative flow cytometric analysis of live (D) CD19+IgDlo B cells and (E) B220loCD138+ plasma cells gated on regions drawn in D). Numbers on plots indicate the (D) percent of live cells or (E) the total number of cells in the drawn regions. Representative of 3 independent experiments. (F) Summary data of the number of plasma cells generated in the indicated cultures. **p<0.01 by unpaired 2-tailed t-test.

