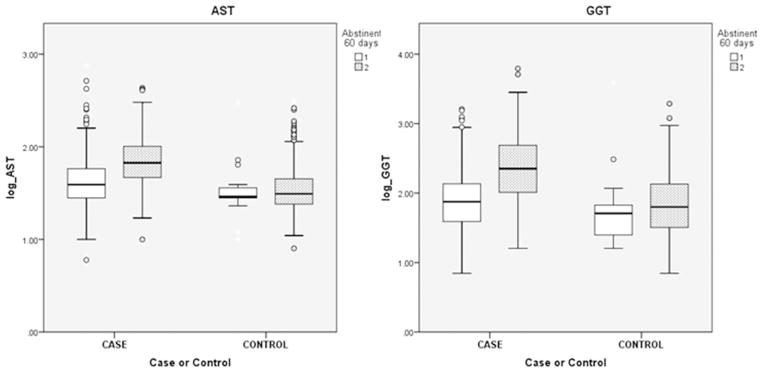
Fig. 1.
Boxplots of AST and GGT results by Case–Control and Abstinent/Non-Abstinent status. Boxes show 25th, 50th, and 75th centiles, whiskers indicate 95% range. For the legend ‘Abstinent 60 days’ 1 = Yes (abstinent) and 2 = No (drinking). For each test, values differ significantly by both case/control and abstinent drinking status but there is also case/control by abstinent/drinking interaction (see Table 2). Abstinent/drinking status has significant effects in cases but not in controls.

