Abstract.
The choriocapillaris (CC) plays an essential role in maintaining the normal functions of the human eye. There is increasing interest in the community to develop an imaging technique for visualizing the CC, yet this remains underexplored due to technical limitations. We propose an approach for the visualization of the CC in humans via a complex signal-based optical microangiography (OMAG) algorithm, based on commercially available spectral domain optical coherence tomography (SD-OCT). We show that the complex signal-based OMAG was superior to both the phase and amplitude signal-based approaches in detailing the vascular lobules previously seen with histological analysis. With this improved ability to visualize the lobular vascular networks, it is possible to identify the feeding arterioles and draining venules around the lobules, which is important in understanding the role of the CC in the pathogenesis of ocular diseases. With built-in FastTrac™ and montage scanning capabilities, we also demonstrate wide-field SD-OCT angiograms of the CC with a field of view at .
Keywords: optical coherence tomography, optical coherence tomography angiography, choriocapillaris, human choroid
1. Introduction
The choroid, located between the sclera and retinal pigment epithelium (RPE), is a thin layer consisting predominantly of blood vessels, highly pigmented melanocytes, nerves, and connective tissue. The choroid not only provides blood flow and nutrients to the outer retina, including the photoreceptors, but is also important for the metabolic exchange within the foveal avascular zone. Not surprisingly, changes in choroidal circulation are associated with several ocular diseases, such as age-related macular degeneration (AMD),1,2 uveitis,3 diabetic retinopathy (DR),4 and central serous chorioretinopathy.5 The choriocapillaris (CC),6–8 located along the inner portion of the choroid, is a thin, but dense, planar capillary bed that is composed of polygonal vascular units called lobules. The CC is supplied by the feeding arterioles of the deeper choroid, which enter perpendicularly with round open connecting points, and is drained by venules, which are orientated circumferentially around the lobules. Histopathological studies9–11 have shown that abnormalities or absence of the CC has been associated with the loss of RPE in geographic atrophy and drusen formation, and these changes in the CC may contribute to the formation of macular neovascularization.10 Additionally, eyes with DR were found to have a reduced vessel density within the CC when compared with eyes from healthy subjects.4,12 However, a high-resolution in vivo method to visualize the structural and blood flow changes occurring within the CC is needed to better understand the role of the CC in the pathophysiology of these ocular diseases.
Clinically, fluorescein angiography and indocyanine green angiography have been the gold standards for evaluating the blood flow characteristics of the retina and choroid, but high-resolution imaging of the CC with either method has not been possible.13–15 Optical coherence tomography (OCT)-based angiography (OCTA)16–19 is another approach being introduced for in vivo three-dimensional (3-D) imaging of the CC that does not require the injection of dye. There are multiple variations of OCTA, all of which utilize the phase,20 amplitude,21,22 or a combination of both the phase and amplitude23 of the OCT signal to obtain flow data.
As exciting as this technique may be, imaging of the CC using OCTA has not been without its challenges. The first issue hindering the study of the CC by OCTA is the fact that it is located under the RPE where a large number of photons get scattered. This subsequently results in the CC signal buried within a large and stochastically scattering background. The second issue is that the CC is a densely vascularized layer, where vessel diameter averages from 5 to with relatively slow flow speeds of 0.2 to .24,25 Therefore, both high signal-to-noise ratio (SNR) and high flow speed sensitivity are needed in order to successfully image the CC. One strategy to visualize the CC is to combine OCTA with adaptive optics.19,26–29 Kurokawa et al. obtained relatively high-resolution images using this combined technique; however, the images were captured through a limited field of view (FoV), typically of . In another paper by Kurokawa et al.,27 adaptive optics was used in combination with the phase information from the OCT signal to successfully image the CC in the macular region of healthy individuals, but this approach also was hindered by a limited FoV (, ) and less-than-ideal acquisition speeds (91-kHz A-line rate). Braaf et al.,30 again utilizing phase information, installed a second scanning laser ophthalmoscope as the hardware tracking system and imaged the CC under the fovea of healthy subjects. Utilizing a different approach that utilizes amplitude information, Choi et al.29 used speckle decorrelation to contrast the CC from the large vessels of the choroid with an in-house built 400-kHz swept source-OCT (SS-OCT) system. However, this specialized laboratory-based system is not accessible by the ophthalmic community.
The ability to use of OCTA alone for imaging the CC may lay with optical microangiography (OMAG), which is an algorithm previously developed to provide higher sensitivity to slow blood flows compared with other algorithms that use amplitude or phase information alone to detect blood flow. OMAG has been used for several years to image vascular networks,16,18,31–34 and its complex signal-based approach is especially suitable for contrasting capillaries with slow flow velocity, such as the CC. To determine the best decorrelation algorithm for the detection of the CC with its slow flow velocities, we investigated and refined CC imaging and visualization in vivo with the use of a commercially available spectral domain-OCT (SD-OCT) system and different OCTA algorithms.
2. Materials and Methods
2.1. Optical Coherence Tomography System and Scanning Protocols
In this study, we chose to use a commercially available OCTA system so that the proposed approach could be accessible by the wider community. In particular, an SD-OCT Cirrus HD 5000 research prototype system, a precursor of the AngioPlex® system (Carl Zeiss Meditec Inc., Dublin, California), was used to capture the OCTA images from the subjects. The system provided an A-scan imaging speed of 68 kHz with the central wavelength at 840 nm and a bandwidth of 50 nm. The axial resolution was while lateral resolution was , estimated at the fundus surface. The system phase stability was measured at . With the FastTrac™ motion correction software, this SD-OCT also provided a prototype function: a montaging scanning protocol in addition to the regular and scanning options. In the montage scanning protocol, wide-field imaging can be achieved by stitching together smaller image cubes (each cube with an FoV of in this study). Each cube was acquired with 245 A-scans in the fast scan axis (B-scan) and 245 transverse locations in the slow scan axis (C-scan). A 10% overlap in the scanning area between adjacent cubes was achieved for postscan montaging of images. With this setup, we acquired FoV images from 20 cubes for each healthy individual, centered at the fovea. Scanning was performed in a dark room without pupil dilation. To contrast the moving red blood cells (RBC), four repeated B-scans were acquired at each transverse location before moving to the next transverse location. One cube (volume) scan took to produce.
Five volunteer subjects without known ocular conditions (aged from 25 to 56 years with a mean of , 4 females and 1 male) participated in this study. This study was conducted in accordance with a protocol approved by the Institutional Review Board of the University of Washington, and informed consent was obtained from all subjects. The study followed the tenets of the Declaration of Helsinki and was conducted in compliance with the Health Insurance Portability and Accountability Act.
2.2. Choriocapillaris Angiography
When the OCT beam passes through vascularized biological tissues, it interacts with the RBCs flowing through the blood vessels, resulting in photons being transmitted or scattered. During this process, the velocity of the photons will change, as will their direction of travel, thus, introducing a phase change in the light waves. In addition to the phase change, the number of photons interacting with the moving RBCs alters the amplitude of the OCT signal. Based on these observations, OMAG measures flow signals using both the phase and amplitude aspects of the complex, i.e., coherent, OCT signal.
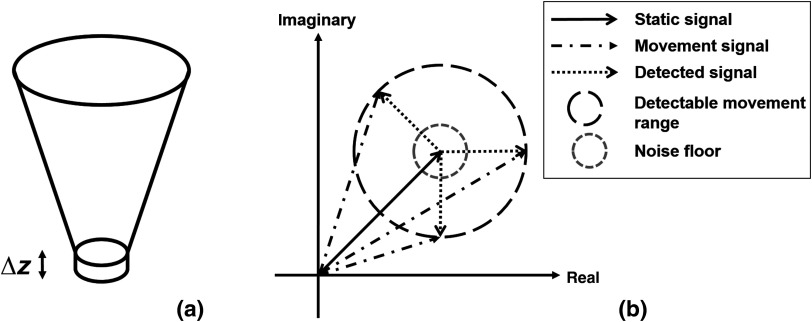
This concept is better shown in Fig. 1. For each voxel in 3-D OCT data, the signal comes from the summation of photons backscattered from the focal spot [Fig. 1(a)]. The static tissue signal is represented by the solid black vector in the complex coordinates [Fig. 1(b)] and is derived from the first B-scan of the repeated B-frame cluster. After a given time interval, the second B-frame is obtained, and the OCT signal from the same focal spot is presented as the dashed dot vectors, assuming there is movement in this voxel [round dot vectors in Fig. 1(b)]. The detectable movement range is represented by the long-dashed circle. It should be noted that the movement range would not be a perfect ring, as the sensitivity for phase and amplitude differences would differ. It would also vary between OCT systems. For the purpose of simplicity, however, it is exemplified as a two-dimensional circle here while it is actually an irregular 3-D shape in reality. The noise floor is illustrated as a gray-dashed circle.
Fig. 1.
Illustration of the OCT signal: (a) the focal spot of OCT on tissue and (b) the OCT signal represented in complex coordinates.
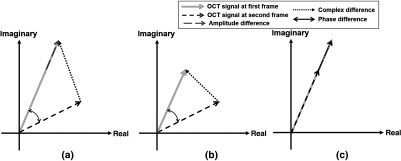
As shown in Fig. 2, those detectable movement vectors could be categorized into different scenarios. In Fig. 2(a), the phase, amplitude, and complex signal-based differences are illustrated as two headed black arrow, gray dash arrow, and black dot arrow, respectively. In this case, all three approaches, i.e., phase, amplitude, and complex, can detect the motion signal and would be the most common case in real-world settings; however, compared to the amplitude approach, the complex approach will result in larger signal differences between two frames, as dictated by the law of triangle inequality. More extreme scenarios are shown in Figs. 2(b) and 2(c). In Fig. 2(b), the amplitude of both signals is the same but the phase has changed, which would occur when the probe beam is parallel to the blood vessel orientation, for example in the retinal angiomatous proliferation lesion where the anastomotic vessel often runs perpendicularly from retina to choroid. In Fig. 2(c), the amplitude has changed, which would occur when the probe beam is perpendicular to the vessel orientation. Realistically, scenarios in Figs. 2(b) and 2(c) seldom exist; however, they do showcase two tendencies for case in Fig. 2(a) where the real amplitude or phase differences could be buried under the noise floor.
Fig. 2.
Schematic comparison of the phase, amplitude, and complex signal-based approaches. The diagram presents OCT signals captured at the same location within the same a time interval, illustrating different scenarios when a moving particle interacts with the OCT beam for comparing the phase, amplitude, and complex signal-based approaches: (a) typical cases when particle interacts the OCT beam, (b) a special case when the particle moves parallel to the OCT beam, and (c) a special case when the particle moves perpendicular to the OCT beam.
To clarify, the OCT signal from the first scan can be written as , and the OCT signal from the second can be written as . The OCTA result from the complex approach can be written as
| (1) |
When the OMAG signal is normalized to the structural OCT signal, it can be rewritten as
| (2) |
where represents the amplitude difference approach (being one of the speckle variants), and the second term represents the complex amplitude decorrelations (similar to phase variance approach). Therefore, OMAG takes both the intensity variance and complex decorrelation into consideration and employs all possible motion contrast mechanisms from OCT signals. On the other hand, the phase OCTA20 and intensity OCTA21,22 approaches, when used separately, only detect part of the whole motion signal and fail to utilize all the available information. In the interest of obtaining the entirety of the motion signal, the complex signal-based OCTA approach, i.e., OMAG, was used in this study. OMAG measures the differences between four consecutive B-scans by simply subtracting complex signals from those repeated B-scans at the same location23
| (3) |
where is the complex OCT signal, is the number of repeated B-scans at one transverse location, is the index of repeated B-scans, and () correspond to the pixel coordinates in a signal B-scan. Considering that CC is a layer permeated with dense vascular networks, SNR is crucial for visualizing the vascular network with an improved contrast between moving RBCs and static tissues. The high scattering property of RPE would make the incoming probing photons heavily scattered before reaching the CC. Such scattering photons would raise the noise floor in the OCTA image of the CC. Because this noise caused by the photon scattering is stochastic in nature, it would be possible to enhance the CC image quality by performing more averaging. Based on this concept, we propose to use combined arithmetic and geometric means (AM and GM) to further enhance the contrast and SNR in the generated CC flow signal
| (4) |
In the Cirrus AngioPlex system used for this study, one A-scan has 1024 pixels corresponding to a scanning range of in air, giving a pixel size of in tissue (assuming the refractive index of retinal tissue is 1.35). There are 245 A-scans per B-frame and 245 B-frames correspond to 2.4 mm; thus, the pixel size on the transversal plane is in tissue. Because the lateral and axial resolutions were at and , respectively, the OCT image gives oversampling on the transversal plane and oversampling in the axial direction. To obtain the CC, we first used a previously described semiautomatic segmentation software35 to delineate the RPE in the structure image before applying the same segmentation to the blood flow image. By using the RPE as a reference to define CC slab boundaries, we can then choose between numerous layers of various thicknesses to visualize the CC or deeper regions of the choroid if desired. In this study, CC slab was experimentally visualized as a 10- to -thin layer under Bruch’s membrane. The results of various locations and thicknesses are shown Sec. 3.
With the contrast mechanism of OCTA relying on the different signals derived from the RBCs at multiple time points, the duration of the time intervals between these OCTA signals can play a significant role in the visualization of ocular vasculature. That is to say, the longer the time interval, the narrower the velocity range of visible blood vessels. This is within reason of course, as longer time intervals would naturally increase the scan time required per patient, which is not clinically desirable for ophthalmology. The idea of variable time intervals within OCT imaging was first introduced by Shi et al.,36 who showed that variations in time intervals correspond with a detectable velocity range in Doppler OCT. Similarly, in OCTA, if we increase the time interval, an increased number of blood vessels with slower velocities can be detected.37 For this study, four consecutive B-scans were taken at the same location with a time interval of 4.5 ms. Similar to previously reported choroidal imaging studies,37 we also examined the effects of increasing interscan time interval by using the differences between frames 1 and 3, as well as frames 2 and 4, thus, increasing the time interval to 9 ms.
3. Results
The OCT raw datasets were obtained from five subjects according to the OCTA protocol described in Sec. 2.1. In total, there were about 100 OCTA cube scans ( scans per subject, with no failed scans). The raw datasets were postprocessed using algorithms described above to obtain the final OCTA results of the CC. Representative results are presented below.
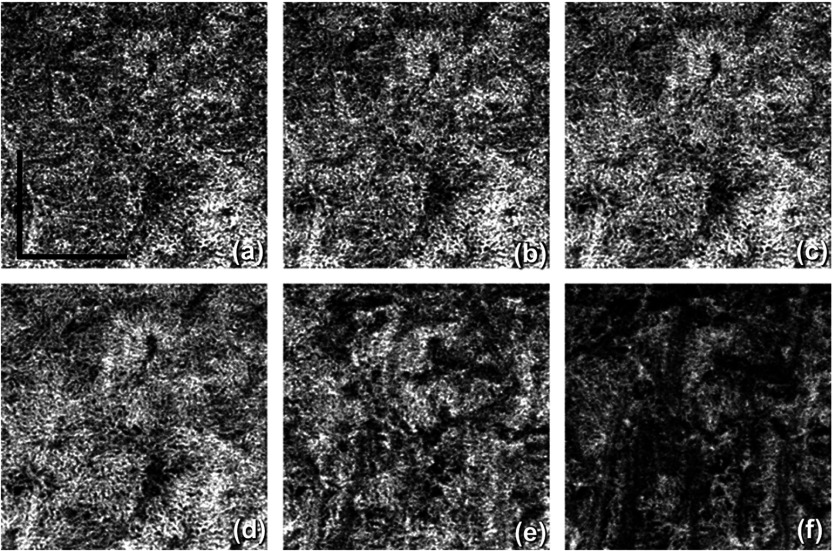
The CC is a thin layer below the Bruch’s membrane, only 10 to in depth. Therefore, after proper segmentation of the RPE layer, the corresponding number of pixels was taken below the Bruch’s membrane for en-face visualization, as shown in Fig. 3. Figures 3(a)–3(d) show the CC from different depths below the Bruch’s membrane, ranging from 2.2 to . At the increasing depths, i.e., an -thick region under the Bruch’s membrane [Fig. 3(e)] and an -thick region under the Bruch’s membrane [Fig. 3(f)], larger choroidal vessels are visible. Interestingly, in contrast to large retinal vessels, deep choroidal vessels appear to be dark in OCT and OCTA images. The thickness of CC varies at different locations, thicker under the fovea and thinner peripherally, ranging from 10 to .6,7 Among all subjects imaged in this study, a thicker slab () was used for CC under the fovea (central 4 cubes under the fovea covering a region), and a thinner slab () was used for CC everywhere else. Both correct location and thickness of the CC slab are essential for optimal visualization of the CC with OCTA.
Fig. 3.
The visualization of CC obtained from OCTA projection from a slab with varied thicknesses measured below the Bruch’s membrane along the depth: (a) a -thick slab under Bruch’s membrane, (b) a -thick slab under Bruch’s membrane, (c) a -thick slab under Bruch’s membrane, (d) a -thick slab under Bruch’s membrane, (e) a -thick slab, under the Bruch’s membrane, and (f) a -thick slab, under the Bruch’s membrane. .
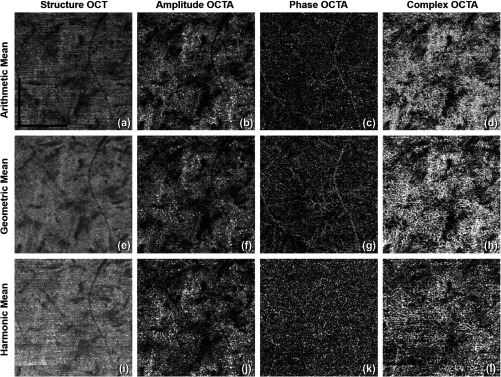
Figure 4 shows a comparison among all Pythagorean mean approaches. The phase OCTA images show the most differences given that the phase differences are generally more susceptible to noise and fluctuations compared to the amplitude signals. Harmonic mean approach is not optimal in visualizing vasculature in CC and was then not adopted. Compared to AM approach, GM algorithm provides clearer contrast in vascular patterns in phase OCTA images and almost no horizontal artifacts in structural OCT images. The main reason could be that GM is always equal or smaller than AM. When there is little bulk motion noise between different B-scans, GM and AM would yield very similar results, but when large motion is present among repeated B-scans, GM would yield smaller values compared to AM, and therefore, smaller fluctuations in flow signal due to noise. When compared among phase OCTA images, it can be observed that GM algorithm shows clearer vascular patterns compared to AM while all the amplitude OCTA images appear similar. Moreover, using methods reported in Refs. 34 and 38, quantitative assessment of the image contrast and SNR was conducted between AM and GM approaches as shown in Table 1, where the complex approach is demonstrated with superior performance to that using either the amplitude or phase information alone. This assessment also indicates that if AM is combined with GM, further improvement in image contrast and SNR would result. Therefore, AM + GM approach was adopted for further comparisons and study of CC OCTA in an attempt to boost SNR through more averaging and suppressing motion artifacts, i.e., Eq. (4).
Fig. 4.
Comparison among different Pythagorean mean approaches of CC OCTA in linear display: (a) to (d) AM approach: structural OCT, amplitude OCTA, phase OCTA, and complex OCTA, respectively; (e) to (h) GM approach: structural OCT, amplitude OCTA, phase OCTA, and complex OCTA, respectively; (i) to (l) harmonic mean approach: structural OCT, amplitude OCTA, phase OCTA, and complex OCTA, respectively. .
Table 1.
Quantitative comparison of image quality between AM and GM approach in terms of image contrast and SNR.
| Complex | Amplitude | Phase | ||||
|---|---|---|---|---|---|---|
| AM | GM | AM | GM | AM | GM | |
| Contrast | 3.08 | 3.02 | 2.73 | 2.92 | 1.88 | 2.22 |
| SNR | 3.28 | 3.72 | 3.05 | 3.39 | 1.67 | 2.59 |
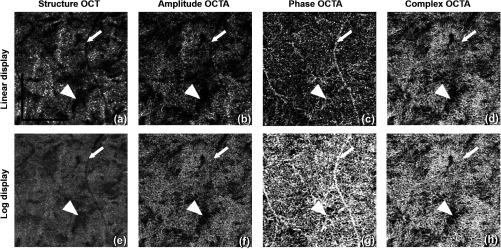
As indicated in Eq. (4), both the AM and GM are calculated and averaged to boost the SNR and achieve a better contrast for CC vascular imaging. Figure 5 shows the OCT and OCTA en-face images of CC using this AM/GM combined approach, by employing either amplitude, phase, or complex OCT signals. Figures 5(a)–5(d) are linear and Figs. 5(e)–5(h) are log displays. Table 2 shows quantitative image quality analysis of Figs. 5(b)–5(d). AM + GM approach resulted in higher SNR compared to both AM and GM approaches as we expected. As shown in Figs. 1 and 2, the amplitude and phase approaches both only use part of the OCT signal and, therefore, fail to utilize the entirety of the OCTA potential. In accordance with our theory, our results prove that OMAG, the complex signal-based OCTA, is superior to both phase and amplitude signal-based OCTA approaches in visualizing the CC.
Fig. 5.
Comparison of CC OCTA with AM + GM approach using (a–d) linear and (e–h) log display. From left to right column are the results for OCT structure, amplitude OCTA, phase OCTA, and complex OCTA, respectively. Arrowheads indicate a region of low structural signal. Arrows indicate the tailing artifact from a retinal vessel. .
Table 2.
Quantitative evaluation of image quality of AM + GM approach, from Figs. 5(b)–5(d).
| Complex | Amplitude | Phase | |
|---|---|---|---|
| AM + GM | AM + GM | AM + GM | |
| Contrast | 3.09 | 2.99 | 2.39 |
| SNR | 4.15 | 3.46 | 2.84 |
Observed in Fig. 5 is the amplitude signal-based OCTA being highly dependent on the strength of the structure signal, that is, it loses the ability to differentiate moving tissue from static tissue almost completely when the structure signal is low, as indicated by the arrow heads. However, both phase and complex signal-based OCTA are capable of resolving the motion signal where the OCT signal is relatively low. Another observation to be made is that the phase signal-based OCTA is heavily influenced by the tailing artifacts.34,39 As indicated by the arrows, the tails of retinal blood vessels are more evident in the phase signal-based OCTA approach. This is so because the tailing artifacts are mainly introduced by the forward scattering photons. When probing photons travel through retinal vessels, they interact with RBCs that are of high anisotropic factor (), meaning the probability of the photons being scattered forward is much higher than that being backscattered. Therefore, more photons would travel in to deeper tissues where they are scattered back into the detector. In this process, the phase of the light is changed, i.e., the Doppler shift, but little intensity variation is introduced by the first interaction. Accordingly, the retinal vessels appear dark in the structure and amplitude signal-based OCTA images, as in Figs. 5(a) and 5(b) but appear bright in the phase signal-based OCTA image, as in Fig. 5(c), because of the Doppler shift introduced by strong forward scattering. Both linear and log displays are illustrated here where log display provides tighter dynamic range and smoother contrast yet linear display shows finer details. Researchers should bear these differences in mind while conducting future studies.
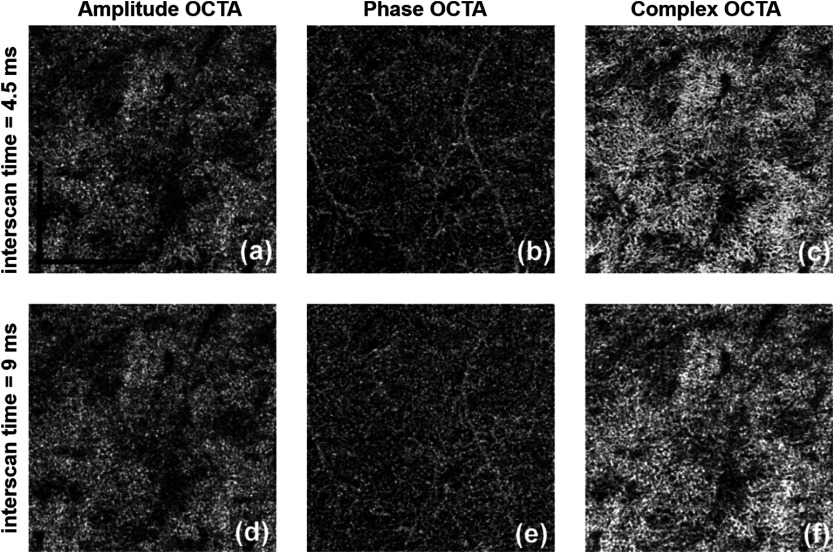
The effect of variable time intervals on CC visualization is shown in Fig. 6. Figures 6(a)–6(c) show the CC OCTA images derived from amplitude, phase, and complex signal-based approaches, respectively, with a time interval of 4.5 ms. Figures 6(d)–6(e) show the CC OCTA images derived using the same approaches with a time interval of 9 ms. As explained in Sec. 2, four repeated B-scans were taken at each location to generate OCTA signals. 4.5-ms time interval approach takes the difference between adjacent B-scans (scan 1 and 2; scan 2 and 3; and scan 3 and 4) while 9-ms time interval approach with skipping one (scan 1 and 3 and scan 2 and 4). For OCTA imaging with a 4.5-ms time interval, the final results were averaged using three differences, while for OCTA imaging with a 9-ms time interval, the final results were averaged using two differences. For amplitude OCTA and complex OCTA, the increased time interval did not significantly reveal more detailed vasculature in the CC. More differences can be observed in the phase flow image, but it is unclear how much is real signal and how much is noise. Overall, the OCTA images with a 9-ms time interval had higher noise floor compared to original OCTA images, i.e., those formed using a 4.5-ms time interval. All images are in linear display to discern detailed changes.
Fig. 6.
Comparing two-time intervals for visualization of the CC, linear display. (a–c) 4.5-ms time interval and (d–f) 9-ms time interval. From left to right: amplitude, phase, and complex signal-based OCTA, respectively. .
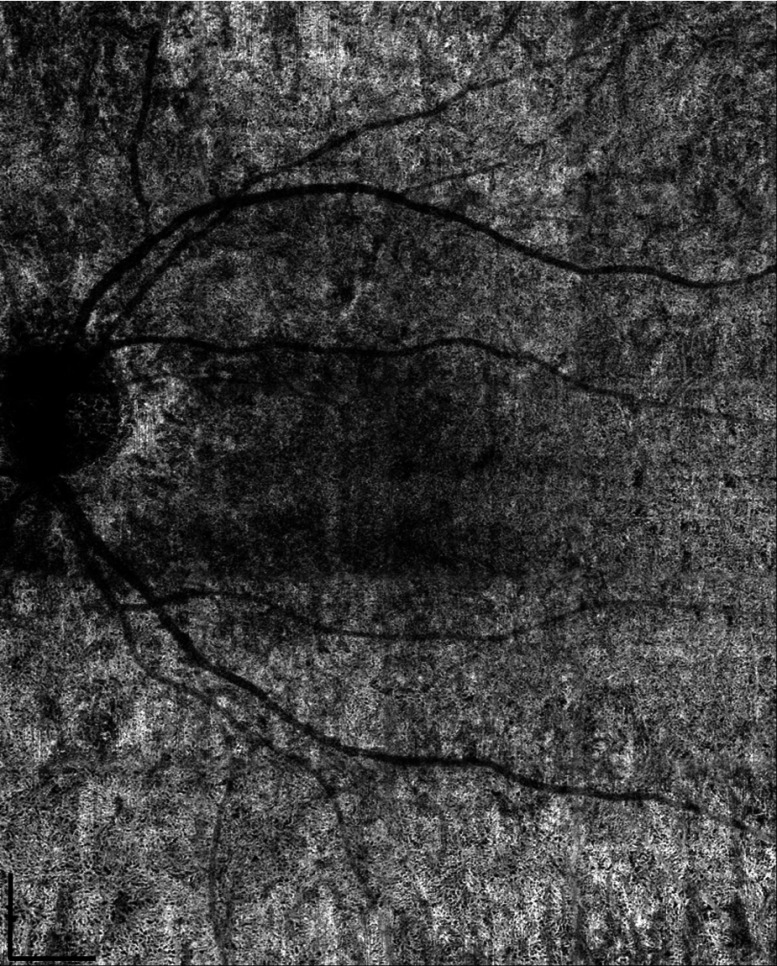
As previously mentioned, the FastTrac™ tracking system, specifically designed for use with the AngioPlex system, offers an opportunity to provide large FoV montage scanning. Twenty images, each, were stitched together to form a large FoV image of as shown in Fig. 7, using complex OCTA, GM + AM, and log display. CC under the fovea was visualized using slab while everywhere else was visualized using slab, all with 4.5-ms time interval. To the best of our knowledge, this is the first time the CC has been imaged and examined at this large a scale by a commercial SD-OCTA. The varying characteristics of the CC at different locations can be clearly visualized. Consistent with findings reported by histological studies, vessels within the CC under the fovea region are denser and have smaller vessel diameters. Confined by the lateral resolution of OCT (lateral resolutions of and axial resolution of ), they appear to be a densely packed honeycomb vascular network. When moving away from the fovea toward the equator and periphery, the lobular structure of the CC can be recognized more clearly as the vessels become less dense and vessel diameters increase. The CC under the fovea also appear to be dark because the highly scattering RPE is thicker. A longer wavelength light source with higher power can be utilized to improve this limitation.
Fig. 7.
Visualization of the CC with an FoV of using complex signal-based OMAG in log display.
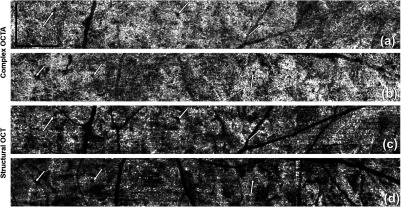
Figure 8 shows a closer look at the lobular structure of the CC. In each lobule, there is a feeding arteriole from the deeper choroid that travels parallel to the CC plane and inserts perpendicularly into the capillaries lobule via a round opening, which can be observed as the very small black holes on the OMAG images. In Fig. 8, the positions of these openings are highlighted by white arrows. Capillaries connected to this opening are orientated in a radial fashion (also see much higher magnification view in Fig. 9). Such architectural structures can also be seen on the structural OCT en-face images. Those openings appear darker compared to other natural avascular space between capillaries and could potentially be studied further to see if they can be quantified and represent integrity of a single lobule of CC. Figure 9 shows OCTA images from different depths. The round openings, highlighted by arrows, in Fig. 9(a) are clearly connected to the deeper feeding arteriole seen in Figs. 9(b) and 9(c). Deeper vessels appear dark since there are few backscattered photons, as explained previously. The draining venules are located at the periphery of the lobules and on the same plane as the CC in the equatorial and peripheral choroid.
Fig. 8.
Complex signal-based OCTA of the periphery regions, linear display: from (a) superior region and (b) inferior region. (c) and (d) The corresponding structural OCT en-face images of (a) and (b), respectively. Arrows highlight the insertion points of the feeding arterioles to the CC. .
Fig. 9.
Complex signal-based OCTA, linear display [with higher magnification respect to Fig. (8)]: from (a) a slab of the CC under Bruch’s membrane, (b) a -thick slab under the preceding slab, and (c) a -thick slab under (b). .
Figure 10 shows the choroidal vessels examined at different depths as they appear to be dark in OCTA images. It is believed that the forward scattering photons that failed to backscatter when interacting with blood still carry information from choroidal vessels and will appear as tailing artifacts in the en-face projection of the OCTA images of sclera. Our data have shown that the large vessels of the deep choroidal tissue appear dark, as in Figs. 10(b) and 10(c), and the sclera appears bright due to the tailing artifacts. To show the correspondence more clearly, four vessels have been manually outlined in red.
Fig. 10.
OCTA of choroidal vascular networks at different depths. (a) The CC layer, -thick slab under Bruch’s membrane, (b) Sattler’s layer, -thick slab under CC, (c) Haller’s layer, under Bruch’s membrane to the boundary of choroid and sclera, and (d) the sclera layer with projected tailing artifacts. .
4. Discussion
We showed that OMAG, a specific complex signal-based OCTA approach initially developed in our lab, is better suited to resolve more detailed lobular vascular network of the CC than other conventional OCTA approaches, i.e., amplitude and phase signal-based OCTA. The comparison between each approach illustrated that the complex signal-based approach preserved the entirety of the original OCT signal by combining and utilizing the attributes of both other approaches, that is, the amplitude approach contributed most of the OCTA signal strength with the phase approach, providing a useful addition to sensitivity for slow flow. Another key aspect in visualizing the CC is correct segmentation. Instead of using the automatic segmentation technique provided by the imaging devices, we opted for a previously reported semiautomatic segmentation approach,35 which introduced greater flexibility in slab definition. Figure 3 shows that misplacement of slabs could cost researchers dearly when trying to visualize the CC. Additionally, we introduced a geometrical mean approach to boost the SNR in an attempt to compensate for the limited OCTA resolution in resolving detailed CC flow. Our results suggest that GM approach is especially more beneficial in reducing noises in OCTA phase signals. As GM would always yield smaller values compared to AM, it introduces less fluctuation, thus, AM and GM combined results in higher SNR.
One study37 has shown that with a 400-kHz SS-OCT, variable interscan time analysis is capable of resolving more CC and choroidal vessels, with the assumption that longer interscan time reveals slower flows at CC and choroid. However, the use of similar tactics in this study did not lead to significant increase in the visualization of vessels within the CC. This discrepancy is most likely a result of the fact that the 68-kHz light source of the AngioPlex produces a longer interscan time (4.5 ms), whereas the 400-kHz source used by Choi et al. has a shorter interscan time (). Therefore, we believe that slower commercial OCT system provides enough capacity to visualize CC yet faster lab-built system would offer more flexibility.
Our results showed good correlation with previous histological findings. Previous histological studies7 have shown that the capillaries are tightly organized and separated by septa, the feeding vessels for which can be observed as the very small black holes on OMAG images as shown in Figs. 8 and 9. We have also observed the radial capillary pattern as previously described.7 To the best of our knowledge, this is the first time this feature has been observed by OCT complex angiograms using commercially available OCTA systems. When moving to a deeper depth as shown in Fig. 9, we observed larger dark choroidal vessels that seem to be feeding arterioles of CC as well as surrounding draining venules around the CC lobules. By showing that OCTA can visualize such structures, future studies on further examination and quantification of CC may provide more insights on whether the loss of CC in certain disease can be observed with changes in those small black holes as feeding arterioles. In our study, no obvious intersubject variations were observed. The distribution of CC follows the “denser under macula, sparser in the peripheral” pattern in all the subjects examined. We also observed a trend of less dense CC overall in older subjects compared to younger ones. However, our sample size () is way too small to draw any conclusions here. As explained earlier, the deeper vessels of the choroid appear dark because of the weak back scattered signals. As the anisotropic factor of RBCs is around 0.99,40 the majority of the interacting photons will scatter forward in blood vessels with only the minority scattering backward. From those backscattered photons, very few penetrate through the RPE one more time to interfere with the lights from the reference arm. For this reason, the blood vessels in deep choroidal tissues presented in OCTA images are relatively dark instead of white. Figure 10 showed that even though these large vessels are dark in choroid slab, the tailing artifacts of them in sclera appear to be bright. These tailing artifacts might be useful as an indicator of choroidal vessels as they are notoriously difficult to visualize with OCTA, but further studies are needed for validation.
It should be noted, however, that our study is not without limitations. The first of which is light penetration. While we have shown that with a commercially available SD-OCT it is possible to observe lobular structures in the periphery, the smaller vessel diameter, increased vessel density of the CC, and thicker RPE under the fovea make in-depth visualization more difficult in this region. To overcome this, an SS-OCTA with higher power and better penetration may be required to provide reliable imaging of the CC for the improved ability of visualization and quantification. The second limitation resides the trade-off between imaging FoV and pixel spacing. Current scanning speeds limit the acquisition of large, high-resolution FoV images of the CC, particularly in clinical settings, and while our employment of a montage scanning protocol to achieve both high-resolution and large FoV overcame this limitation, it did so at the cost of scanning time. It is suspected, however, that future technological advances might resolve this issue. One last limitation is that the image processing strategies to contrast the CC as proposed here is not yet available in the commercial OCTA systems at the time this study was performed. Further studies are clearly needed for this type of additional postprocessing and to confirm the algorithm’s reliability, repeatability, and applicability in imaging the CC that can provide clinically relevant information.
Despite these limitations, our approach has demonstrated commercially available SD-OCT’s capacity in visualizing CC. We have also demonstrated that it is possible to identify the feeding arterioles of the CC, which could be instrumental in improving our understanding of the role played by the choroidal circulation in the pathological processes of ocular diseases. If implemented in the commercial systems, such a technique could potentially serve as a tool for the early diagnosis of CC malfunction or atrophy, which could subsequently aid in our comprehension of RPE impairment and choroidal circulation.
5. Conclusion
In this study, we demonstrated in vivo imaging of the CC of healthy individuals using an AngioPlex SD-OCT (Carl Zeiss Meditec Inc., Dublin, California) with a 68-kHz A-line acquisition speed and an 840-nm central wavelength. Complex signal-based OMAG was used to visualize architectural morphology of the CC with our results corroborating previous histological and electron micrograph corrosion casting findings. Lobular vascular networks were seen alongside feeding arterioles being identified and confirmed by 3-D vascular network information. The ability to visualize the CC with a commercialized system is promising that future extensive clinical imaging studies can examine the role of the CC in ocular diseases, such as DR, AMD, or retinitis pigmentosa. With the capacity of 3-D imaging of the whole posterior segment of the eye, OCTA promises to advance our current understanding of pathogenesis, early diagnosis, and treatment monitoring of ocular diseases and could potentially revolutionize the way clinicians manage patients.
Acknowledgments
This work was supported in part by the National Institutes of Health with a contract from the National Eye Institute (Nos. R01-EY024158 and K08 EY023998), and the Research to Prevent Blindness (New York, New York).
Biography
Biographies for the authors are not available.
Disclosures
Dr. Wang and Dr. Gregori received research support from Carl Zeiss Meditec, Inc. Dr. Gregori and the University of Miami co-own a patent that is licensed to Carl Zeiss Meditec, Inc. Dr. Wang and the Oregon Health and Science University co-own a patent that is licensed to Carl Zeiss Meditec, Inc. and Kowa, Inc. Dr. Wang also received research supports from Tasso, Inc. and Colgate-Palmolive Company while being a consultant to Insight Photonic Solutions. Ms. Chu, Dr. Chen, Dr. Zhang, and Dr. Pepple have no financial disclosures. Dr. Durbin is an employee of Carl Zeiss Meditec, Inc.
References
- 1.Lutty G., et al. , “Changes in choriocapillaris and retinal pigment epithelium in age-related macular degeneration,” Mol. Vis. 5(5), 35 (1999). [PubMed] [Google Scholar]
- 2.Bhutto I., Lutty G., “Understanding age-related macular degeneration (AMD): relationships between the photoreceptor/retinal pigment epithelium/Bruch’s membrane/choriocapillaris complex,” Mol. Aspects Med. 33(4), 295–317 (2012). 10.1016/j.mam.2012.04.005 [DOI] [PMC free article] [PubMed] [Google Scholar]
- 3.Herbort C. P., “Posterior uveitis: new insights provided by indocyanine green angiography,” Eye 12(5), 757–759 (1998). 10.1038/eye.1998.198 [DOI] [PubMed] [Google Scholar]
- 4.Cao J., et al. , “Choriocapillaris degeneration and related pathologic changes in human diabetic eyes,” Arch. Ophthalmol. 116(5), 589–597 (1998). 10.1001/archopht.116.5.589 [DOI] [PubMed] [Google Scholar]
- 5.Piccolino F. C., Borgia L., “Central serous chorioretinopathy and indocyanine green angiography,” Retina 14(3), 231–242 (1994). 10.1097/00006982-199414030-00008 [DOI] [PubMed] [Google Scholar]
- 6.Hayreh S. S., “The choriocapillaris,” Albrecht von Graefes Arch. Klin. Exp. Ophthalmol. 192(3), 165–179 (1974). 10.1007/BF00416864 [DOI] [PubMed] [Google Scholar]
- 7.Torczynski E., Tso M. O., “The architecture of the choriocapillaris at the posterior pole,” Am. J. Ophthalmol. 81(4), 428–440 (1976). 10.1016/0002-9394(76)90298-1 [DOI] [PubMed] [Google Scholar]
- 8.Krey H. F., “Segmental vascular patterns of the choriocapillaris,” Am. J. Ophthalmol. 80(2), 198–202 (1975). 10.1016/0002-9394(75)90132-4 [DOI] [PubMed] [Google Scholar]
- 9.Sarks J., Sarks S., Killingsworth M., “Evolution of geographic atrophy of the retinal pigment epithelium,” Eye 2(Pt. 5), 552–577 (1988). 10.1038/eye.1988.106 [DOI] [PubMed] [Google Scholar]
- 10.McLeod D. S., et al. , “Relationship between RPE and choriocapillaris in age-related macular degeneration,” Invest. Ophthalmol. Visual Sci. 50(10), 4982–4991 (2009). 10.1167/iovs.09-3639 [DOI] [PMC free article] [PubMed] [Google Scholar]
- 11.Mullins R. F., et al. , “Choriocapillaris vascular dropout related to density of drusen in human eyes with early age-related macular degeneration,” Invest. Ophthalmol. Visual Sci. 52(3), 1606–1612 (2011). 10.1167/iovs.10-6476 [DOI] [PMC free article] [PubMed] [Google Scholar]
- 12.Gerl V. B., et al. , “Extensive deposits of complement C3d and C5b-9 in the choriocapillaris of eyes of patients with diabetic retinopathy,” Invest. Ophthalmol. Visual Sci. 43(4), 1104–1108 (2002). [PubMed] [Google Scholar]
- 13.Hyvarinen L., et al. , “Fluorescein angiography of the choriocapillaris,” Am. J. Ophthalmol. 67(5), 653–666 (1969). 10.1016/S0002-9394(69)90987-8 [DOI] [PubMed] [Google Scholar]
- 14.Hayashi K., Hasegawa Y., Tokoro T., “Indocyanine green angiography of central serous chorioretinopathy,” Int. Ophthalmol. 9(1), 37–41 (1986). 10.1007/BF00225936 [DOI] [PubMed] [Google Scholar]
- 15.Pauleikhoff D., et al. , “A fluorescein and indocyanine green angiographic study of choriocapillaris in age-related macular disease,” Arch. Ophthalmol. 117(10), 1353–1358 (1999). 10.1001/archopht.117.10.1353 [DOI] [PubMed] [Google Scholar]
- 16.Wang R. K., “Optical microangiography: a label-free 3-D imaging technology to visualize and quantify blood circulations within tissue beds in vivo,” IEEE J. Sel. Top. Quantum Electron. 16(3), 545–554 (2010). 10.1109/JSTQE.2009.2033609 [DOI] [PMC free article] [PubMed] [Google Scholar]
- 17.Gao S. S., et al. , “Optical coherence tomography angiography,” Invest. Ophthalmol. Visual Sci. 57(9), OCT27–OCT36 (2016). 10.1167/iovs.15-19043 [DOI] [PMC free article] [PubMed] [Google Scholar]
- 18.Chen C.-L., Wang R. K., “Optical coherence tomography based angiography,” Biomed. Opt. Express 8(2), 1056–1082 (2017). 10.1364/BOE.8.001056 [DOI] [PMC free article] [PubMed] [Google Scholar]
- 19.Kurokawa K., et al. , “Imaging choriocapillaris with adaptive optics optical coherence tomography angiography,” Invest. Ophthalmol. Visual Sci. 57(12), 5915 (2016). [Google Scholar]
- 20.Fingler J., et al. , “Volumetric microvascular imaging of human retina using optical coherence tomography with a novel motion contrast technique,” Opt. Express 17(24), 22190–22200 (2009). 10.1364/OE.17.022190 [DOI] [PMC free article] [PubMed] [Google Scholar]
- 21.Mariampillai A., et al. , “Optimized speckle variance OCT imaging of microvasculature,” Opt. Lett. 35(8), 1257–1259 (2010). 10.1364/OL.35.001257 [DOI] [PubMed] [Google Scholar]
- 22.Huang Y., et al. , “Swept-source OCT angiography of the retinal vasculature using intensity differentiation-based optical microangiography algorithms,” Ophthalmic Surg. Lasers Imaging Retina 45(5), 382–389 (2014). 10.3928/23258160-20140909-08 [DOI] [PMC free article] [PubMed] [Google Scholar]
- 23.Wang R. K., et al. , “Depth-resolved imaging of capillary networks in retina and choroid using ultrahigh sensitive optical microangiography,” Opt. Lett. 35(9), 1467–1469 (2010). 10.1364/OL.35.001467 [DOI] [PMC free article] [PubMed] [Google Scholar]
- 24.Ashton N., “Observations on the choroidal circulation,” Br. J. Ophthalmol. 36(9), 465–481 (1952). 10.1136/bjo.36.9.465 [DOI] [PMC free article] [PubMed] [Google Scholar]
- 25.Wybar K. C., “A study of the choroidal circulation of the eye in man,” J. Anat. 88(1), 94–98 (1954). [PMC free article] [PubMed] [Google Scholar]
- 26.Kurokawa K., Liu Z., Miller D. T., “Adaptive optics optical coherence tomography angiography for morphometric analysis of choriocapillaris,” Biomed. Opt. Express 8(3), 1803–1822 (2017). 10.1364/BOE.8.001803 [DOI] [PMC free article] [PubMed] [Google Scholar]
- 27.Kurokawa K., et al. , “Three-dimensional retinal and choroidal capillary imaging by power Doppler optical coherence angiography with adaptive optics,” Opt. Express 20(20), 22796–22812 (2012). 10.1364/OE.20.022796 [DOI] [PubMed] [Google Scholar]
- 28.Braaf B., et al. , “Phase-stabilized optical frequency domain imaging at for the measurement of blood flow in the human choroid,” Opt. Express 19(21), 20886–20903 (2011). 10.1364/OE.19.020886 [DOI] [PubMed] [Google Scholar]
- 29.Choi W., et al. , “Choriocapillaris and choroidal microvasculature imaging with ultrahigh speed OCT angiography,” PloS One 8(12), e81499 (2013). 10.1371/journal.pone.0081499 [DOI] [PMC free article] [PubMed] [Google Scholar]
- 30.Braaf B., et al. , “Real-time eye motion correction in phase-resolved OCT angiography with tracking SLO,” Biomed. Opt. Express 4(1), 51–65 (2013). 10.1364/BOE.4.000051 [DOI] [PMC free article] [PubMed] [Google Scholar]
- 31.Baran U., et al. , “High resolution imaging of acne lesion development and scarring in human facial skin using OCT‐based microangiography,” Lasers Surg. Med. 47(3), 231–238 (2015). 10.1002/lsm.v47.3 [DOI] [PMC free article] [PubMed] [Google Scholar]
- 32.Zagaynova E., et al. , “Endoscopic OCT with forward‐looking probe: clinical studies in urology and gastroenterology,” J. Biophotonics 1(2), 114–128 (2008). 10.1002/jbio.200710017 [DOI] [PubMed] [Google Scholar]
- 33.Arevalo J. F., Retinal Angiography and Optical Coherence Tomography, Springer, Berlin: (2009). [Google Scholar]
- 34.Zhang A., Zhang Q., Wang R. K., “Minimizing projection artifacts for accurate presentation of choroidal neovascularization in OCT micro-angiography,” Biomed. Opt. Express 6(10), 4130–4143 (2015). 10.1364/BOE.6.004130 [DOI] [PMC free article] [PubMed] [Google Scholar]
- 35.Yin X., Chao J. R., Wang R. K., “User-guided segmentation for volumetric retinal optical coherence tomography images,” J. Biomed. Opt. 19(8), 086020 (2014). 10.1117/1.JBO.19.8.086020 [DOI] [PMC free article] [PubMed] [Google Scholar]
- 36.Shi L., et al. , “Wide velocity range Doppler optical microangiography using optimized step-scanning protocol with phase variance mask,” J. Biomed. Opt. 18(10), 106015 (2013). 10.1117/1.JBO.18.10.106015 [DOI] [PMC free article] [PubMed] [Google Scholar]
- 37.Choi W., et al. , “Ultrahigh-speed, swept-source optical coherence tomography angiography in nonexudative age-related macular degeneration with geographic atrophy,” Ophthalmology 122(12), 2532–2544 (2015). 10.1016/j.ophtha.2015.08.029 [DOI] [PMC free article] [PubMed] [Google Scholar]
- 38.Reif R., et al. , “Quantifying optical microangiography images obtained from a spectral domain optical coherence tomography system,” Int. J. Biomed. Imaging 2012, 1–11 (2012). 10.1155/2012/509783 [DOI] [PMC free article] [PubMed] [Google Scholar]
- 39.Zhang Q. Q., et al. , “Projection artifact removal enables accurate presentation and monitoring of choroidal neovascularization imaged by optical coherence tomography angiography,” Ophthalmol. Retina 1, 124–136 (2017). 10.1016/j.oret.2016.08.005 [DOI] [PMC free article] [PubMed] [Google Scholar]
- 40.Friebel M., et al. , “Determination of optical properties of human blood in the spectral range 250 to 1100 nm using Monte Carlo simulations with hematocrit-dependent effective scattering phase functions,” J. Biomed. Opt. 11(3), 034021 (2006). 10.1117/1.2203659 [DOI] [PubMed] [Google Scholar]


