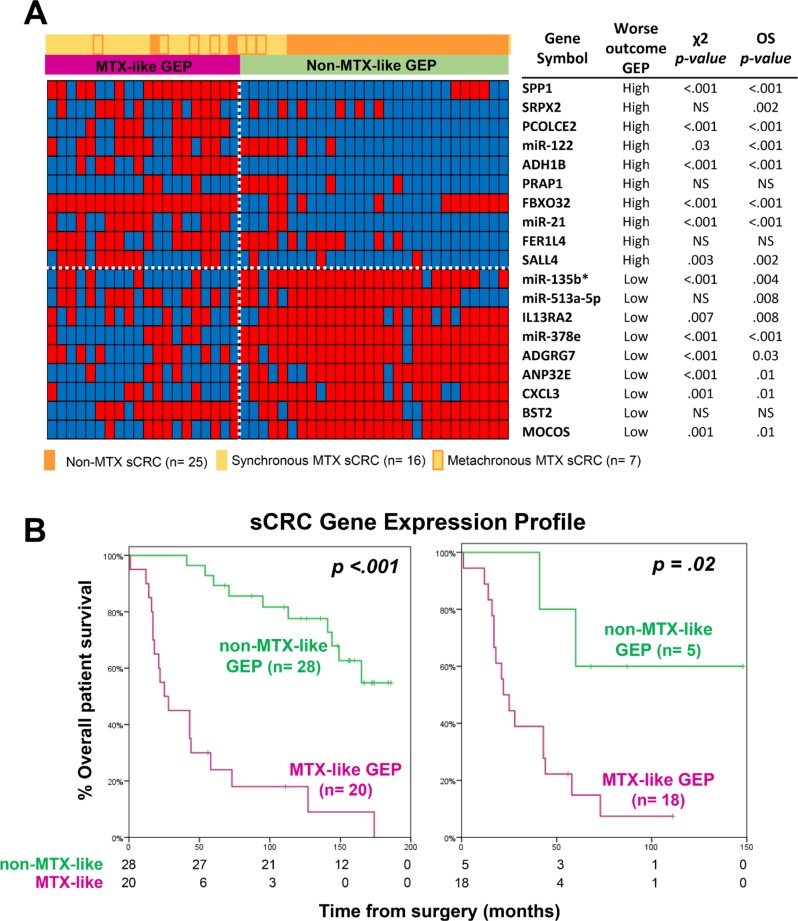
Figure 3. Prognostic impact of the GEP classifier based on those 19 coding plus non-coding genes that better differentiated between metastatic and non-metastatic sCRC.
(A) Heatmap of categorized (dichotomized) gene expression levels -low (blue) versus high (red)- observed among metastatic (n = 23) vs. non-metastatic (n = 25) sCRC tumors, and its association with the two GEP tumor subgroups shown in Figure 2. In the right, the impact of the expression levels of each of the discriminating genes on overall survival (OS) is shown. (B) Prognostic impact of the overall GEP for those 19 discriminating genes selected, on overall survival for both the whole series (n = 48; left panel) and patients with metastatic liver disease (n = 23; right panel).

