

Abstract
Objective
This study aimed to evaluate the incidence of cervical cancer by nativity [United States (US) versus non-US], neighborhood socioeconomic status and ethnic enclave among Hispanics and Asians in California.
Methods
Using data from the California Cancer Registry, information on all primary invasive cervical cancer (Cca) patients diagnosed in California from January 1, 1990 through December 31, 2004 was obtained. We analyzed the influence of enclave, socioeconomic status and nativity on Cca incidence.
Results
Among the 22,189 Cca cases diagnosed between 1990 and 2004, 50% were non-Hispanic white, 39% Hispanic and 11% Asian women, and 63% US-born. Seventy percent of the Cca cases were squamous cell carcinoma, 19% adenocarcinoma and 11% other histologies. Higher incidence of Cca was observed in high enclave (76%) and low socioeconomic status (70%) neighborhoods. By ethnic group, US-born women showed lower rates of squamous cell carcinoma compared to foreign-born women. Hispanics living in low socioeconomic and high enclave had 12.7 times higher rate of Cca than those living in high socioeconomic, low enclave neighborhoods. For Asian women incidence rates were 6 times higher in the low socioeconomic, high enclave neighborhoods compared to those living in high socioeconomic, low enclave neighborhoods.
Conclusion
More targeted outreach to increase Pap smear screening and human papilloma virus vaccination for women living in high enclave neighborhoods can help decrease the incidence of Cca in these groups of women.
Keywords: Cervical cancer, Ethnicity, Socioeconomic status, Incidence rate
Invasive cervical cancer (Cca) used to be the principal cause of cancer death for women in the United States. Since the introduction of the Pap smear, the incidence of Cca has declined considerably [1]. However, 12,360 new Cca cases and 4020 deaths related to this disease are still expected in 2014 [2]. Moreover, significant disparities exist based on ethnicity and socioeconomic status (SES) [3–9]. For example, according to the Center for Disease Control and Prevention, Hispanic women show a higher rate of Cca than US women from all other ethnicities [8]. Discrepancies also exist between different Asian subgroups with more Cca cases in Vietnamese women compared to other Asians ethnicities [10,11]. Additionally, foreign-born (FB) women and women living in higher poverty counties seem to have a greater incidence of Cca [3], and SEER data also demonstrate a 30% higher incidence and 71% higher mortality rate from Cca for women living in counties with high poverty as compared to wealthier counties [4].
California, with its large and diverse population, provides a unique opportunity for studying the influence of both ethnicity and SES on Cca. Hispanic and Asian populations represent two of the largest and fastest growing immigrant and minority populations in the United States and California. In 2011, the California population was 14% Asian and 38% Hispanic [12]. These two ethnic groups include women from many different countries of origin and cultures, as well as immigration histories, all of which can influence their lifestyle and risk factors, as well as their SES and access to health care. Additionally, these populations continue to immigrate, allowing for an analysis on the impact of place of birth (nativity). Finally, subpopulations of these minorities show different degrees of integration facilitating the study of the influence of neighborhood, including the SES and enclave features. Here, we refer to ethnic enclaves as neighborhoods that maintain more cultural mores and are ethnically distinct from the surrounding area.
This study aimed to evaluate the impact of nativity, SES and ethnic enclave on the incidence of Cca in California to identify particularly high risk populations to target with Cca screening and vaccination programs.
Methods
Cancer cases from the California Cancer Registry (CCR), comprising four of the National Cancer Institute’s Surveillance Epidemiology and End Results (SEER) program registries [13] were reviewed. Information on all California residents diagnosed with primary Cca (International Classification of Diseases for Oncology, 3rd Edition [ICD-O-3] site code 153.9) from January 1, 1990 through December 31, 2004 was obtained. Data were restricted to this time period due to available population estimate data defined by nativity and the neighborhood factors of interest.
Primary Cca cases were classified according to histologic type as squamous cell carcinoma (histology codes 8050–8130), adenocarcinoma (histology codes 8140–8490), and others (histology codes 8000–8046 and 8500–9582). Tumors were classified by stage (SEER summary stage) as localized, regional (regional extension, regional nodes, regional extension and nodes, and regional NOS), distant, and unknown (blank and unspecified).
Classification of Asian race was improved by application of the North American Association of Central Cancer Registries Pacific Islander Identification Algorithm [14], and Hispanic ethnicity was improved by application of the North American Association of Central Cancer Registries Hispanic Identification Algorithm [15].
Because patients in the cancer registry with unknown birthplace data are more likely to be US-born than those with available data [16–19], a method on the basis of patients’ social security numbers (SSN) to classify patient immigrant status, as described previously [20], was developed. Among Asian subgroups, registry data on nativity were available for 79.4% (76.4% from hospital medical records and 3.1% from death certificates) of eligible cases. For the 20.6% of cases with unknown birthplace, statistical imputation using the patient’s SSN was used to determine immigrant status, as SSN sequences are associated with its year of issue. By comparing the age of SSN issue with self-reported birthplace in previously interviewed cancer patients (n = 1836) and based on maximization of the area under the receiver operating characteristic curve and confirmation with logistic regression modeling, patients receiving a SSN before age 25 years were considered US-born, and those who had received an SSN at or after age 25 years as foreign-born. This age cut point resulted in 84% sensitivity and 80% specificity for assigning foreign-born status across the Asian populations. The 1.8% of cases with missing or invalid SSNs was assigned an immigrant status on the basis of the ethnicity–sex–age birthplace distribution of the overall sample. Incidence rates for US-born Korean, South Asian and Vietnamese patients were not computed due to small case (N = 27 for all 3 groups) and population numbers.
Among Hispanics, registry data on nativity were available for 77.6% (74.3% from hospital medical records and 3.4% from death certificates) of eligible cases. We estimated nativity for the minority of patients with unknown birthplace as above. For Hispanics, those who received their SSN before age 20 years were considered US-born and those who received their SSN at or after age 20 years were considered foreign-born. The cut point of 20 years was determined by comparisons with self-reported nativity from interviews with 1127 Hispanic cancer patients [16,17] as noted above. The age cut point of 20 years resulted in 81% sensitivity and 80% specificity for detecting foreign-born status in Hispanics. The 5.0% of Hispanic cases with missing or invalid SSNs were assigned a nativity status based on the known distribution of nativity within matched strata of race/ethnicity, sex, and age in the overall California Cancer Registry patient population. Analyses for detailed Hispanic subgroups (e.g., Mexican and Puerto Rican) could not be conducted given the substantial proportion (>40%) of cases classified as “Hispanic, not otherwise specified” on Hispanic origin. Approximately 84% of California Hispanics are of Mexican origin [21,22], followed by 9% of Central American origin [22]. By using patient residential address and small-area (census tract) information from the 2000 US Census, we classified neighborhood SES for all patients and ethnic enclave status for every Hispanic and Asian patient. Analyses using these variables were limited to the pericensal period between January 1st, 1998 and December 31st, 2002, and included 7373 cases of Cca among NH Whites, Hispanics, and Asian subgroups. A neighborhood-level measure of SES based on a previously described index that incorporates 2000 US Census data on education, occupation, unemployment, household income, poverty, rent, and house values was assigned [23]. Ninety five percent (95.2%) of patients’ address at diagnosis was geocoded to a census tract. The remaining cases without a street address or whose address could not be precisely geocoded (4.8%) were randomly assigned to a census tract within their ZIP code of residence. Based on residential census tracts, each patient was assigned to a quintile of neighborhood SES according to the statewide distribution of the SES index across all census tracts in California [24]. For the analysis, quintiles 1 to 2 (lower SES) and quintiles 3 to 5 (higher SES) were combined.
Patients were classified according to neighborhood Hispanic (for Hispanic race/ethnicity) and Asian (for Asian/Pacific Islander race/ethnicity) enclave status based on the concept of an ethnic enclave as a geographic unit with higher concentration of foreign-born race/ethnicity-specific residents and language(s) than other geographic units in California. As described previously [24–26], residence in an enclave was characterized by applying principal components analysis [27] to 2000 US Census block group level data on selected census variables, which was, in turn averaged to the census tract level. For Hispanics, data on linguistic isolation, English fluency, Spanish language use, Hispanic ethnicity, immigration history, and nativity were included. For Asians, data on linguistic isolation, English fluency, Asian language use, Asian race, and immigration history were included. Each case was assigned to a quintile of neighborhood ethnic enclave status based on the distribution of the enclave index across all census tracts in California [23]. Quintiles 1 to 3 (lower enclave status) and quintiles 4 to 5 (higher enclave status) were combined for the analysis.
From the 1990 and 2000 US Census Summary File 3 (SF-3), population counts to estimate incidence rates by sex, race/ethnicity, immigrant status, and 5-year age group for California were obtained. For intercensal years, the foreign-born Hispanic and Asian population sizes were estimated by using cohort component interpolation and extrapolation methods [28], adjusting estimates to the populations by age and year provided by the US Census for years 1990 to 2004, based on data availability. Data from the 5% integrated public use microdata sample of the census to estimate age- and birthplace-specific population counts for the Asian ethnic groups [26,29] were also used by smoothing with a spline-based function [30]. For the analyses of neighborhood SES and ethnic enclave status, 2000 US Census population estimates by race/ethnicity and sex at the census tract level were used. Because census data on nativity are not available at the census tract level, the database containing nativity data was separate from the one containing neighborhood SES and ethnic enclave status, and these variables could not be cross-classified.
Statistical analyses
SEER Stat software 8.0 [15] was used to compute age-adjusted incidence rates (directly standardized to the 2000 US standard million population) with 95% CIs. To comply with CCR regulations, case counts or rates based on fewer than 5 cases were not present. Age-adjusted incidence rates according to race/ethnicity and nativity are stratified by tumor pathology, summary stage and age group at diagnosis (15–39 years of age, 40–59 years of age, and 60+ years of age) for the period 1990–2004. Time trends between 1990 and 2004 were examined using Joinpoint Regression software [31] to calculate the annual percentage changes (APCs) in log-linear regression models that allowed up to two Joinpoints. Age-adjusted incidence rates were also computed according to race/ethnicity stratified by neighborhood SES and/or enclave status for individual tumor pathologies for the period 1998–2002.
Results
Between 1990 and 2004, 22,189 Cca cases were diagnosed among non-Hispanic White, Hispanic, and Asian American women living in California and were included in this analysis (Table 1). Histology distribution included 70% with SCC, 19% with adenocarcinoma and 11% other histologies. Forty-four percent (44%) of women were between age 40 and 59, 30% were between 15 and 39, and 26% were older than 59 years old. Approximately, half of patients had localized disease (51%), 32% regional disease, 10% distant disease and 7% unknown. In this population, 11,125 were NHW women, 8670 Hispanic and 2394 Asian women. Among Asians, 6 different ethnic populations are included that comprised approximately 85% of all non-Hispanic Asian and Pacific Islander patients with Cca in the CCR in the study period. Five hundred fifteen (515) (21.7%) cases were Chinese, 213 (8.9%) Japanese, 773 (32.3%) Filipino, 310 (12.9%) Korean, 93 (3.9%) South Asian (including Asian Indians, Pakistanis, Sri Lankans, and Bangladeshis), and 490 (20.5%) Vietnamese. The vast majority of Hispanic and Asian women diagnosed with Cca during this time period were FB, 70% and 91% respectively. Principal demographic and tumor characteristic difference between groups (Table 1) included a larger proportion of FB women older than 60 years old compared to US-born groups, reflecting their distributions in the general population. Moreover, a higher percentage of South Asian women had distant disease (12%) and a larger proportion of US-born Chinese had localized disease (65%).
Table 1.
Select demographic and tumor characteristics among California females diagnosed with invasive cervical cancer, 1990–2004.
| NHWa
|
Hispanic
|
Asian
|
Total
|
|||||||||
|---|---|---|---|---|---|---|---|---|---|---|---|---|
| N | % | US born
|
Foreign born
|
US born
|
Foreign born
|
N | % | |||||
| N | % | N | % | N | % | N | % | |||||
| Total invasive | 11,125 | 100 | 2624 | 100 | 6046 | 100 | 227 | 100 | 2167 | 100 | 22,189 | 100 |
| Histology | ||||||||||||
| SCCb | 7371 | 66.3 | 1897 | 72.3 | 4612 | 76.3 | 123 | 54.1 | 1549 | 71.5 | 15,552 | 70 |
| Adenocarcinoma | 2392 | 21.5 | 452 | 17.2 | 859 | 14.2 | 68 | 30.0 | 400 | 18.5 | 4171 | 19 |
| Other | 1362 | 12.2 | 275 | 10.5 | 575 | 9.5 | 36 | 15.9 | 218 | 10.0 | 2466 | 11 |
| Age group | ||||||||||||
| 15–39 | 3282 | 29.5 | 1119 | 42.6 | 1840 | 30.4 | 88 | 38.8 | 274 | 12.6 | 6603 | 30 |
| 40–59 | 4667 | 42.0 | 1070 | 40.8 | 2863 | 47.4 | 101 | 44.5 | 1040 | 48.0 | 9741 | 44 |
| 60+ | 3174 | 28.5 | 435 | 16.6 | 1342 | 22.2 | 38 | 16.7 | 853 | 39.4 | 5842 | 26 |
| Stage | ||||||||||||
| Local | 5863 | 52.7 | 1421 | 54.2 | 2889 | 47.8 | 126 | 55.5 | 1025 | 47.3 | 11,324 | 51 |
| Regional | 3431 | 30.8 | 790 | 30.1 | 2113 | 34.9 | 63 | 27.7 | 822 | 37.9 | 7219 | 32 |
| Distant | 1211 | 10.9 | 220 | 8.4 | 564 | 9.3 | 24 | 10.6 | 186 | 8.6 | 2205 | 10 |
| Unknown | 621 | 5.6 | 203 | 7.7 | 485 | 8.0 | 14 | 6.2 | 134 | 6.2 | 1457 | 7 |
NHW data from: “California Cancer Registry (www.ccrcal.org), California Department of Public Health, Cancer Surveillance and Research Branch. SEER*Stat Database: Incidence — California, February 2012 (1988–2009), 03/07/2012; NAACCR 3339 Version. Benchmarked 1988–1989 DOF population estimates, 6/12/2006; NCHS population estimates for 1990– 1999, 7/26/2004; NCHS population estimates for 2000–2009, 07/23/2010”.
All other Asian or Hispanic subgroup data from: “Statewide CCR data received Jan 2007. Population estimates of Nativity computed by Tim Miller. Nativity based on Birthplace, SSN Yr/Age Issued or by random assignment.”
NHW: non-Hispanic White.
SCC: squamous cell carcinoma.
From 1990 to 2004, the incidence of Cca declined significantly for all groups of women except for US-born Asian women, among whom rates were already low (Fig. 1). There was a reduction of SCC incidence for all groups of women (Fig. 1). Among Asian ethnic subgroups, FB-Vietnamese had the greatest annual percentage of change (APC) between 1992 and 2002 for SCC (−14.19) compared to all other ethnic groups. The incidence of adenocarcinoma did not show a significant decrease with the exception of FB-Asian women, who had a significant decrease in adenocarcinoma incidence (Fig. 1). Local and regional diseases declined significantly over the 14-year period for NHW, FB-and US-born Hispanics and FB-Asian [APC: −2.58, −4.39, −12.42 (2000–2004), −5.62 for local disease and −2.06, −3.96, −2.27 and −6.73 for regional disease respectively]. The incidence of distant disease has only decreased significantly in FB-Hispanics and Asian (APC: −5.71 and −4.40, respectively).
Fig. 1.
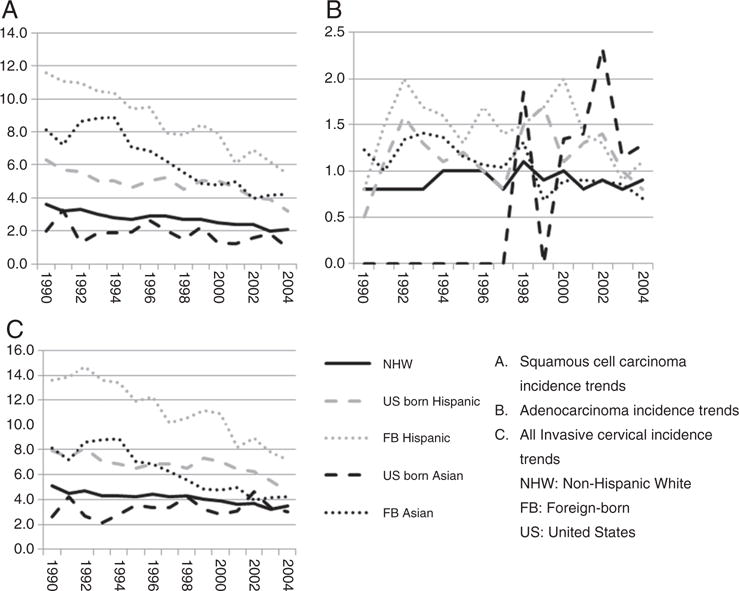
Invasive cervical cancer trends for California non-Hispanic White, Hispanic and Asian subgroups by nativity, 1990–2004. *Total: incidence rate for cervical cancer. APC for NHW: −2.44+ (1990–2004); −6.37+ (1990–1994), 2.00 (1994–1997), −5.03+ (1997–2004); −0.60 (1990–2004), for total invasive cervical cases, SCC and adenocarcinoma, respectively. APC for US born Hispanic: −1.40+ (1990–2002), −15.06 (2002–2004); −5.15+ (1990–1995), 1.45 (1995–2000), −9.84+ (2000–2004); 0.22 (1990–2004), for total invasive cervical cases, SCC and adenocarcinoma, respectively. APC for FB Hispanic: −4.64+ (1990–2004); −5.07+ (1990–2004); −1.76 (1990–2004), for total invasive cervical cases, SCC and adenocarcinoma, respectively. APC for US-born Asiatic: 1.15 (1990–2004); −3.62+ (1990–2004); N/A, for total invasive cervical cases, SCC and adenocarcinoma, respectively. APC for FB Asiatic: 3.74 (1990–1993), −7.32+ (1994–2004); 5.62 (1990–1992), −8.07+ (1993–2004); −3.95+ (1990–2004), for total invasive cervical cases, SCC and adenocarcinoma, respectively. +: indicates a significant APC. N/A: cannot calculate due to low frequency of cases.
NHW vs other ethnicity
Compared to NHW, there was a higher incidence of Cca in FB-Vietnamese, Hispanics, Korean, Filipino and Japanese women and in US-born Hispanics (Fig. 2). However, Chinese, FB-South Asian, and US-born Japanese and Filipino women had lower or comparable incidence of Cca than NHW.
Fig. 2.
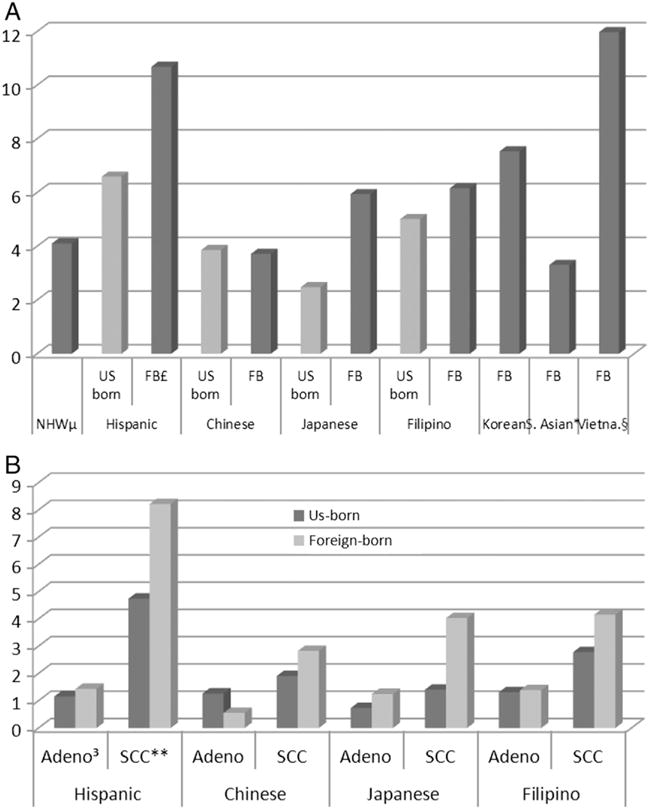
Invasive cervical cancer incidence rates per 100,000, for all subgroups of women in California, 1990–2004. A. Total invasive cervical cancer rates per 100,000 for all subgroups of women. B. Adenocarcinoma and squamous cell carcinoma incidence rate per 100,000, comparing US-born with foreign-born women of the same ethnicity. (For all the data please see Supplement 1.) μ: non-Hispanic white, £: foreign-born, *: South Asian, §: Vietnamese, 3: adenocarcinoma, **: squamous cell carcinoma.
Concerning histology, US-born Chinese and Japanese had a lower rate of SCC, and FB-Korean had a higher rate of SCC compared to NHW. Those three groups of women had a similar rate of adenocarcinoma compared to NHW. For FB-South Asian and Chinese, the difference with NHW was only for adenocarcinoma. Regarding incidence rates by age, all FB groups and US-born Hispanic had higher rates compared to NHW among women older than 60 years old (Fig. 2). Concerning stage, FB-Hispanics and US-born Filipino had higher IRRs for distant disease compared to NHW. Compared to all other ethnic groups, highest rates of Cca per 100,000 were seen among FB-Vietnamese, and FB-Koreans, US-born Japanese and Filipino had higher percentages of adenocarcinoma (31% and 26%, respectively).
Nativity (FB vs US-born)
Within each ethnic group, FB women showed higher rates of SCC compared to US-born women (Fig. 2). FB-Hispanic and FB-Japanese women had also more adenocarcinoma compared to their US-born counterparts. However, FB-Chinese had less adenocarcinoma compared to US-born Chinese. Concerning age at diagnosis, more FB women were older than 60 years old compared to US-born. The stage distribution was similar comparing US with foreign-born, except for Filipino women for whom there were proportionally more regional disease for FB women compared to US-born women.
Socioeconomic status (SES)
Seventy percent (70%) of Cca were diagnosed among residents of low SES neighborhoods (lowest two quintiles statewide). For NHW, Hispanic and FB-Japanese, FB-Filipina, FB-South Asian and FB-Vietnamese women, most of the Cca cases lived in low SES neighborhoods (58%, 87%, 51%, 63%, 57%, and 72%, respectively). In contrast, for all Chinese, US-born Japanese, and US-born Filipina cases, there was more Cca in the high SES neighborhood quintiles (60%, 72%, 56%, respectively). Regarding histology, higher rates of SCC were seen in low SES neighborhoods for NHW and Hispanics [rate (95% CI); 1.6 (1.5–1.7) vs 1.3 (1.2–1.4) and 2.2 (2.1–2.3) vs 0.4 (0.4–0.5), for low SES and high SES quintile neighborhoods, for NHW and Hispanics, respectively]. For NHW, higher rates of adenocarcinoma were seen in high SES neighborhoods [rate (95% CI); 0.5 (0.4–0.5) and 0.6 (0.6–0.7), for low and high SES neighborhoods, respectively]. However, a higher rate of adenocarcinoma was diagnosed in low SES neighborhoods for Hispanics [rate (95% CI); 0.5 (0.5–0.6) and 0.1 (0.1–0.2), for low and high quintiles SES neighborhood, respectively]. No difference was seen regarding histology and neighborhood SES for Asian subgroups. Stage and age distribution data by SES neighborhood quintiles were not available.
Enclave
Seventy-six percent (76%) of Asian and Hispanic Cca cases were observed in high enclave neighborhoods. The proportion of Cca cases in high quintile ethnic enclave neighborhoods are as follows: Vietnamese 88%, Korean 85%, Chinese 84%, Filipino 75%, Hispanic 75%, and Japanese 52%. In contrast, South Asians had more Cca in less ethnically isolated neighborhoods (51%). Regarding histology, a higher incidence of SCC was noted in high ethnic enclaves for Hispanics and all Asian subgroups [rate (95% CI); 0.5 (0.5–0.6) vs 3 (2.8–3.1) and 0.2 (0.1–0.2) vs 0.8 (0.7–0.9), for low and high ethnic enclaves, for Hispanics and Asians, respectively]. Similarly, higher rates of adenocarcinoma were also observed [rate (95% CI); 0.2 (0.1–0.2) vs 0.6 (0.6–0.7) and 0.1 (0–0.1) vs 0.2 (0.2–0.3), for low and high ethnic enclaves, for Hispanics and Asians, respectively]. Data about age and stage distribution by enclave neighborhoods were not available.
Enclave and socioeconomic status
Excluding cases in NHW women, 67% of Cca were diagnosed in low SES, high enclave neighborhoods. Hispanics living in low SES and high enclave neighborhoods had 12.7 times (95% CI; 11.2–14.3) higher rate of Cca than those living in high SES, low enclave neighborhoods (Table 2). For Asian women, incidence rates were 6 times (95% CI; 4.9–7.5) higher in the low SES, high enclave neighborhoods compared to Asians living in high SES, low enclave neighborhoods. Hispanic and Asian women living in low SES, low enclave neighborhoods also had more Cca than those living in high SES, low enclave neighborhoods [IRR (95% CI); 1.6 (1.4–1.8), 1.2 (0.9–1.6), respectively]. Regarding histologies, Hispanics living in low SES, high enclave neighborhoods had 13.9 (95% CI; 12.0–16.1) times more SCC and 9.0 times more adenocarcinoma (95% CI; 6.9–11.7) than those living in high SES, low enclave neighborhoods. Asian women living in low SES, high enclave neighborhood had 6.7 (95% CI; 5.1–8.8) times more SCC and 4.4 (2.9–6.7) times more adenocarcinoma compared to those living in high SES, low enclave neighborhoods.
Table 2.
Invasive cervical cancer, squamous cell carcinoma and adenocarcinoma incidence rate ratio by enclave and socioeconomic neighborhood for Hispanics and all Asian groups in California, from 1990 to 2004.
| Hispanic
|
All Asian
|
|||||
|---|---|---|---|---|---|---|
| IRR | IRR
|
IRR | IRR
|
|||
| Lower CI | Upper CI | Lower CI | Upper CI | |||
| Total | ||||||
| Enclave, neighborhood SES | ||||||
| Low SES, high enclave | 12.7 | 11.2 | 14.3 | 6.0 | 4.9 | 7.5 |
| Low SES, low enclave | 1.6 | 1.4 | 1.8 | 1.2 | 0.9 | 1.6 |
| High SES, high enclave | 0.7 | 0.5 | 0.8 | 4.2 | 3.3 | 5.2 |
| High SES, low enclave | Reference | Reference | ||||
| SCC | ||||||
| Enclave, neighborhood SES | ||||||
| Low SES, high enclave | 13.9 | 12.0 | 16.1 | 6.7 | 5.1 | 8.8 |
| Low SES, low enclave | 1.6 | 1.3 | 1.9 | 1.3 | 1.0 | 1.8 |
| High SES, high enclave | 0.6 | 0.5 | 0.8 | 4.5 | 3.4 | 6.0 |
| High SES, low enclave | Reference | Reference | ||||
| Adenocarcinoma | ||||||
| Enclave, neighborhood SES | ||||||
| Low SES, high enclave | 9.0 | 6.9 | 11.7 | 4.4 | 2.9 | 6.8 |
| Low SES, low enclave | 1.5 | 1.1 | 2.1 | 0.8 | 0.5 | 1.5 |
| High SES, high enclave | 0.7 | 0.4 | 1.1 | 3.5 | 2.3 | 5.5 |
| High SES, low enclave | Reference | Reference | ||||
SCC: squamous cell carcinoma.
IRR: incidence rate ratio.
SES: socioeconomic status.
CI: 95% confident interval.
Discussion
This study demonstrates the significant impact of nativity, SES and enclave on Cca incidence for Asian and Hispanic women, who have among the highest incidence of Cca of all racial/ethnic groups in the US. Living in lower SES and ethnically concentrated neighborhoods, as well as being foreign-born, was associated with considerably higher incidence. Specifically, IRRs for SCC comparing US-born and FB women of the same ethnic group were higher for all FB women. Higher incidence rate were noted in low SES neighborhoods and in high enclave neighborhoods. Hispanics living in low SES and high enclave had 12.7 times (95% CI; 11.2–14.3) higher rate of Cca than those living in high SES, low enclave neighborhoods. For Asian women incidence rates were 6 times (95% CI; 4.9–7.5) higher in low SES, high enclave neighborhoods compared to those living in high SES, low enclave neighborhoods. These findings highlight the need for improved screening approaches for these high risk populations and also identify key populations to target for HPV vaccination.
In California from 1990 to 2004, there was a reduction of the SCC incidence over time for non-Hispanic Whites, Hispanics, and Asians. However, for most groups, the incidence of adenocarcinoma did not decrease significantly over time. This result is consistent with other studies which have shown the rate of adenocarcinoma increasing or remaining stable [1,3]. Pap smear seems to be quite effective to detect pre-invasive lesion for SCC but less helpful for pre-invasive adenocarcinoma lesion, perhaps explaining the stable rates of adenocarcinoma [32,33].
The three groups in our study with the highest rates of Cca were FB-Vietnamese, FB-Hispanic, and FB-Korean women. This result about the incidence of Cca among ethnic subgroups is similar with another study [10]. Indeed, in that study, the incidence rate per 100,000 woman-years for invasive cervical carcinoma was 18.9, 16.6 and 11.9 for Vietnamese, Hispanic and Korean women respectively. Moreover, in support of the prior research [34] and consistent with a recent report on national cancer incidence trends [11], our study showed that FB-Vietnamese women had the highest incidence of Cca and highest rate of decline of SCC incidence between 1992 and 2002. However, those studies didn’t assess the incidence patterns by nativity and neighborhood characteristics for Hispanics and Asian subgroups.
By ethnic group, FB women showed higher rates of SCC compared to US-born women. Another report also shows a similar influence of FB status on Cca incidence among Hispanics with less impact in other ethnic groups like Asian/Pacific Islander and African American [3]. These incidence patterns are likely largely reflective of screening patterns. Several studies have demonstrated that FB-Asian and Hispanic women are considerably less likely to be screened for cervical cancer [35–37]. Recent immigrants were 3 times more likely to never have undergone a Pap smear compared to US-born women [37]. Lack of knowledge of the US health care system, screening programs, and language barriers were all reported to limit the access to screening for FB women [36]. Additionally, 34% of the immigrant population is uninsured compared to 12% of the US-born population [38], which likely also contributes to a low screening rate in FB women.
Higher Cca incidence rates were noted in low SES neighborhoods. Other reports also show a similar association of low SES and high Cca incidence [3,4]. A SEER review demonstrates that women living in high poverty counties have a higher incidence rate than women living in low poverty counties [4]. The lack of access to health insurance and health care in these low SES groups likely contributes to low rates of screening and eventually an increase in Cca incidence [37].
Higher Cca incidence was found in high enclave or ethnically distinct neighborhoods. As noted previously, foreign-birth and recent immigration, lack of acculturation and language barriers, which are associated with residence in these enclaves, contribute to lack of screening which can increase the rate of Cca [36–38]. Enclave was also associated with an increase of Cca cases in the Haitian community in Florida [39]. To our knowledge, this study is the first to determine the impact of the enclave on Cca incidence for the Asian and Hispanic community in California. Neighborhood SES and ethnic enclave are highly correlated and, considered together, women in neighborhoods of high enclave and low SES had considerably higher incidence rates of Cca, suggesting a synergistic effect. It is concerning to see that this population of FB women have lower rates of HPV vaccine since its introduction in 2006 [40] and likely places them at higher risk of Cca, as demonstrated by the current study. Findings of our study highlight the fact that more efforts should be targeted towards HPV vaccination in these populations.
There are some limitations of this study. Data regarding the HPV status and other Cca risk factors were not available. Information about length of residency in the US, screening behavior and health insurance access were also not available. Furthermore, in some ethnic subgroups, populations were too small to generate stable estimates. We also used, as in other studies, an area-based measure on SES because individual SES was not available in the California Cancer Registry. The database containing nativity data was separate from the one containing neighborhood SES and ethnic enclave status, and these variables could not be cross-classified. Finally, for 20.6% of Asians and 22.4% of Hispanics, data regarding nativity were missing. A method on the basis of the patients’ social security numbers (SSN) was used with some limitation. Also, the current study included women from California only and might not be representative of populations living in different areas.
Conclusion
The incidence of invasive cervical cancer declined in NHW, Hispanics and Asian women in California from 1990 through 2004, and disparities in incidence have narrowed considerably over time. However, despite significant declines, rates remain high among foreign-born Hispanics and Asians, especially for adenocarcinoma. The fact that women living in low SES and high enclave neighborhoods have considerably higher incidence is worthy of further exploration and can be used to inform targeted cervical cancer screening and prevention efforts.
Supplementary Material
HIGHLIGHTS.
Cervical cancer cases from four of the SEER program registries were reviewed.
Influence of enclave and nativity on cervical cancer incidence is reported.
More efforts should be done to increase Pap smear screening in those groups.
Acknowledgments
Conflict of interest statement
This research was supported by Laval University McLaughlin Dean’s Grant and by the CMDP du CHUQ–CHUQ Foundation’s Grant. The collection of cancer incidence data used in this study was supported by the California Department of Health Services as part of the statewide cancer reporting program mandated by California Health and Safety Code Section 103885; the National Cancer Institute’s Surveillance, Epidemiology, and End Results Program under contract HHSN261201000140C awarded to the Cancer Prevention Institute of California, contract HHSN261201000035C awarded to the University of Southern California, and contract HHSN261201000034C awarded to the Public Health Institute; and the Centers for Disease Control and Prevention’s National Program of Cancer Registries, under agreement #1U58 DP000807-01 awarded to the Public Health Institute. The ideas and opinions expressed herein are those of the authors, and endorsement by the State of California, the California Department of Health Services, the National Cancer Institute, or the Centers for Disease Control and Prevention or their contractors and subcontractors is not intended nor should be inferred.
Footnotes
Supplementary data to this article can be found online at http://dx.doi.org/10.1016/j.ygyno.2014.03.559.
Presented at the 2013 ASCO annual meeting in Chicago, General Poster Session June 3rd, 2013.
References
- 1.Smith HO, Tiffany MF, Qualls CR, et al. The rising incidence of adenocarcinoma relative to squamous cell carcinoma of the uterine cervix in the United States—a 24-year population-based study. Gynecol Oncol (New York NY) 2000;78:97–105. doi: 10.1006/gyno.2000.5826. [DOI] [PubMed] [Google Scholar]
- 2.Siegel R, Ma J, Jemal A. Cancer statistics, 2014. CA Cancer J Clin (Phila) 2014 Jan;64(1):9–29. doi: 10.3322/caac.21208. [Epub] [DOI] [PubMed] [Google Scholar]
- 3.McDougall JA, Madeleine MM, Daling JR, et al. Racial and ethnic disparities in cervical cancer incidence rates in the United States, 1992–2003. Cancer Causes Control (Oxford) 2007;18(10):1175–86. doi: 10.1007/s10552-007-9056-y. [DOI] [PubMed] [Google Scholar]
- 4.Singh GK, Miller BA, Hankey BF, et al. Area socioeconomic variations in US cancer incidence, mortality, stage, treatment, and survival, 1975-1999. Bethesda MD: National Cancer Institute; 2003. (NCI Cancer Surveillance Monograph Series, Number 4). [Google Scholar]
- 5.Patel NR, Rollison DE, Barnholtz-Sloan J, et al. Racial and ethnic disparities in the incidence of invasive cervical cancer in Florida. Cancer (New York NY) 2009;115(17):3991–4000. doi: 10.1002/cncr.24427. [DOI] [PubMed] [Google Scholar]
- 6.Watson M, Saraiya M, Benard V, et al. Burden of cervical cancer in the United States, 1998–2003. Cancer (New York NY) 2008;113(10 Suppl):2855–64. doi: 10.1002/cncr.23756. [DOI] [PubMed] [Google Scholar]
- 7.Barnholtz-Sloan J, Patel N, Rollison D, et al. Cancer causes control (Oxford) 2009;20(7):1129–38. doi: 10.1007/s10552-009-9317-z. [DOI] [PubMed] [Google Scholar]
- 8.Center for Disease Control, Prevention. http://www.cdc.gov/cancer/cervical/statistics/. Accessed May 2013.
- 9.Saraiya M, Ahmed F, Krishnan S, et al. Cervical cancer incidence in a prevaccine era in the United States, 1998–2002. Obstet Gynecol (New York NY) 2007;109(2):360–70. doi: 10.1097/01.AOG.0000254165.92653.e8. [DOI] [PubMed] [Google Scholar]
- 10.Wang SS, Carreon JD, Gomez SL, et al. Cervical cancer incidence among 6 Asian ethnic groups in the United States, 1996 through 2004. Cancer (New York NY) 2010;116(4):949–56. doi: 10.1002/cncr.24843. [DOI] [PMC free article] [PubMed] [Google Scholar]
- 11.Gomez SL, Noone AM, Lichtensztajn D, et al. Cancer incidence trends among Asian American populations in the United States, 1990–2008. JNCI J Natl Cancer Inst (Oxford) 2013;105(15):1096–110. doi: 10.1093/jnci/djt157. [DOI] [PMC free article] [PubMed] [Google Scholar]
- 12.United States Census Bureau. State & county quickfacts. http://quickfacts.census.gov/qfd/states/06000.html. [Accessed May 2013]
- 13.National Cancer Institute. SEER*Stat software. www.seer.cancer.gov/seerstat.
- 14.Asian/Pacific Islander Work Group. NAACCR Asian Pacific Islander Identification Algorithm [NAPIIA version 1.2] Springfield, IL: North American Association of Central Cancer; 2008. [Google Scholar]
- 15.NAACCR Latino Research Work Group, editor. NAACCR Guideline for Enhancing Hispanic-Latino Identification: Revised NAACCR Hispanic/Latino Identification Algorithm [NHIA v2] Springfield, IL: North American Association of Central Cancer Registries; Sep 21, 2005. [Available at http://www.naaccr.org/filesystem/pdf/NHIA%20v2%2009-21-05.pdf] [Google Scholar]
- 16.Gomez SL, Glaser SL. Quality of birthplace information obtained from death certificates for Hispanics, Asians, and Pacific Islanders. Ethn Dis (McDonough GA) 2004;14(2):292–5. [PubMed] [Google Scholar]
- 17.Gomez SL, Glaser SL. Quality of cancer registry birthplace data for Hispanics living in the United States. Cancer Causes Control (Oxford) 2005;16(6):713–23. doi: 10.1007/s10552-005-0694-7. [DOI] [PubMed] [Google Scholar]
- 18.Gomez SL, Glaser SL, Kelsey JL, et al. Bias in completeness of birthplace data for Asian groups in a population-based cancer registry (United States) Cancer Causes Control (Oxford) 2004;15(3):243–53. doi: 10.1023/B:CACO.0000024244.91775.64. [DOI] [PubMed] [Google Scholar]
- 19.Lin SS, Clarke CA, O’Malley CD, et al. Studying cancer incidence and outcomes in immigrants: methodological concerns. Am J Public Health (Washington DC) 2002;92(11):1757–9. doi: 10.2105/ajph.92.11.1757-a. [DOI] [PMC free article] [PubMed] [Google Scholar]
- 20.Gomez SL, Quach T, Horn-Ross PL, et al. Hidden breast cancer disparities in Asian women: disaggregating incidence rates by ethnicity and migrant status. Am J Public Health (Washington DC) 2010;100(Suppl 1):S125–31. doi: 10.2105/AJPH.2009.163931. [DOI] [PMC free article] [PubMed] [Google Scholar]
- 21.Pew Hispanic Center. Demographic profile of Hispanics in California, 2009. 2011 Available at http://pewhispanic.org/states/?stateid=CA; [Last accessed: 10/7/2011]
- 22.Hispanic Center Pew. Survey brief: Latinos in California, Texas, New York, Florida and New Jersey. Washington, D.C.: Pew Hispanic Center; Mar, 2004. Available at: http://pewhispanic.org/files/factsheets/10.pdf. [Google Scholar]
- 23.Yost K, Perkins C, Cohen R, et al. Socioeconomic status and breast cancer incidence in California for different race/ethnic groups. Cancer Causes Control (Oxford) 2001;12(8):703–11. doi: 10.1023/a:1011240019516. [DOI] [PubMed] [Google Scholar]
- 24.Gomez SL, Clarke CA, Shema SJ, et al. Disparities in breast cancer survival among Asian women by ethnicity and immigrant status: a population-based study. Am J Public Health (Washington DC) 2010;100(5):861–9. doi: 10.2105/AJPH.2009.176651. [DOI] [PMC free article] [PubMed] [Google Scholar]
- 25.Keegan TH, John EM, Fish KM, et al. Breast cancer incidence patterns among California Hispanic women: differences by nativity and residence in an enclave. Cancer Epidemiol Biomarkers Prev (Baltimore) 2010;19(5):1208–18. doi: 10.1158/1055-9965.EPI-10-0021. [DOI] [PMC free article] [PubMed] [Google Scholar]
- 26.Chang ET, Yang J, Alfaro-Velcamp T, et al. Disparities in liver cancer incidence by nativity, acculturation, and socioeconomic status in California Hispanics and Asians. Cancer Epidemiol Biomarkers Prev (Baltimore) 2010;19(12):3106–18. doi: 10.1158/1055-9965.EPI-10-0863. [DOI] [PMC free article] [PubMed] [Google Scholar]
- 27.Hu FB. Dietary pattern analysis: a new direction in nutritional epidemiology. Curr Opin Lipidol (Phila) 2002;13(1):3–9. doi: 10.1097/00041433-200202000-00002. [DOI] [PubMed] [Google Scholar]
- 28.Shyrock HSSJ, Larmon EA. The methods and materials of demography. Washington, DC: US Census Bureau; 1973. [Google Scholar]
- 29.Keegan TH, Gomez SL, Clarke CA, et al. Recent trends in breast cancer incidence among 6 Asian groups in the Greater Bay Area of Northern California. Int J Cancer (New York NY) 2007;120(6):1324–9. doi: 10.1002/ijc.22432. [DOI] [PubMed] [Google Scholar]
- 30.Bates DCJ, Dalgaard P, Falcon S, et al. R program [R] 2.8.0 ed Vienna. Austria: The R Foundation for Statistical Computing; 2008. [Google Scholar]
- 31.Statistical research and applications branch NCI: Joinpoint regression program, version 3.5.4. 2012 Aug; [Google Scholar]
- 32.Zappa M, Visioli CB, Ciatto S, et al. Lower protection of cytological screening for adenocarcinoma and shorter protection for younger women: the results of a case–control study in Florence. BMJ (London) 2004;90:1784–6. doi: 10.1038/sj.bjc.6601754. [DOI] [PMC free article] [PubMed] [Google Scholar]
- 33.Barroilhet L, Van Hanegem L, Bernstein M, et al. Potential effect of updated Pap test screening guidelines and adenocarcinoma in situ of the cervix. Obstet Gynecol (New York NY) 2013;121(4):759–64. doi: 10.1097/AOG.0b013e3182887cad. [DOI] [PubMed] [Google Scholar]
- 34.Kagawa-Singer M, Pourat N, Breen N, et al. Breast and cervical cancer screening rates of subgroups of Asian American women in California. Med Care Res Rev (Richmond VA) 2007;64(6):706–30. doi: 10.1177/1077558707304638. [DOI] [PubMed] [Google Scholar]
- 35.Ramirez AG, Suarez L, Laufman L, et al. Hispanic women’s breast and cervical cancer knowledge, attitudes, and screening behaviors. Am J Health Promot (Danvers MA) 2000;14(5):292–300. doi: 10.4278/0890-1171-14.5.292. [DOI] [PubMed] [Google Scholar]
- 36.Islam N, Kwon SC, Senie R, et al. Breast and cervical cancer screening among South Asian women in New York City. J Immigr Minor Health (New York NY) 2006;8:211–21. doi: 10.1007/s10903-006-9325-y. [DOI] [PubMed] [Google Scholar]
- 37.Carraquillo O, Pati S. The role of health insurance on Pap smear and mammography utilization by immigrants living in the United States. Prev Med (New York NY) 2004;39(5):943–50. doi: 10.1016/j.ypmed.2004.03.033. [DOI] [PubMed] [Google Scholar]
- 38.Migration Information Source. http://www.migrationinformation.org. [Accessed August 2013]
- 39.Kobetz E, Kish JK, Campos NG, et al. Burden of human papillomavirus among immigrants in Miami, Florida: community-based participatory research in action. J Oncol (New York NY) 2012 Mar 15;:1–10. doi: 10.1155/2012/728397. [Epub] [DOI] [PMC free article] [PubMed] [Google Scholar]
- 40.Tiro JA, Tsui J, Bauer HM, et al. Human papillomavirus vaccine use among adolescent girls and young adult women: an analysis of the 2007 California Health Interview Survey. J Womens Health (New York NY) 2012;21(6):656–65. doi: 10.1089/jwh.2011.3284. [DOI] [PMC free article] [PubMed] [Google Scholar]
Associated Data
This section collects any data citations, data availability statements, or supplementary materials included in this article.