

Abstract
Background
It is unclear how inequalities in survival among children with acute lymphoblastic leukemia (ALL) have changed over time in different race/ethnicity groups.
Methods
Children diagnosed with a first primary malignant ALL at ages 0 to 19 years in 1975–2010 in the nine Surveillance, Epidemiology, and End Results cancer registries were included. Cumulative ALL mortalities were compared, and multivariable Cox regression analyses were applied to estimate ALL mortality HRs associated with race/ethnicity, age at diagnosis, and sex, adjusting for each other, within each diagnosis period (1975–1983, 1984–1991, 1992–1999, and 2000–2010).
Results
Compared with non-Hispanic-whites (NH-whites), the HR in non-Hispanic-blacks (NH-blacks) dropped to 1.21 [95% confidence interval (CI), 0.74–1.96] in 2000–2010 from the largest inequality in 1984–1991 (HR, 2.09; 95% CI, 1.57–2.79); the HR in Hispanics increased, however, from 1.28 (95% CI, 0.98–1.66) in 1975–1983 to 1.95 (95% CI, 1.48–2.58) in 2000–2010. Asian/Pacific Islanders (API) and American Indian/Alaska Natives (AIAN) had HRs of 1.39 (95% CI, 0.92–2.11) and 2.31 (95% CI, 1.13–4.74), respectively, in 2000–2010 with non-statistically significant increases over time. In 2000–2010, compared with NH-white counterparts, NH-blacks and APIs diagnosed at 1–9 years, Hispanics diagnosed at 1–9 and 10–19 years, and AIANs diagnosed at 10–19 years all had about twice the ALL mortality hazard rates; inequality was observed among API boys (HR, 1.61; 95% CI, 1.00–2.60) but not API girls.
Conclusions
Survival inequalities changed differently across subgroups of children with ALL.
Impact
Underlying causes of the differential trends need to be examined, such that targeted interventions can be developed to reduce inequalities.
Introduction
Acute lymphoblastic leukemia (ALL) is the most common childhood cancer in the United States (1), and one of the most curable cancers. Treatment advances, such as the introduction of combination chemotherapy and effective treatment for subclinical central nervous system (CNS) leukemia in the 1960s, and the development of risk-based therapy placed on well-designed clinical trials in the 1980s (2), have contributed to dramatic improvements in survival among children with ALL. The overall 5-year survival probability improved from less than 10% in the early 1960s (1) to over 80% in the late 1990s (3). Despite milestones in survival improvements, previous studies identified continuing inequalities in childhood ALL survival, with adverse prognosis reported in blacks, Hispanics, American Indian/Alaska Natives (AIAN), children ages <1 and 10–19 years at diagnosis, and boys (4–7).
In the 1990s and 2000s, ALL survival further improved following several medical advances: better precision in treatment with applications of molecular biologic tools (2); a uniform system of risk classification (8); and the merging in 2000 of the Children’s Cancer Study Group and the Pediatric Oncology Group (POG) into the Children’s Oncology Group (COG), providing advanced care for over 90% of U.S. childhood cancer patients (9) and two thirds of childhood ALL patients (10). Consequently, in 2000–2004, children diagnosed with ALL at 0–14 years in the United States are reported to have an overall 5-year survival probability of 87.5% as compared with 80.2% in 1990–1994 (11).
With continued treatment and survival improvement, several studies have reported decreased inequality in survival among blacks and whites. For patients enrolled in COG trials, the hazard ratio of all-cause mortality in blacks relative to whites ages 0 to 21 years was reported to drop from 1.73 in 1990–1994 to 1.37 in 2000–2005 (10). A population-based study also reported narrowed gap in survival between blacks and whites: 5-year survival rates for blacks and whites, respectively, increased from 56.6% and 76.3% in 1981–1990 to 86.1% and 88.9% in 2001–2010 (12). However, research is limited regarding how the inequalities in survival among children of other race/ethnicity groups [Hispanics, Asian/Pacific Islanders (API), and AIANs] as compared with whites have changed over time, and whether racial/ethnic inequalities in survival vary by age at diagnosis and sex.
The current study sought to determine how inequalities in survival after childhood ALL by race/ethnicity have changed over the period 1975–2010 and describe the inequality in survival among U.S. children with ALL by race/ethnicity, age at diagnosis and sex in the period 2000–2010.
Materials and Methods
Study population
Data were obtained from the original nine population-based cancer registries in the National Cancer Institute (NCI) Surveillance, Epidemiology, and End Results program (SEER 9). The SEER 9 registries collected information from nine selected states or metropolitan areas (Atlanta, Connecticut, Detroit, Hawaii, Iowa, New Mexico, San Francisco–Oakland, Seattle–Puget Sound, and Utah) in the United States since 1973, covering approximately 10% of the U.S. population (13). The SEER 9 registries were selected for this analysis over SEER 13 or 18 registries in order to compare historical trends of the same population starting from the 1970s. Cases diagnosed in 1973 and 1974 were not included because the Seattle-Puget Sound and Atlanta registries joined the SEER program in 1974 and 1975, respectively. Children diagnosed at ages 0 to 19 years with a first primary malignant ALL during 1975–2010 in SEER 9 registries were included. ALL cases were ascertained according to the International Classification of Diseases for Oncology, 3rd ed. (14). Six cases identified through autopsy/death certificate, and 47 cases with missing race/ethnicity information were also excluded.
Race and Hispanic ethnicity data in SEER registries are generally derived from information abstracted from patients’ medical records and is mainly based on self- or caregiver-report, but may be based on medical staff observation (15). Hispanic identification was additionally enhanced using the North American Association for Central Cancer Registries Hispanic–Latino identification algorithm (16), which is based on surnames and birthplace. Mutually exclusive racial/ethnic categories were defined as: Hispanics, non-Hispanic-whites (NH-whites), non-Hispanic-blacks (NH-blacks), APIs, and AIANs. Four diagnosis periods (1975– 1983, 1984–1991, 1992–1999, and 2000–2010) were selected to capture relevant secular trends in treatment improvements and to allow sufficient follow-up for reliable estimates. Age at diagnosis was categorized as <1, 1–9, and 10–19 years, based on NCIs risk classification for ALL (8).
Follow-up for vital status is conducted by the SEER cancer registries using linkages to national and state vital statistics records. Follow-up in this study was through the end of 2011, with a median follow-up of 8.9 years. Death due to ALL (ALL mortality) was the primary outcome of interest, which was ascertained based on the SEER cause–specific death classification (17). Cases who were alive during the follow-up were censored at the last active follow-up. Those who died of causes not attributable to ALL had their at-risk status terminated on the date of death. Death due to all causes was analyzed as the secondary outcome (Supplementary Table S1 and S2).
Statistical analyses
Characteristics of cases were tabulated and compared among the five race/ethnicity groups, using χ2 tests. Cumulative ALL mortalities among cases and their 95% confidence intervals (CI) were estimated using the cumulative incidence function (18). Multivariable Cox regression was applied to estimate ALL mortality HRs and their 95% CIs associated with race/ethnicity, sex, and age at diagnosis, adjusting for each other, stratified by diagnosis period. The age-specific HRs adjusting for sex, and sex-specific HRs adjusting for age, associated with race/ethnicity, stratified by diagnosis period were also analysed using multivariable Cox regression. Tests of a linear trend in the change of inequalities with respect to a variable (e.g., race/ethnicity) over time were performed by treating the four-category diagnosis period variable as continous in the interaction term of the diagnosis period and the variable in the Cox regression models. Proportional hazard assumptions were checked using scaled Schoenfeld residuals (19) by “estat phtest” command in Stata and confirmed. Kaplan–Meier methods were used to estimate the overall survival. Two-sided P values were reported and those less than 0.05 were considered as statistically significant. Stata, version 12.0, was used for all analyses, except for the cumulative incidence calculation, which was done in SAS, version 9.4. Cumulative incidence curves were plotted using R, version 2.13.1.
Results
A total of 7,365 children were included and their characteristics by race/ethnicity are shown in Table 1. The study population comprised of 67.9% of NH-whites, 14.9% Hispanics, 8.5% APIs, 7.2% NH-blacks and 1.5% AIANs, with a noticeable increase in the relative proportion of Hispanic cases, from 8.8% of all childhood ALL cases in 1975–1983 to 21.6% in 2000–2010; the proportions of other race/ethnicity groups had less change. Sex was distributed similarly across race/ethnicity groups (P = 0.639), with more boys with ALL. The age distribution varied by race/ethnicity (P = 0.002): about 70% of NH-whites and Hispanics, 64.9% of NH-blacks, 76.7% of APIs, and 73.9% of AIANs were diagnosed at 1 to 9 years.
Table 1.
Characteristics of children diagnosed with ALL by race/ethnicity, SEER 9 registries, 1975–2010
| All children | NH-white | NH-black | Hispanic | API | AIAN | P | |
|---|---|---|---|---|---|---|---|
|
| |||||||
| N (%) | |||||||
| All cases | 7,365 (100.0) | 5,000 (67.9) | 532 (7.2) | 1,096 (14.9) | 626 (8.5) | 111 (1.5) | |
| Sex | 0.639 | ||||||
| Girls | 3,183 (43.2) | 2,179 (43.6) | 237 (44.5) | 460 (42.0) | 264 (42.2) | 43 (38.7) | |
| Boys | 4,182 (56.8) | 2,821 (56.4) | 295 (55.5) | 636 (58.0) | 362 (57.8) | 68 (61.3) | |
| Age at diagnosis, y | 0.002 | ||||||
| <1 | 240 (3.3) | 154 (3.1) | 23 (4.3) | 43 (3.9) | 19 (3.0) | 1 (0.9) | |
| 01–09 | 5,231 (71.0) | 3,558 (71.2) | 345 (64.9) | 766 (69.9) | 480 (76.7) | 82 (73.9) | |
| 10–19 | 1,894 (25.7) | 1,288 (25.7) | 164 (30.8) | 287 (26.2) | 127 (20.3) | 28 (25.2) | |
| Diagnosis period | <0.001 | ||||||
| 1975–1983 | 1,468 (19.9) | 1,140 (22.8) | 93 (17.5) | 129 (11.8) | 90 (14.4) | 16 (14.4) | |
| 1984–1991 | 1,591 (21.6) | 1,133 (22.7) | 115 (21.6) | 174 (15.9) | 137 (21.9) | 32 (28.8) | |
| 1992–1999 | 1,691 (23.0) | 1,155 (23.1) | 138 (25.9) | 228 (20.8) | 147 (23.5) | 23 (20.7) | |
| 2000–2010 | 2,615 (35.5) | 1,572 (31.4) | 186 (35.0) | 565 (51.6) | 252 (40.3) | 40 (36.0) | |
Among all children with ALL, the 5-year cumulative ALL mortality decreased from 35% in 1975–1983 to 10% in 2000– 2010. Table 2 shows the 5-year cumulative ALL mortalities by race/ethnicity, age at diagnosis, and sex within each diagnosis period. Figure 1 compares cumulative ALL mortality curves across race/ethnicity groups in each diagnosis period, which illustrates the change in inequalities of ALL mortality among different race/ethnicity groups over the four diagnosis periods.
Table 2.
Cumulative ALL mortality among 7,365 children diagnosed with ALL by diagnosis period, SEER 9 registries, 1975–2010
| 1975–1983 | 1984–1991 | 1992–1999 | 2000–2010 | |
|---|---|---|---|---|
| 5-Year cumulative ALL mortality (95% CI) | ||||
| All children | 0.35 (0.32–0.37) | 0.23 (0.21–0.26) | 0.16 (0.14–0.17) | 0.10 (0.09–0.11) |
| Race/ethnicity | ||||
| NH-white | 0.33 (0.30–0.36) | 0.20 (0.18–0.23) | 0.13 (0.11–0.15) | 0.08 (0.07–0.10) |
| NH-black | 0.48 (0.38–0.58) | 0.43 (0.33–0.51) | 0.22 (0.15–0.29) | 0.11 (0.06–0.16) |
| Hispanic | 0.43 (0.34–0.51) | 0.30 (0.23–0.37) | 0.22 (0.17–0.28) | 0.15 (0.12–0.19) |
| API | 0.31 (0.22–0.41) | 0.20 (0.14–0.27) | 0.15 (0.10–0.21) | 0.10 (0.07–0.15) |
| AIAN | 0.38 (0.15–0.61) | 0.41 (0.23–0.57) | 0.26 (0.10–0.45) | 0.19 (0.08–0.32) |
| Sex | ||||
| Girls | 0.30 (0.26–0.33) | 0.21 (0.18–0.24) | 0.13 (0.10–0.15) | 0.09 (0.07–0.11) |
| Boys | 0.39 (0.35–0.42) | 0.26 (0.23–0.29) | 0.18 (0.15–0.20) | 0.11 (0.10–0.13) |
| Age at diagnosis, y | ||||
| <1 | 0.68 (0.53–0.79) | 0.63 (0.50–0.74) | 0.37 (0.23–0.52) | 0.31 (0.21–0.41) |
| 1–9 | 0.26 (0.24–0.29) | 0.15 (0.13–0.18) | 0.10 (0.09–0.12) | 0.05 (0.04–0.07) |
| 10–19 | 0.51 (0.47–0.56) | 0.42 (0.37–0.47) | 0.29 (0.25–0.33) | 0.20 (0.17–0.23) |
Figure 1.
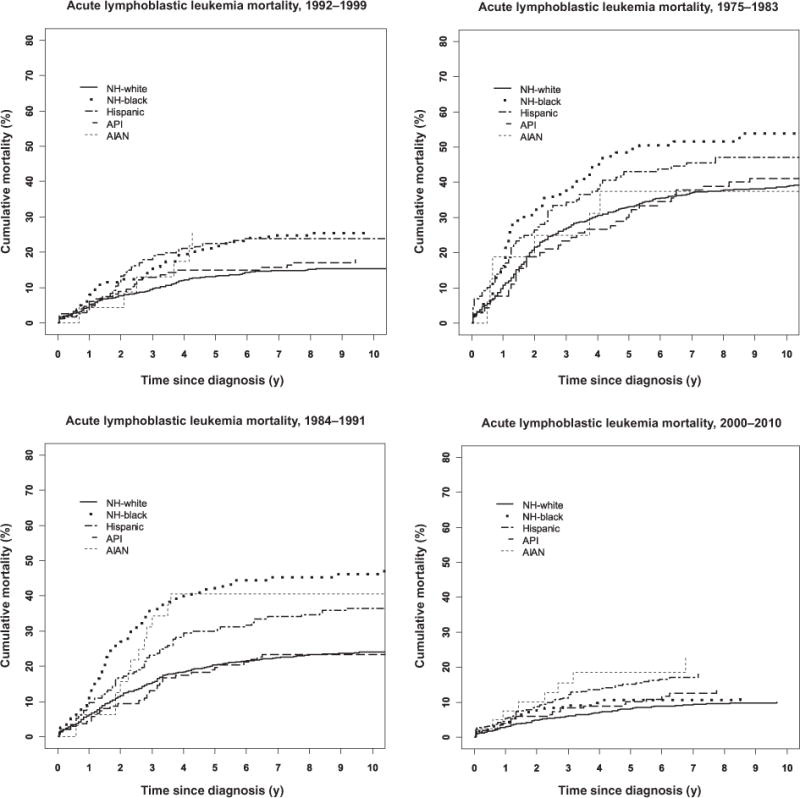
Cumulative mortality due to ALL, by diagnosis period and race/ethnicity, SEER 9 registries, 1975–2010.
Cumulative ALL mortalities reduced over time for children of any race/ethnicity, age at diagnosis, and sex; however, improvement patterns and magnitudes varied, leading to changes in inequalities. As compared with NH-whites, NH-blacks historically had worse survival. The absolute inequality in 5-year cumulative ALL mortality increased from 15% (48% in NH-blacks vs. 33% in NH-whites) in 1975–1983 to 23% (43% vs. 20%) in 1984–1991, but decreased later to 3% (11% vs. 8%) in 2000–2010. For Hispanics, the absolute inequality in 5-year cumulative incidence of ALL mortality changed from 10% (43% in Hispanic vs. 33% in NH-white) in 1975–1983 to 7% (15% vs. 8%) in 2000–2010. Historically, APIs with ALL fared as well as NH-whites, but AIANs fared worse: with a 5-year cumulative ALL mortality of 8% (95% CI, 7–10) in NH-whites, 10% (95 CI, 7–15) in APIs, and 19% (95 CI, 8–32) in AIANs in 2000–2010. Inequalities in overall 5-year survival probabilities showed the same pattern as cumulative ALL mortalities (Supplementary Table S1). The overall 5-year survival probability increased from 61% in 1975–1983 to 88% in 2000–2010 among all children with ALL.
Girls had better survival than boys historically. The 5-year cumulative mortality decreased from 30% (95% CI, 26–33) in 1975–1983 to 9% (95% CI, 7–11) in 2000–2010 in girls, and from 39% (95% CI, 35–42) to 11% (95% CI, 10–13) in boys. Children diagnosed with ALL at 1 to 9 years had better survival than at <1 and 10–19 years, such inequality persisted in magnitude in 2000–2010, with a 5-year cumulative ALL mortality of 5% (95% CI, 4–7), 20% (95% CI, 17–23), and 31% (95% CI, 21–41) in children ages 1–9, 10–19, and <1 year, respectively.
Table 3 shows the adjusted ALL mortality HRs for race/ethnicity, sex, and age at diagnosis by diagnosis period. Compared with NH-whites, after adjusting for age at diagnosis and sex, the HR in NH-blacks increased from 1.46 (95% CI, 1.09–1.94) in 1975– 1983 to 2.09 (95% CI, 1.57–2.79) in 1984–1991, and then dropped to 1.21 (95% CI, 0.74–1.96) in 2000–2010; the HR in Hispanics steadily increased (P = 0.023) from 1.28 (95% CI, 0.98–1.66) in 1975–1983 to 1.95 (95% CI, 1.48–2.58) in 2000– 2010; the HR in APIs changed (P = 0.275) from 1.05 (95% CI, 0.76–1.46) in 1975–1983 to 1.37 (95% CI, 0.91–2.08) in 2000– 2010; the HR for AIANs was 1.26 (95% CI, 0.60–2.65) in 1975– 1983 and increased to 2.19 (95% CI, 1.28–3.75) in 1984–1991, with a remaining high HR of 2.28 (95% CI, 1.11–4.67) in 2000– 2010. Similar results were observed when all-cause mortality was analyzed as the outcome (Supplementary Table S2).
Table 3.
HRs of ALL mortality among racial/ethnic groups (compared with NH-whites), by diagnosis period, SEER 9 registries, 1975–2010
| 1975–1983 | 1984–1991 | 1992–1999 | 2000–2010 | Trend Pb | |
|---|---|---|---|---|---|
| Adjusted HR (95% CI)a | |||||
| Race/ethnicity | |||||
| NH-white | 1.00 | 1.00 | 1.00 | 1.00 | |
| NH-black | 1.46 (1.09–1.94) | 2.09 (1.57–2.79) | 1.62 (1.13–2.32) | 1.21 (0.74–1.96) | 0.655 |
| Hispanic | 1.28 (0.98–1.66) | 1.58 (1.21–2.07) | 1.66 (1.23–2.25) | 1.95 (1.48–2.58) | 0.023 |
| API | 1.05 (0.76–1.46) | 1.11 (0.77–1.59) | 1.22 (0.81–1.85) | 1.37 (0.91–2.08) | 0.275 |
| AIAN | 1.26 (0.60–2.65) | 2.19 (1.28–3.75) | 2.10 (0.93–4.75) | 2.28 (1.11–4.67) | 0.279 |
| Age at diagnosis, y | |||||
| <1 | 3.60 (2.57–5.05) | 6.01 (4.29–8.41) | 4.22 (2.52–7.09) | 7.57 (4.85–11.80) | 0.028 |
| 1–9 | 1.00 | 1.00 | 1.00 | 1.00 | |
| 10–19 | 2.04 (1.73–2.41) | 2.67 (2.20–3.24) | 2.68 (2.12–3.39) | 4.01 (3.09–5.19) | <0.001 |
| Sex | |||||
| Girls | 1.00 | 1.00 | 1.00 | 1.00 | |
| Boys | 1.35 (1.15–1.59) | 1.25 (1.04–1.52) | 1.40 (1.11–1.78) | 1.32 (1.02–1.70) | 0.999 |
HRs adjusted for all other factors shown in the table.
Tests of a linear trend in the change of inequalities with respect to a variable (e.g., race/ethnicity) over time were performed by treating the four-category diagnosis period variable as continous in the interaction term of the diagnosis period and the variable in the Cox regression models.
Age-specific and sex-specific HRs for race/ethnicity by diagnosis period are shown in Table 4
Table 4.
Trends in HRs for ALL mortality among racial/ethnic groups (compared with NH-whites) by age and sex, SEER 9 registries, 1975–2010
| 1975–1983 | 1984–1991 | 1992–1999 | 2000–2010 | Trend Pb | |
|---|---|---|---|---|---|
| Adjusted HR (95% CI)a | |||||
| Age <1 y | |||||
| NH-black | 0.50 (0.12–2.17) | 1.32 (0.46–3.77) | 1.97 (0.54–7.16) | 1.42 (0.39–5.11) | 0.308 |
| Hispanic | 1.80 (0.66–4.89) | 1.57 (0.69–3.58) | 0.50 (0.11–2.30) | 1.76 (0.69–4.49) | 0.745 |
| API | 0.51 (0.16–1.69) | – | 0.85 (0.11–6.65) | 0.69 (0.15–3.09) | 0.705 |
| AIAN | – | – | – | 37.68 (4.03–352.65) | – |
| Ages 1–9 y | |||||
| NH-black | 1.81 (1.21–2.69) | 2.63 (1.77–3.89) | 2.09 (1.27–3.42) | 1.90 (0.93–3.89) | 0.805 |
| Hispanic | 1.42 (1.00–2.01) | 1.62 (1.11–2.35) | 1.81 (1.20–2.73) | 2.12 (1.33–3.38) | 0.143 |
| API | 1.23 (0.83–1.85) | 1.19 (0.77–1.82) | 1.47 (0.89–2.44) | 2.02 (1.10–3.69) | 0.175 |
| AIAN | 1.01 (0.38–2.71) | 2.06 (1.01–4.19) | 1.87 (0.69–5.09) | 0.94 (0.13–6.84) | 0.696 |
| Ages 10–19 y | |||||
| NH-black | 1.47 (0.95–2.27) | 1.74 (1.09–2.77) | 1.19 (0.68–2.11) | 0.77 (0.36–1.68) | 0.151 |
| Hispanic | 1.02 (0.66–1.60) | 1.57 (1.02–2.42) | 1.74 (1.09–2.77) | 1.87 (1.28–2.71) | 0.043 |
| API | 0.93 (0.51–1.72) | 1.14 (0.58–2.24) | 0.95 (0.44–2.05) | 1.16 (0.61–2.18) | 0.683 |
| AIAN | 1.72 (0.55–5.39) | 2.42 (1.07–5.52) | 3.02 (0.74–12.33) | 2.42 (1.05–5.58) | 0.633 |
| Girls | |||||
| NH-black | 1.71 (1.09–2.69) | 2.23 (1.45–3.44) | 1.55 (0.87–2.76) | 1.32 (0.56–3.09) | 0.509 |
| Hispanic | 1.63 (1.12–2.38) | 1.69 (1.09–2.62) | 1.09 (0.61–1.93) | 3.01 (1.96–4.64) | 0.082 |
| API | 0.71 (0.39–1.32) | 1.17 (0.64–2.12) | 1.03 (0.50–2.15) | 0.93 (0.40–2.19) | 0.586 |
| AIAN | 1.42 (0.45–4.45) | 1.89 (0.70–5.14) | 3.12 (0.97–10.00) | 3.25 (0.79–13.44) | 0.256 |
| Boys | |||||
| NH-black | 1.42 (0.98–2.07) | 1.97 (1.34–2.91) | 1.67 (1.06–2.65) | 1.13 (0.63–2.04) | 0.771 |
| Hispanic | 1.04 (0.71–1.51) | 1.54 (1.10–2.15) | 2.01 (1.40–2.87) | 1.43 (0.99–2.08) | 0.101 |
| API | 1.27 (0.87–1.86) | 1.10 (0.70–1.72) | 1.36 (0.83–2.24) | 1.61 (1.00–2.60) | 0.356 |
| AIAN | 1.10 (0.41–2.94) | 2.31 (1.22–4.38) | 1.57 (050–4.93) | 1.94 (0.84–4.44) | 0.503 |
HRs adjusted for all other factors shown in the table.
Tests of a linear trend in the change of racial/ethnic inequalities over time were performed by treating the four-category diagnosis period variable as continous in the interaction term of the diagnosis period and race/ethnicity in the Cox regression models.
Similar racial/ethnic inequalities trends were observed in each age at diagnosis group, and among boys and girls. However, racial/ethnic inequalities varied by age at diagnosis and by sex. The racial/ethnic inequalities were the largest among age 1–9 years except for AIANs. In 2000–2010, NH-blacks and APIs diagnosed at 1 to 9 years had HRs of 1.9 (95% CI, 0.93–3.89) and 2.02 (95% CI, 1.10–3.69) relative to NH-white counterparts, respectively. API boys had an HR of 1.61 (95% CI, 1.00–2.60) relative to NH-white boys in 2000–2010, such inequality was not observed among girls. In contrast, in 2000–2010, the inequality was larger among Hispanic girls than boys as compared with their NH-white counterparts, with HRs of 3.01 (95% CI, 1.96–4.64) and 1.43 (95% CI, 0.99–2.08) in Hispanic girls and boys, respectively.
After adjusting for sex and race/ethnicity, children ages <1 and 10–19 years at diagnosis had HRs of 7.57 (95% CI, 4.85–11.80) and 4.01 (95% CI, 3.09–5.19) relative to those ages 1–9 years, respectively, in 2000–2010 which increased from HRs of 3.60 (95% CI, 2.57–5.05) and 2.04 (95% CI, 1.73–2.41), respectively, in 1975–1983. After adjusting for age at diagnosis and race/ethnicity, boys consistently had higher hazards of ALL mortality than girls over four diagnosis periods (adjusted HR, 1.32; 95% CI, 1.01–1.72, in 2000–2010).
Discussion
Treatment advance in curing most children with ALL has been considered as one of the greatest successes in the history of cancer research. Yet, not all subgroups benefit equally. This study documents the inequality trends over time by race/ethnicity, age at diagnosis and sex, based on ALL cases from SEER 9 registries over 3.5 decades. Cumulative ALL mortality, overall survival probability, and adjusted ALL mortality hazard ratios have been reported, as choices of outcome measures and scales of inequality can influence the measurements and interpretations of survival inequality trends. This study also highlights several racial/ethnic inequalities in survival among certain age and sex subgroups of children with ALL in the period 2000–2010.
Overall, we found that as compared with NH-whites, the relative inequalities in ALL mortality decreased in NH-blacks, but increased over time in other minority groups (Hispanics, APIs, and AIANs), significantly among Hispanics. In 2000–2010, NH-blacks diagnosed at 1 to 9 years, Hispanics diagnosed at 1–9 and 10–19 years, APIs diagnosed at 1 to 9 years, and AIANs diagnosed at 10 to 19 years had about twice the hazard rates of ALL mortality than their NH-white counterparts diagnosed at the same age group. Moreover, larger inequalities were observed among Hispanic girls than boys, and inequality was observed only among API boys but not girls, as compared with their NH-white counterparts.
Survival inequality between NH-blacks and NH-whites was the highest between 1984 and 1991 and then declined afterward. These differences for 1984–1991 are illustrated in Fig. 1 and are the result of substantial improvement in survival among NH-whites but limited improvement in NH-blacks from the preceding period. These observations may suggest that advances in therapy were more easily accessed by the NH-white children as compared with their NH-black counterparts. The decreasing inequality observed between NH-whites and NH-blacks is consistent with previous findings (10, 12). In 2000–2010, NH-blacks had 3% higher in absolute values of 5-year cumulative ALL mortality and an adjusted ALL mortality HR of 1.21 which did not differ statistically from NH-whites. Previously, Hunger and colleagues reported narrowed inequality between white and black patients enrolled in COG trials, and they reported all-cause mortality as opposed to ALL-specific mortality (10). Our population-based study allows us to better generalize our results to the U.S. population, especially considering that access to care and enrollment in clinical trials is usually an important driver of mortality differences. Another recent study reported a significantly narrowed gap in 5-year relative survival between whites and blacks diagnosed with ALL at 0 to 14 years (12). However, this study included ALL cases in SEER 18 registries so the secular trends might be impacted by the appreciable changes in the SEER population, starting with the 9 registries in 1975, which we studied in this report for consistency over time, to 18 registries in 2000.
Blacks are known to have a higher incidence of the T-cell subtype of ALL as compared with whites, which in general has a worse prognosis (7, 10); however, ALL immunophenotype information is limited in SEER data. The “grade” variable in SEER data shows immunophenotype information for leukemia. However, the use of this variable is cautioned, especially for cases diagnosed in 1973–2000 due to the change of reporting requirements and medical terminology over time. Moreover, for cases included in the current study, the immunophenotype information is missing for more than half of the cases. Treatment improvement, for example, the application of more intensive treatment protocols, and the approval of Nelarabine for patients with recurring T-cell ALL in 2000 (2), may have contributed to the closing gap between blacks and whites (10). For children treated at St. Jude Children’s Research Hospital, where patients were treated with contemporary multimodality therapy according to therapeutic protocols regardless of race, ethnicity, or ability or pay for their medical care, no difference was found in survival of blacks as compared with whites in treatment eras from 1984 through 2007 (20, 21). This supports the hypothesis that, with equal access to contemporary, risk-based treatment, there is likely no black–white inequality in ALL mortality. However, NH-blacks diagnosed at 1 to 9 years have still been observed to have an adjusted ALL mortality HR of 1.90 (95% CI, 0.93–3.89) in 2000– 2010 relative to the NH-white counterpart in the current study, which needs attention in future studies as to identify reasons and interventions.
There was a statistically significantly widening trend in the relative inequalities in ALL mortality hazards between Hispanics and NH-whites. This shows that, as a group, the relative improvement following ALL treatment advances has been slower in Hispanics than in NH-whites. An important factor in interpreting this result is the change in the U.S. Hispanic population in the study regions over the study time period. The proportion of Hispanic cases in our study population increased from 8.8% in 1975–1983 to 21.6% in 2000–2010, primarily due to immigration. In some, but not all, of the 9 SEER registries, we found statistically significant or marginally significant increasing trends in inequalities among Hispanics as compared with NH-whites (Supplementary Table S3). These registries were Atlanta, San Francisco, and Utah registries, among which the relative proportion of Hispanic population increased substantially over time to exceed 20% in 2000–2010 (Supplementary Table S4). No change in the relative inequality was observed in the other registries. The supplementary analysis, although limited in power, may indicate that recent Hispanic immigrants may be more vulnerable to the relative inequality and may not be benefitting as much from the advances of the ALL treatment. Previous reports have shown decreasing education level among Hispanics due to immigration (22), and nonadherence to the treatment among illegal immigrant Mexican and first-generation Mexican-American children (23), which may contribute to worse survival, though the association between socioeconomic status and the survival of ALL is not conclusive. The heterogeneity of Hispanics (e.g., Mexican, Puerto Rican, and Cuban) also complicates the interpretation of the inequality trend if the ethnic composition has changed over time. Regardless of possible explanations, the widening relative inequality is of concern and requires attention by healthcare providers and researchers. Moreover, the larger inequalities between NH-whites and Hispanics observed among girls (HR, 3.01) than boys (HR, 1.43) require future investigation and sex difference should be considered in identifying potential reasons of the inequalities.
APIs had similar survival as NH-whites historically, as consistent with previous studies (5). However, albeit nonsignificant, relative inequalities between APIs and NH-whites grew over time, especially among cases diagnosed at age 1–9 years. Moreover, the current study found APIs ages 1 to 9 years had over 2-fold ALL mortality hazard (95% CI, 1.10–3.69), and API boys had an HR of 1.61 (95% CI, 1.00–2.60), relative to their NH-white counterparts in 2000–2010. The worse survival among APIs as compared with NH-whites in specific age and sex subgroups has never been reported before. Variations among API subgroups in childhood ALL survival has been reported, with Vietnamese and Filipinos faring significantly worse than NH-whites (24). Unfortunately, as with Hispanics, the small number of ALL cases limited analyses of distinct API ethnic groups. We found that a large inequality between AIANs and NH-whites persisted over time. Results on AIANs should be interpreted with caution, as there were only 111 AIAN cases in the current study. However, this study is to our knowledge the largest and the first study that documents the trend of inequalities between AIANs and NH-whites in ALL survival over time.
Sex differences in ALL survival are partially explained by sex differences in the distributions of ALL immunophenotype and DNA index (6). Higher mortality among boys than girls persisted over the time period (HRs around 1.3). However, treatment advance has decreased absolute inequality in the cumulative ALL mortality between boys and girls.
Growing relative inequalities in mortality have been observed over time across age groups: infants and children diagnosed at 10 to 19 years, infants in particular, who have much more room to improve, have actually improved relatively slower than children ages 1 to 9 years. This highlights the success in the treatment of children ages 1 to 9 years and the difficulties in improving the survival of infants and 10- to 19-year-olds. Approximately 80% of infants with ALL have an MLL gene rearrangement which is associated with poor prognosis (25). Several treatment strategies such as the use of stem cell transplantation in first remission and treatment intensification have been explored in clinical trials but have not yet resulted in significant improvement in survival (25, 26). Children diagnosed at 10 to 19 years are less likely to enroll in pediatric trials than children diagnosed at 1 to 9 years (10). These may be, at least partly, associated with the fewer improvements have been made for treating infants and adolescents with ALL. Even though children diagnosed with ALL at ages 1 to 9 years have the best prognosis and experience the most treatment advances and survival improvement compared with children diagnosed at other age groups, the racial/ethnic inequalities between NH-whites and other minority groups (NH-blacks, Hispanics, and APIs) have been observed to be the largest among them.
Although our population-based analyses do not include data that allow us to examine specific underlying causes of these differences in survival by race/ethnicity, possible explanations include both biologic and sociocultural causes. Pollock and colleagues found that African Americans enrolled in POG clinical trials presented with worse disease presentations [e.g., higher white blood cell (WBC) counts, and common ALL antigen] than whites, which were associated with subsequent treatment failures (7). Genomic rearrangement of cytokine receptor-like factor 2 was found to be more common among Hispanics and is associated with poor outcome in pediatric B-progenitor ALL (27). A component of genomic variation that cosegregated with Native American ancestry was associated with risk of ALL relapse (28). However, adjusting for some biologic differences, inequalities between the racial/ethnic minorities and NH-whites were still observed (7). Access and adherence to the treatment are also likely explanations for the inequalities. Lund and colleagues reported that NH-blacks and Hispanics were less likely to enroll into clinical trials (29), and Bhatia and colleagues demonstrated that those who did participate were less likely to adhere to the treatment (30, 31).
Several limitations of this study are pertinent in interpreting its results. First, possibilities in the misclassification of race/ethnicity should be considered. SEER racial/ethnic classifications were reported to have an excellent agreement with self-reported racial classifications, except for the AIAN classification: the 5-year overall survival for AIAN cancer patients based on SEER race classifications was reported to be much lower than that for self-identified AIAN cancer patients (32). The increase in the proportion of multiracial and multiethnic children has been reported in the United States over time (33). Although cancer registries include up to five race fields for each patients since 2000, only the primary race information is available in the SEER dataset. Moreover, it is unclear whether the information captured in these fields is reflective of multirace status or different race coding reported by different facilities for a given patient. SEER race coding algorithms preferentially codes the minority (non-white) race in the primary race field. Nonetheless, given the increase in prevalence of multi-race/ethnicity children in the United States, it would be worth-while to examine survival patterns for the growing population of young multirace/ethnicity cancer patients in datasets in which this information is explicitly captured. Second, survival of more recently diagnosed cases in 2000–2010 was estimated with a relatively shorter follow-up time. Third, causes of death might have been misclassified in determining ALL mortality. The SEER cause-specific death classification is defined based on cause of deaths in conjunction with the tumor sequence, site of the original cancer diagnosis; and comorbidities, aiming to capture deaths that are related to the specific cancer but are not coded as such (17). To supplement this limitation, death due to all causes was analyzed as the secondary outcome, and similar results were found and presented in the supplementary materials. However, some other important endpoints, such as the event-free survival, cannot be estimated as treatment failure information (e.g., relapse or refractory disease) is not captured by the SEER data. Moreover, the lack of information regarding clinical presentation (e.g., WBC counts), tumor biology, and treatment of ALL cases in cancer registries limits the interpretation of the inequalities and their trends. Finally, the inequalities and their trends found on the SEER 9 registries may not be fully applicable to other SEER registries and to other geographic locations outside of the SEER program.
In conclusion, survival inequalities changed differently across subgroups of children with ALL. Underlying causes of the differential trends need to be examined, such that targeted interventions can be developed to reduce growing or persistent inequalities among Hispanics and AIANs, as well as among APIs boys, APIs and NH-blacks diagnosed at 1 to 9 years.
Supplementary Material
Footnotes
Note: Supplementary data for this article are available at Cancer Epidemiology, Biomarkers & Prevention Online (http://cebp.aacrjournals.org/).
Disclosure of Potential Conflicts of Interest
No potential conflicts of interest were disclosed.
Authors’ Contributions
Conception and design: L. Wang, S. Bhatia, Y. Yasui
Development of methodology: L. Wang, Y. Yasui
Acquisition of data (provided animals, acquired and managed patients, provided facilities, etc.): L. Wang
Analysis and interpretation of data (e.g., statistical analysis, biostatistics, computational analysis): L. Wang, Y. Yasui
Writing, review, and/or revision of the manuscript: L. Wang, S. Bhatia, S. L. Gomez, Y. Yasui
Administrative, technical, or material support (i.e., reporting or organizing data, constructing databases): L. Wang, S. Bhatia
Study supervision: Y. Yasui
References
- 1.Ries LAG, Smith MA, Gurney JG, Linet M, Tamra T, Young JL. In: Cancer Incidence and Survival among Children and Adolescents: United States SEER Program 1975–1995. Bunin GR, editor. Bethesda, MD: National Cancer Institute; 1999. [Google Scholar]
- 2.Seibel NL. Acute lymphoblastic leukemia: an historical perspective. Hematology Am Soc Hematol Educ Program. 2008;1:365. doi: 10.1182/asheducation-2008.1.365. [DOI] [PubMed] [Google Scholar]
- 3.Howlader N, Noone AM, Krapcho M, Garshell J, Miller D, Altekruse SF, et al., editors. SEER Cancer Statistics Review 1975–2012 [Internet] Bethesda, MD: National Cancer Institute; 2015. [cited 2015 Aug 25]. Available from: http://seer.cancer.gov/csr/1975_2012/. [Google Scholar]
- 4.Bhatia S, Sather HN, Heerema NA, Trigg ME, Gaynon PS, Robison LL. Racial and ethnic differences in survival of children with acute lymphoblastic leukemia. Blood. 2002;100:1957–64. doi: 10.1182/blood-2002-02-0395. [DOI] [PubMed] [Google Scholar]
- 5.Kadan-lottick NS, Ness KK, Bhatia S, Gurney JG. Survival variability by race and ethnicity in childhood acute lymphoblastic leukemia. JAMA. 2003;290:2008–14. doi: 10.1001/jama.290.15.2008. [DOI] [PubMed] [Google Scholar]
- 6.Pui CH, Boyett JM, Relling MV, Harrison PL, Rivera GK, Behm FG, et al. Sex differences in prognosis for children with acute lymphoblastic leukemia. J Clin Oncol. 1999;17:818–24. doi: 10.1200/JCO.1999.17.3.818. [DOI] [PubMed] [Google Scholar]
- 7.Pollock BH, Debaun MR, Camitta BM, Shuster JJ, Ravindranath Y, Pullen DJ, et al. Racial differences in the survival of childhood B-precursor acute lymphoblastic leukemia: a Pediatric Oncology Group Study. J Clin Oncol. 2000;18:813–23. doi: 10.1200/JCO.2000.18.4.813. [DOI] [PubMed] [Google Scholar]
- 8.Smith M, Arthur D, Camitta B, Carroll AJ, Crist W, Gaynon P, et al. Uniform approach to risk classification and treatment assignment for children with acute lymphoblastic leukemia. J Clin Oncol. 1996;14:18–24. doi: 10.1200/JCO.1996.14.1.18. [DOI] [PubMed] [Google Scholar]
- 9.The Children’s Oncology Group [homepage on the Internet] [cited 2015 Aug 25]. Available from: http://www.childrensoncologygroup.org/index.php/aboutus.
- 10.Hunger SP, Lu X, Devidas M, Camitta BM, Gaynon PS, Winick NJ, et al. Improved survival for children and adolescents with acute lymphoblastic leukemia between 1990 and 2005: a report from the children’s oncology group. J Clin Oncol. 2012;30:1663–9. doi: 10.1200/JCO.2011.37.8018. [DOI] [PMC free article] [PubMed] [Google Scholar]
- 11.Pulte D, Gondos A, Brenner H. Trends in 5- and 10-year survival after diagnosis with childhood hematologic malignancies in the United States, 1990–2004. J Natl Cancer Inst. 2008;100:1301–9. doi: 10.1093/jnci/djn276. [DOI] [PubMed] [Google Scholar]
- 12.Ma H, Sun H, Sun X. Survival improvement by decade of patients aged 0–14 years with acute lymphoblastic leukemia: a SEER analysis. Sci Rep. 2014;4:4227. doi: 10.1038/srep04227. [DOI] [PMC free article] [PubMed] [Google Scholar]
- 13.Surveillance, Epidemiology, and End Results Program [homepage on the Internet] [cited 2015 Aug 25]. Available from: http://seer.cancer.gov/about/.
- 14.Fritz A, Percy C, Jack A, Shanmugaratnam K, Sobin L, Parkin DM, et al. International classification of diseases for oncology: ICD-O. Geneva: World Health Organization; 2000. [cited 2015 Aug 25]. Available from: http://apps.who.int/iris/bitstream/10665/96612/1/9789241548496_eng.pdf?ua=2. [Google Scholar]
- 15.Gomez SL, Le GM, West DW, Satariano WA, O’connor L. Hospital policy and practice regarding the collection of data on race, ethnicity, and birthplace. Am J Public Health. 2003;93:1685–8. doi: 10.2105/ajph.93.10.1685. [DOI] [PMC free article] [PubMed] [Google Scholar]
- 16.NAACCR Race and Ethnicity Work Group. NAACCR Guideline for Enhancing Hispanic/Latino Identification: revised NAACCR Hispanic/Latino Identification Algorithm [NHIA v2.2.1] Springfield, IL: North American Association of Central Cancer Registries; p. 2011. [cited 2015 Aug 25]. Available from: http://www.naaccr.org/LinkClick.aspx?filetick-et=6E20OT41TcA%3D. [Google Scholar]
- 17.Howlader N, Ries LA, Mariotto AB, Reichman ME, Ruhl J, Cronin KA. Improved estimates of cancer-specific survival rates from population-based data. J Natl Cancer Inst. 2010;102:1584–98. doi: 10.1093/jnci/djq366. [DOI] [PMC free article] [PubMed] [Google Scholar]
- 18.Gray RJ. A class of K-sample tests for comparing the cumulative incidence of a competing risk. Ann Stat. 1988;16:1141–54. [Google Scholar]
- 19.Grambsch PM, Therneau TM. Proportional hazards tests and diagnostics based on weighted residuals. Biometrika. 1994;81:515–26. [Google Scholar]
- 20.Pui CH, Boyett JM, Hancock ML, Pratt CB, Meyer WH, Crist WM. Outcome of treatment for childhood cancer in black as compared with white children: the St Jude Children’s Research Hospital experience, 1962 through 1992. JAMA. 1995;273:633–7. [PubMed] [Google Scholar]
- 21.Pui CH, Pei D, Pappo AS, Howard SC, Cheng C, Sandlund JT, et al. Treatment outcomes in black and white children with cancer: results from the SEER database and St Jude Children’s Research Hospital, 1992 through 2007. J Clin Oncol. 2012;30:2005–12. doi: 10.1200/JCO.2011.40.8617. [DOI] [PMC free article] [PubMed] [Google Scholar]
- 22.Vega WA, Amaro H. Latino outlook: good health, uncertain prognosis. Annu Rev Public Health. 1994;15:39–67. doi: 10.1146/annurev.pu.15.050194.000351. [DOI] [PubMed] [Google Scholar]
- 23.Rivera-luna R, Cardenas-cardos R, Leal-leal C, Meza-coria C. Leukemia in Mexican versus Mexican-American children. J Clin Oncol. 2000;18:2349–51. [PubMed] [Google Scholar]
- 24.Goggins WB, Lo FF. Racial and ethnic disparities in survival of US children with acute lymphoblastic leukemia: evidence from the SEER database 1988–2008. Cancer Causes Control. 2012;23:737–43. doi: 10.1007/s10552-012-9943-8. [DOI] [PubMed] [Google Scholar]
- 25.Pieters R, Schrappe M, De Lorenzo P, Hann I, De Rossi G, Felice M, et al. A treatment protocol for infants younger than 1 year with acute lymphoblastic leukaemia (Interfant-99): an observational study and a multicentre randomised trial. Lancet. 2007;370:240–50. doi: 10.1016/S0140-6736(07)61126-X. [DOI] [PubMed] [Google Scholar]
- 26.Dreyer ZE, Dinndorf PA, Camitta B, Sather H, La MK, Devidas M, et al. Analysis of the role of hematopoietic stem-cell transplantation in infants with acute lymphoblastic leukemia in first remission and MLL gene rearrangements: a report from the Children’s Oncology Group. J Clin Oncol. 2011;29:214–22. doi: 10.1200/JCO.2009.26.8938. [DOI] [PMC free article] [PubMed] [Google Scholar]
- 27.Harvey RC, Mullighan CG, Chen IM, Wharton W, Mikhail FM, Carroll AJ, et al. Rearrangement of CRLF2 is associated with mutation of JAK kinases, alteration of IKZF1, Hispanic/Latino ethnicity, and a poor outcome in pediatric B-progenitor acute lymphoblastic leukemia. Blood. 2010;115:5312–21. doi: 10.1182/blood-2009-09-245944. [DOI] [PMC free article] [PubMed] [Google Scholar]
- 28.Yang JJ, Cheng C, Devidas M, Cao X, Fan Y, Campana D, et al. Ancestry and pharmacogenomics of relapse in acute lymphoblastic leukemia. Nat Genet. 2011;43:237–41. doi: 10.1038/ng.763. [DOI] [PMC free article] [PubMed] [Google Scholar]
- 29.Lund MJ, Eliason MT, Haight AE, Ward KC, Young JL, Pentz RD. Racial/ethnic diversity in children’s oncology clinical trials: ten years later. Cancer. 2009;115:3808–16. doi: 10.1002/cncr.24437. [DOI] [PubMed] [Google Scholar]
- 30.Bhatia S, Landier W, Hageman L, Kim H, Chen Y, Crews KR, et al. 6MP adherence in a multiracial cohort of children with acute lymphoblastic leukemia: a Children’s Oncology Group study. Blood. 2014;124:2345–53. doi: 10.1182/blood-2014-01-552166. [DOI] [PMC free article] [PubMed] [Google Scholar]
- 31.Bhatia S, Landier W, Shangguan M, Hageman L, Schaible AN, Carter AR, et al. Nonadherence to oral mercaptopurine and risk of relapse in Hispanic and non-Hispanic white children with acute lymphoblastic leukemia: a report from the children’s oncology group. J Clin Oncol. 2012;30:2094–101. doi: 10.1200/JCO.2011.38.9924. [DOI] [PMC free article] [PubMed] [Google Scholar]
- 32.Clegg LX, Reichman ME, Hankey BF, Miller BA, Lin YD, Johnson NJ, et al. Quality of race, Hispanic ethnicity, and immigrant status in population-based cancer registry data: implications for health disparity studies. Cancer Causes Control. 2007;18:177–87. doi: 10.1007/s10552-006-0089-4. [DOI] [PubMed] [Google Scholar]
- 33.Root MP. The multiracial experience: racial borders as the new frontier. Thousand Oaks, CA: Sage; 1996. [Google Scholar]
Associated Data
This section collects any data citations, data availability statements, or supplementary materials included in this article.