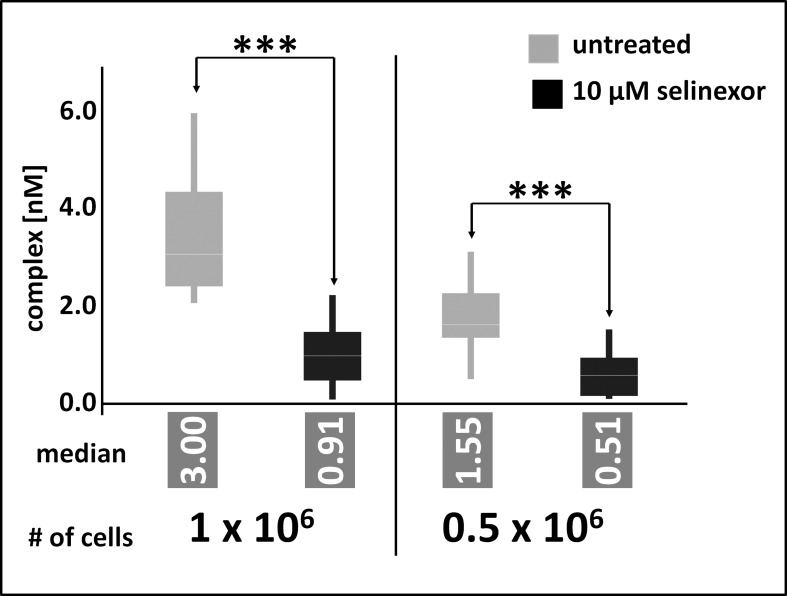
Figure 5. FCCS application as an analytical tool in clinical studies.
Z138 cells were counted and treated for 4 hours with 10μM selinexor, washed and directly processed to cellular lysates. Lysates were incubated with fluorescence labeled LMB (LMB647) and ATTO488 labeled anti XPO1 antibody (XPO1 AB488) for 2 hours and complex formation was analyzed on a ConfoCor2 Correlation Spectroscope. The absolute values for the XPO1 complexes were plotted. Measurements were done either 100 times for 8 seconds for 1 × 10⁶ cells or 200 times for 0.5 × 10⁶ cells. Differences between control and treated samples were significant based on the p-value determined with a standard t-Test using the excel statistics plugin, *** indicates p-values obtained: 1 × 10⁶ cells, p = 2.69 × 10⁻²⁴; 0.5 × 10⁶ cells, p = 4.8 × 10⁻¹⁵.

