

Abstract
Objective:
Lymphopenia is a common occurrence of disease-modifying therapies (DMTs) for relapsing-remitting MS (RRMS). The aim of this study was to dissect the prevalence of various lymphocyte subsets in patients with RRMS treated with 2 DMTs commonly associated with lymphopenia, dimethyl fumarate (DMF), and fingolimod (FTY).
Methods:
Multicolor flow cytometry and multiplex assays were used to identify up to 50 lymphocyte subpopulations and to examine the expression of multiple cytokines in selected patients. We compared patients untreated (NT) or treated with FTY or DMF who did (DMF-L) or did not (DMF-N) develop lymphopenia.
Results:
All FTY patients developed lymphopenia in both T-cell and B-cell compartments. CD41 T cells were more affected by this treatment than CD81 cells. In the B-cell compartment, the CD271IgD2 subpopulation was reduced. T cells but not B cells were significantly reduced in DMF-L. However, within the B cells, CD271 cells were significantly lower. Both CD41 and CD81 subpopulations were reduced in DMF-L. Within the remaining CD41 and CD81 compartments, there was an expansion of the naive subpopulation and a reduction of the effector memory subpopulation. Unactivated lymphocyte from DMF-L patients had significantly higher levels of interferon-γ, interleukin (IL)-12, IL-2, IL-4, IL-6, and IL-1β compared with DMF-N. In plasma, TNFβ was significantly higher in DMF-N and DMF-L compared with NT, whereas CCL17 was significantly higher in DMF-L compared with NT and DMF-N.
Conclusions:
This study shows that different treatments can target different lymphocyte compartments and suggests that lymphopenia can induce compensatory mechanisms to maintain immune homeostasis.
Disease-modifying therapies (DMTs) improve the outcome of MS by reducing relapses, number, and volume of lesions.1 The mechanisms of action of DMTs involve the reduction of immune activation, which could potentially lead to complications such as lymphopenia, a risk factor for the development of infections.1,2 A detailed analysis of the immunologic changes induced by DMTs allows us to identify patients who are at higher risk of developing DMT-associated complications and to gain more insights into the mechanism(s) of the DMTs and pathophysiology of MS.
Dimethyl fumarate (DMF) reduces disease activity through several mechanisms such as induction of apoptosis of activated T cells,3,4 shift of CD4+ T cells toward a Th2 profile,5 and reduction of dendritic cell (DC) maturation.6 DMF has been shown to selectively reduce memory T cells in MS and decrease the overall B-cell population, in particular mature B cells.7–9
Fingolimod (FTY), a sphingosine-1-receptor antagonist, reduces the egression of lymphocytes from the lymph nodes, with subsequent reduction of the circulating pool of lymphocytes.10 FTY-treated patients with MS show a reduction in T cells and B cells, as well as changes in the ratio of T- and B-cell subpopulations.11–17
In this study, we characterized the mononuclear cell population of patients who have developed lymphopenia. We developed high-dimensional immunophenotyping panels to study various cell surface markers simultaneously at a single cell level and determine the quality of lymphopenia induced by DMF vs FTY.
METHODS
Standard protocol approvals, registrations, and patient consents.
A total of 55 relapsing-remitting MS (RRMS) patient samples were collected from the Northern Alberta MS Clinic, Alberta, Canada, after approval from the University of Alberta Ethics Committee. Written informed consent was obtained before the blood draw to isolate human peripheral blood mononuclear cells (PBMCs) in accordance with the Ethics Committee recommendations.
Flow cytometry.
All antibodies and reagents were purchased from BD Biosciences (Mississauga, ON). One hundred microliters of blood was mixed with freshly made antibody cocktails, no later than 6 hours from the time of collection (stored at room temperature). Clone and product numbers of antibodies are indicated in table e-1 (links.lww.com/NXI/A16). Red blood cells are then lysed using 1XPharmLyse (BD FACS lysing solution) according to the instruction manual. Panels were designed based on antigen density and consideration of spillover characteristics of selected fluorochrome conjugates. Stained samples and controls (gating, compensation, fluorescence minus one) were run on a BD LSRFortessa SORP. Data were analyzed using FlowJo (version 10.3; FlowJo, LLC, Ashland, OR, 2006–2017) and JMP (version 13.0; SAS, Cary, NC, 2017). Results are expressed as a percentage of child to parent gating or as % of the total cell count over the original PBMC gate. Gating strategies of each panel are shown in figure e-1 (links.lww.com/NXI/A16). To calculate the lymphocyte subpopulation counts, the cell events were divided by the sum of T- and B-cell events. This ratio was then normalized to lymphocyte absolute counts by multiplying the ratio to the lymphocyte absolute count.
Cytokine assay.
Meso Scale Discovery (Rockville, MD) V-PLEX multiplex assay panels table e-2 (links.lww.com/NXI/A16), were used to measure the levels of a number of cytokines in both plasma and cell culture supernatants.
Cryopreserved PBMCs were thawed and allowed to recover overnight in AIM-V medium (Gibco). They were then divided into activated and unactivated cells and plated for 72 hours at equal concentrations, with the activated cells being plated with immobilized CD3 (4 μg/mL) and soluble CD28 (40 ng/mL). The activated cells were then incubated with phorbol myristate acid (PMA) (100 ng/mL) and ionomycin (500 ng/mL) for an additional 5 hours. Cytokine kits were run according to the manufacturer's instructions for plasma samples. Results registering below the detection limits were replaced with half the lower detection limit and those above the detection limit, with 1.5 times the upper limit.
Statistical analysis.
All statistical analysis was performed using JMP and presented as mean ± SD/SEM. A 1-way analysis of variance (ANOVA) test was used to compare 2 or more groups, with the Each Pair, Student t test used for individual pairwise comparisons between groups. A p value of <0.01 was considered statistically significant. Principal component analysis (PCA) was used to reduce the dimensionality, with the proximity on the plots corresponding to the overall similarity between samples. To transform 3D high-dimensional patient data sets into 2D low-dimensional data sets, t-distributed stochastic neighbor embedding (t-SNE) analysis was performed.18 For the exploratory analysis of cytokine levels, 1-way ANOVA was performed, followed by Bonferroni tests with a p value of <0.05 being considered statistically significant.
RESULTS
T-cell subcompartments are differentially affected in lymphopenic DMF- and FTY-treated patients.
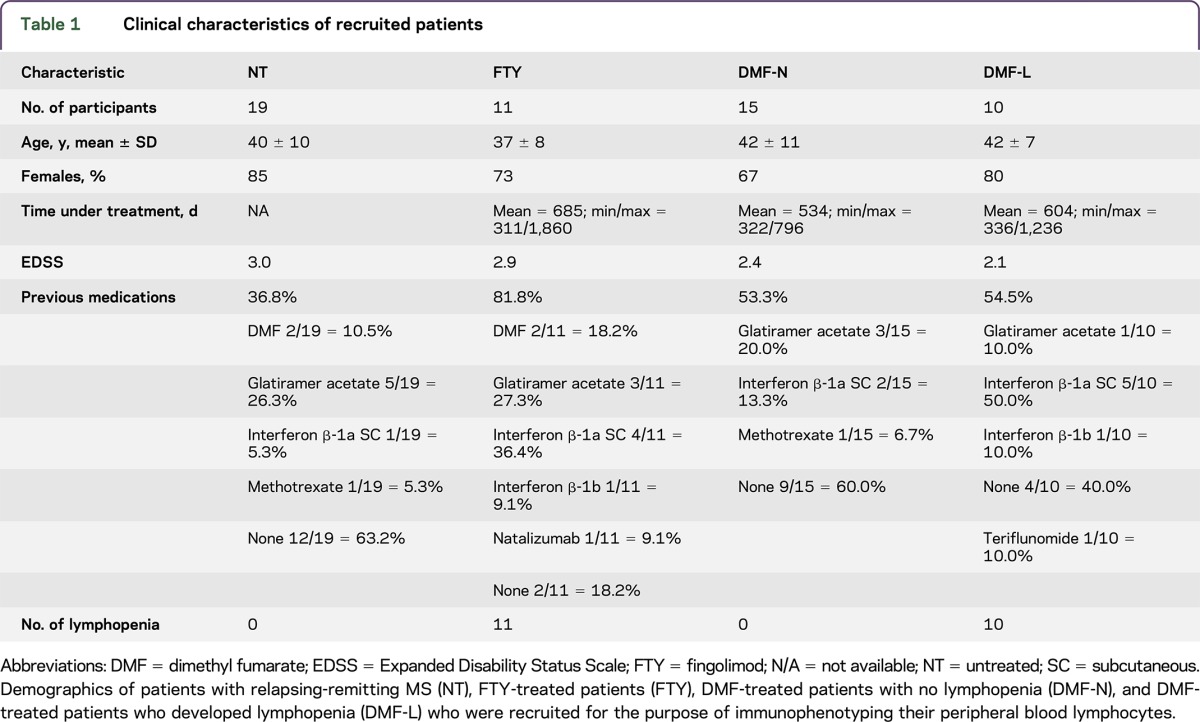
Table 1 indicates the demographics of the patient populations. According to Common Terminology Criteria for Adverse Events, lymphocyte counts higher than 0.9×10⁹/L were considered nonlymphopenic (grade 0), ≤0.9 × 10⁹/L were scored as grade 1, ≤0.8 × 10⁹/L as grade 2, ≤0.5 × 10⁹/L were scored as grade 3, and ≤0.2 were scored as grade 4. All patients treated with FTY for more than 1 year developed severe lymphopenia, whereas 40% of patients treated with DMF more than 1 year developed lymphopenia (figure e-2, links.lww.com/NXI/A16), allowing for subclassification of the DMF group to DMF-N (nonlymphopenic) and DMF-L (lymphopenic). In our study, only 1 DMF-treated patient developed grade 3 lymphopenia.
Table 1.
Clinical characteristics of recruited patients
We designed 2 multiparametric panels that allowed us to detect the expression of 14 and 17 cell surface markers each (figure e-1, links.lww.com/NXI/A16). The first panel was designed to identify major subpopulations including T cells, B cells, natural killer (NK) cells, monocytes, and DCs (figure e-1A, links.lww.com/NXI/A16). The second panel focused on different CD3+ T-cell subpopulations (figure e-1B, links.lww.com/NXI/A16).
Cell counts indicated that FTY patients have a significant decrease in the overall number of CD3+ cells (figure e-3, links.lww.com/NXI/A16). CD3+CD4+ cell counts were approximately 95% lower in FTY patients compared with untreated (NT) patients, while the reduction of CD3+CD8+ cell counts was not significant (figure e-3, links.lww.com/NXI/A16). CD3+ cell counts were significantly reduced in DMF-L compared with NT patients, with significant reductions in both CD3+CD8+ and CD3+CD4+ populations (figure e-3, links.lww.com/NXI/A16, and figure 1, A–C).
Figure 1. The abundance of CD3+ T cells and their subtypes are significantly affected by FTY and DMF treatment.

(A) Flow cytometric analysis of the peripheral blood of NT (n = 19), FTY-treated patients (FTY, n = 11), DMF-treated patients with no lymphopenia (DMF-N, n = 15), and DMF-treated patients who developed lymphopenia (DMF-L, n = 10) looking at the abundance of CD3+ (A), CD4+ (B), and CD8+ (C) populations within PBMCs. (D) The frequencies of CD4+, CD8+, CD4−CD8−, and CD4+CD8+ within the CD3+ T-cell population (% of CD3). (E) The ratio of CD4+ to CD8+ cells was calculated using values in D. The horizontal lines indicate the average mean of each group, and the bars are the SEM. p Values are indicated as insets; those reaching statistical significance are highlighted in red. DMF = dimethyl fumarate; FTY = fingolimod; NT = untreated; PBMC = peripheral blood mononuclear cell.
Among the remaining CD3+ cells, there was a significant redistribution of cells regarding CD4 and CD8 expression in patients treated with FTY but not DMF. FTY patients had a significantly higher proportion of CD4−CD8− cells within the CD3+ population compared with all other groups (figure 1D), and the ratio of CD4+ to CD8+ cells was significantly lower in FTY patients compared with NT (figure 1E). Both lymphopenic and nonlymphopenic DMF patients had a similar distribution of CD4+ and CD8+ cells as well as NT patients (figure 1, D and E).
To further characterize peripheral lymphocytes in lymphopenic patients, we looked at the expression of the homing receptors CCR7 and CD62L (L-selectin) in both CD4+ and CD8+ cells. The naive population (CD45RA+CCR7+) within CD4+ cells was significantly reduced in FTY patients compared with all other groups; however, DMF-L had a higher percent of naive CD4+ cells compared with NT and FTY (figure e-4A, links.lww.com/NXI/A16). FTY patients had the highest rate of effector memory cells (CD45RA−CCR7−) among all groups, with DMF-L having a lower rate compared with NT and FTY (figure e-4A, links.lww.com/NXI/A16). Both effector (CD45RA+CCR7−) and central memory cells (CD45RA−CCR7+) in CD4+ cells did not change significantly in FTY and DMF patients compared with NT; however, DMF patients had significantly lower central memory CD4+ than FTY-treated ones (figure e-4A, links.lww.com/NXI/A16). Next, we looked at CD62L vs CD45RA expression. The frequency pattern for CD62L expression in CD4+ cells was similar to CCR7 expression between groups (figure e-4B, links.lww.com/NXI/A16).
Among the CD8+ cells, the frequency of naive cells was the lowest in FTY-treated patients compared with all other groups and higher in DMF-L compared with NT and FTY (figure e-4C, links.lww.com/NXI/A16). DMF-L had a lower frequency of effector memory cells in CD8+ cells compared with NT and FTY. FTY patients had no significant change in the CD8+ effector memory frequency when compared with NT but had significantly higher levels than both DMF-L and DMF-N (figure e-4C, links.lww.com/NXI/A16). The frequency of effector cells in the CD8+ population was the highest in FTY, whereas all other groups had a similar frequency of effector cells. The frequencies of central memory cells were not different within groups (figure e-4C, links.lww.com/NXI/A16). CD45RA+CD62L+ in CD8+ cells were lowest in FTY-treated patients, whereas DMF-L was not statistically different from NT. Both CD45RA−CD62L− and CD45RA+CD62L− frequencies in CD8+ cells were highest in FTY-treated patients but were not affected by DMF treatment (figure e-4D, links.lww.com/NXI/A16). The CD8+ CD45RA−CD62L+ population was not significantly different between groups (figure e-4D, links.lww.com/NXI/A16).
The frequency of various CD4+ subpopulations and the T-cell receptor γδ are different in lymphopenic DMF-treated patients vs FTY-treated patients.
Next, we investigated the frequency of various T-helper subpopulations within the remaining CD4+ T cells in peripheral blood. Although CD119 expression (a marker for Th1-polarized cells) was not significantly changed between NT and patients treated with DMF or FTY, FTY-treated patients did have a significantly higher proportion of CD119+ cells when compared with both DMF-L and DMF-N (figure 2A). Expression of CRTH2 (CD294), a marker of Th2 phenotype in CD4+ cells, was not significantly different among the groups (figure 2B). Th17 cells, identified by expression of CD196 (CCR6), were significantly lower in DMF-L compared with NT. FTY-treated patients had a significantly higher fraction of CD196+ within CD4+ cells compared with both DMF-L and DMF-N, whereas no significant changes were detected between FTY and NT (figure 2C). The frequency of follicular B-helper T cells (Tfh) in CD4+ cells identified by expression of CXCR5 (CD185) was not different among the groups (figure 2D). The fraction of Th22 cells defined by expression of CCR10 in CD4+ cells was significantly higher in FTY-treated patients when compared with all other groups, whereas DMF-treated patients with or without lymphopenia had no significant difference in Th22 frequency (figure 2E). The overall numbers of Th1 and Th17 were significantly reduced in FTY, DMF-N, and DMF-L patients when compared with NT (figures e-5A and e-5C, respectively, links.lww.com/NXI/A16). Th2 and Th22 did not significantly change in any of the tested groups (figures e-5B and e-5D, links.lww.com/NXI/A16). Tfh cells had the lowest frequency in the FTY-treated group (figure e-5E, links.lww.com/NXI/A16). Tfh cell numbers were trending toward a decrease in DMF-L compared with NT patients, with DMF-N patients having a significantly lower level (figure e-5E, links.lww.com/NXI/A16).
Figure 2. The frequency of helper T cells (Th) within CD4+ population and TCRγδ within CD3+ cells is affected by FTY and DMF treatment.

The proportion of Th within CD4+ cells was determined by flow cytometric analysis of peripheral blood for identification of Th1 by CD119+ cells (A), Th2 by CD294+ cells (B), Th17 by CD196+ cells (C), Tfh by CXCR5+ cells (D), and Th22 by CCR10+ cells (E). (F) The frequency of TCRγδ within CD3+ T cells. The horizontal lines indicate the average mean of each group, and the bars are the SEM. p Values are indicated as insets; those reaching statistical significance are highlighted in red. DMF = dimethyl fumarate; FTY = fingolimod; NT = untreated; PBMC = peripheral blood mononuclear cell.
Then, we examined the distribution of T-cell receptor γδ (TCRγδ) cells in the same patients. The fraction of TCRγδ among CD3+ cells was significantly higher in FTY-treated patients compared with all other groups and unchanged in either DMF-treated patients with or without lymphopenia (figure 2F). The overall number of TCRγδ was decreased only in DMF-L patients when compared with NT (Figure e-5F, links.lww.com/NXI/A16).
CD19+ B cells are reduced in FTY-treated patients, and their subpopulations are differentially distributed in both FTY and DMF patients.
Next, we sought to determine whether the B cells (CD19+) were affected differently in DMF-L patients vs FTY. The DMF-L group had an increase in the overall B-cell compartment in comparison to NT, whereas the overall B-cell count in FTY patients was significantly lower (figure 3A and figure e-6, links.lww.com/NXI/A16). Within the CD19+ population, naive and transitional B cells (CD27−IgD+) had a higher frequency in both DMF-treated groups, whereas FTY-treated patients showed no significant changes compared with NT (figure 3B). Both DMF-treated groups had a lower frequency of preswitch memory cells (CD27+IgD+) when compared with NT, whereas the same subpopulation was not affected in FTY-treated patients (figure 3C). Both FTY and all DMF-treated patients had reduced class-switched memory (CD27+IgD−) frequencies when compared with NT (figure 3D). Classic memory B-cell (CD27−IgD−) frequencies were not significantly different between the groups (figure 3E).
Figure 3. B-cell amount and the frequency of various B-cell subtypes are differentially affected by FTY or DMF treatment.

Flow cytometric analysis of the peripheral blood of NT (n = 19), FTY-treated patients (FTY, n = 11), DMF-treated patients with no lymphopenia (DMF-N, n = 15), and DMF-treated patients who developed lymphopenia (DMF-L, n = 10). (A) Frequency of B cells illustrated as % of CD19+ cells within PBMCs. The frequency of naive and transitional B cells (CD27−IgD+, B), preswitch memory (CD27+IgD+, C), class-switched memory (CD27+IgD−, D), and classic memory (CD27−IgD−, E) is calculated as % of CD19+ cells. The horizontal lines indicate the average mean of each group, and the bars are the SEM. p Values are indicated as insets; those reaching statistical significance are highlighted in red. DMF = dimethyl fumarate; FTY = fingolimod; NT = untreated; PBMC = peripheral blood mononuclear cell.
The proportion of monocytes, NKs, and DCs is different between DMF- and FTY-treated patients.
Next, we aimed at determining whether FTY-treated or DMF-L–treated patients have different amounts of other major mononuclear cells: monocytes, NK cells, and dendritic cells (DCs). Monocytes were identified as CD14+ cells within the CD3−CD19−population. Both FTY-treated and DMF-L–treated patients had higher amounts of monocytes compared with NT (figure e-7A, links.lww.com/NXI/A16). FTY-treated patients had a higher amount of NK cells (CD3−CD19−CD56+CD16+) than all other groups, whereas DMF-treated patients had a similar NK frequency compared with NT (figure e-7B, links.lww.com/NXI/A16). FTY-treated patients had a significantly higher CD3−CD19−CD14−HLA−Dr+ (DCs) when compared with all other groups. DMF-L patients also had a higher frequency of DCs within the PBMCs when compared with NT and DMF-N patients (figure e-7C, links.lww.com/NXI/A16).
Lymphopenic DMF patients have a different cytokine profile in comparison to NT and nonlymphopenic DMF patients.
To investigate the cytokine profile of lymphopenic patients, we measured the levels of 38 molecules in the plasma and supernatants from PBMCs using a multiplex assay in a subset of NT and DMF-treated patients. Because all the FTY patients developed lymphopenia, they were excluded from the analysis because of the lack of a control group. All cytokine levels are shown in figure e-8 (links.lww.com/NXI/A16). The cytokines with a statistically significant difference among NT, DMF-L, and DMF-N are shown in figure 4. In the plasma, TNFβ was higher in DMF-N– and DMF-L–treated groups when compared with NT (figure 4A). CCL17 was also significantly different between groups, with higher levels in the DMF-L (figure 4B).
Figure 4. Abundance of cytokines which showed significant difference in expression in the plasma and the cultured PBMC of patients with RRMS.

Multiplex cytokine assay analysis of plasma levels of (A) TNFβ and (B) CCL17. Multiplex cytokine assay analysis was also performed on unactivated PBMC supernatant levels of (C) IFN-γ, (D) IL-2, (E) IL-4, (F) IL-6, (G) IL-12, and (H) IL-1β for NT (n = 3), DMF-treated patients with no lymphopenia (DMF-N, n = 3 for plasma and n = 4 for supernatants), and DMF-treated patients who developed lymphopenia (DMF-L, n = 3 for plasma and n = 4 for supernatants). The horizontal lines indicate the average mean of each group, and the bars are the SEM. p Values are indicated as insets; those reaching statistical significance are highlighted in red. DMF = dimethyl fumarate; FTY = fingolimod; IFN = interferon; IL = interleukin; NT = untreated; PBMC = peripheral blood mononuclear cell; RRMS = relapsing-remitting MS.
To study the function of leukocytes in response to stimulation, we measured the cytokine production by PBMCs of patients with and without activation by CD3/CD28. In the unactivated cells, there were significant differences on the levels of interferon (IFN)-γ, interleukin (IL)-2, IL-6, IL-12p70, IL-4, and IL-1β (figure 4, C–H). IFN-γ was significantly lower in the DMF-N group (figure 4C). The levels of IL-2, IL-6, IL-12p70, IL-4, and IL-1β were all significantly higher in the DMF-L group than those in the DMF-N group (figure 4, D–H). On activation, all cytokine levels increased; however, no significant differences were detected among the different groups (figure e-8C, links.lww.com/NXI/A16).
DISCUSSION
In this study, we aimed to investigate the changes to the immune compartments of patients with MS treated with DMTs that can potentially induce lymphopenia. In our study, all patients treated with FTY for more than 1 year developed lymphopenia. Our findings contrast with those found in the FREEDOMS II trial that showed approximately 10% of patients developed lymphopenia after receiving FTY.19 This discrepancy might be due to different patient characteristics and possible exposure to previous medications in our population. Our findings showing lymphopenia in DMF patients are consistent with previous reports in which 5% of patients developed severe lymphopenia.20,21
Consistent with previous findings, we detected reduced CD4+- and CD8+-naive cells in FTY-treated patients.22,23 However, we were not able to detect significant changes in CD4+ and CD8+ central memory populations. The reason for this discrepancy is unclear. The disproportionate decrease in the CD4+ vs CD8+ subpopulations could be explained by the observation that in NT patients and healthy controls, most CD62L+ T cells are CD4+; thus, CD4+ cells have a higher chance of homing and consequently being trapped into the lymphoid organs (figure e-9, links.lww.com/NXI/A16).
DMF-treated lymphopenic patients had a decreased number of CD8+ cells, as reported in previous studies.7,24,25 In agreement with our observation, Perrone and Williamson26 have shown that the CD4+/CD8+ cell ratio is increased in DMF patients and decreases rapidly on discontinuation of DMF, although this ratio did not reach statistical significance in our study. Consistent with these findings, a recent study showed that DMF induces apoptosis in CD3+ cells, affecting CD8+ more than CD4+ cells and, within these subpopulations, memory cells more than naive cells.27 Unlike Longbrake et al.,7 we did not detect a significant redistribution of CD3+ cell subpopulations in DMF-treated patients with no lymphopenia; however, we did detect redistribution of CD4+ and CD8+ cells in DMF-treated patients with lymphopenia. In line with previous findings, DMF-L patients had drastically a higher naive population and a lower effector memory population within both CD4+ and CD8+ cells.7,27 Because it has been shown that CD8+ T cells found in CSF and lesions of patients with RRMS are mostly CD62L effector memory T cells, depletion of this population in the DMF-L patients could be one of the mechanisms by which DMF reduces MS activity.28 However, because the main function of CD8+ memory cells is to protect against viral infections, low levels of CD8+ effector memory and central memory may be an indicator of patients being at risk of developing viral infections and thus needing more frequent monitoring.29
In agreement with previous findings, we observed a reduction of Th1 and Th17 cells with both FTY and DMF.7,25,27 The role of Th1 and Th17 in inducing MS lesions is well established, and the reduced number of these cells by these treatments could be another way to reduce MS disease activity by FTY and DMF.30,31
Consistent with previous observations, we also observed a significant decrease in the B-cell population in FTY-treated patients.13–17 Although previous studies have shown significant decreases in both class-switched and non–class-switched memory B cells, our data showed significant changes only in the class-switched memory (CD27+IgD−) compartment.12–14,16
Unlike previous studies, we did not observe an overall decrease in CD19+ B cells in DMF-treated patients compared with NT.7,9,24 However, we found redistribution of CD19+ B cells in DMF-treated patients, with naive and transitional (CD27−IgD+) B cells being increased in DMF patients. We also saw an decrease of preswitch memory and class-switched memory B cells in DMF patients. This observation supports the previous findings, showing more severe reduction of memory than naive B cells in vivo and in vitro, by induction of apoptosis in mature B cells by DMF treatment.9 The importance of B cells in MS is highlighted by the success of B-cell depletion drugs in reducing disease activity. Thus, reduction of memory B cells in DMF-treated patients could be another mechanism by which DMF reduces MS activity.
The effect of FTY and DMF on TCRγδ T cells has not been previously described. TCRγδ T cells are considered a link between adaptive and innate immunity because they share functionalities of both systems.32 We found that TCRγδ T cells were reduced in DMF-treated patients who developed lymphopenia. However, this was an indirect consequence of the decrease in the overall CD3+ population, suggesting that the effect of DMF is independent of TCR variations. On the other hand, the apparent increase in the FTY-treated patients was related to a decrease in the other T-cell compartments, suggesting no significant effect of FTY on the TCRγδ T-cell population.
To investigate potential soluble biomarkers of lymphopenia, we analyzed the cytokine profile in a subgroup of patients and found higher levels of circulating TNFβ and CCL17 in DMF-L patients. CCL17 (also known as thymus and activation regulated chemokine or TARC) is a ligand for CCR4, a receptor expressed on Th17 cell and Tregs.33–35 CCL17 levels have been shown to correlate with monocyte numbers.36 We also observed a correlation between the fraction of monocytes and amounts of CCL17 in DMF-L patients. CCL17 also plays a role in the trafficking of mature T cells and their activation and development in the thymus.33 TNFβ (also known as lymphotoxin-α) has been linked to NK cell proliferation and activity and also has proinflammatory effects.37–39 Furthermore, in the supernatant from unactivated cells, the DMF-L group had significantly higher levels of some proinflammatory and regulatory cytokines than the DMF-N group. This increase in cytokine production may be because of a higher activation state in the lymphopenic group induced by compensatory mechanisms to maintain immunity in the face of fewer immune cells. The lack of significant differences in cytokine levels after activation may be due to different factors such as the small sample size or a masking effect related to overactivation.
Computational analysis of high-dimensional data by algorithms such as t-SNE (figure e-10, links.lww.com/NXI/A16), enables us to grasp an overall view of the changes occurring in peripheral blood of patients with and without treatment.18 As shown in figure e-10 (links.lww.com/NXI/A16), the overall distribution of PBMC compartments differs between groups. The high throughput data generated in our study may also help us to identify patients at risk of potential complications associated with lymphopenia. For instance, the PCA indicated clustering of patients according to treatment in panel 1 (figure e-11, links.lww.com/NXI/A16). Of interest, patients with the same lymphocyte count cluster differently: RRMS023 and RRMS011 both have a lymphocyte level of 0.9, but RRMS023 clusters with other DMF-L patients, whereas RRMS011 clusters with DMF-N patients. This may be an indicator that although the RRMS023 lymphocyte level is not alarmingly low, the patient might be at risk of developing lymphopenia-related complications (figure e-11, links.lww.com/NXI/A16). Further investigations are currently ongoing in our laboratory to determine this possibility.
Using deep cell surface marker analysis, we have shown that the quality of lymphopenia differs in the patients treated with FTY and DMF with lymphopenia. We have identified CCL17 as a molecule that is expressed differently in DMF-treated patients depending on their lymphocyte count. Whether CCL17 could be a biomarker of lymphopenia warrants further confirmation by a larger sample size. Our data suggest that, in the clinical settings, the lymphocyte count alone may not be an accurate and reliable indicator of the immune changes induced by of DMTs to identify patients at risk of complications.
ACKNOWLEDGMENT
The authors thank Aaron Hirschfeld from BD biosciences for his assistance in selection of fluorochrome conjugates for the flow cytometry panels and optimizing antibody concentrations.
GLOSSARY
- DC
dendritic cell
- DMF
dimethyl fumarate
- DMT
disease-modifying therapy
- FTY
fingolimod
- IFN
interferon
- IL
interleukin
- NT
untreated
- NK
natural killer
- PBMC
peripheral blood mononuclear cell
- PCA
principal component analysis
- RRMS
relapsing-remitting MS
- t-SNE
t-distributed stochastic neighbor embedding
Footnotes
Supplemental data at Neurology.org/nn
AUTHOR CONTRIBUTIONS
Maryam Nakhaei-Nejad: study design and acquisition and analysis of the data. David Barilla and Chieh-Hsin Lee: acquisition and analysis of the data. Gregg Blevins: critical intellectual contribution. Fabrizio Giuliani: study supervision.
STUDY FUNDING
This study was sponsored by Biogen Idec Canada Inc and Government of Alberta. The funders had no role in preparation of the manuscript.
DISCLOSURE
M. Nakhaei-Nejad, D. Barilla, and C.-H. Lee report no disclosures. G. Blevins served on the scientific advisory board of Biogen, Teva, Novartis, Genzyme, Roche, and EMD Serono/Merck; received travel funding from Biogen, Teva, Novartis, Genzyme, Roche, and EMD Serono/Merck; consulted for Biogen, Teva, Novartis, Genzyme, Roche, and EMD Serono/Merck; and received research support from the Canadian Institutes of Health Research, Alberta Innovates, the Canadian Foundation for Innovation, and the Multiple Sclerosis Society of Canada. F. Giuliani served on the scientific advisory board of Alberta MS Network; received speaker honoraria from Merck Serono, Biogen, Genzyme, and Roche; consulted for Merck Serono, Biogen, Genzyme, and Roche; and received research support from Biogen Canada and Alberta Ministry of Innovation and Advanced Education. Go to Neurology.org/nn for full disclosure forms.
REFERENCES
- 1.Wingerchuk DM, Weinshenker BG. Disease modifying therapies for relapsing multiple sclerosis. BMJ 2016;354:i3518. [DOI] [PubMed] [Google Scholar]
- 2.Delgado-Alvarado M, Sedano MJ, González-Quintanilla V, et al. . Progressive multifocal leukoencephalopathy and idiopathic CD4 lymphocytopenia. J Neurol Sci 2013;327:75–79. [DOI] [PubMed] [Google Scholar]
- 3.Höxtermann S, Nüchel C, Altmeyer P. Fumaric acid esters suppress peripheral CD4- and CD8-positive lymphocytes in psoriasis. Dermatology 1998;196:223–230. [DOI] [PubMed] [Google Scholar]
- 4.Treumer F, Zhu K, Gläser R, Mrowietz U. Dimethylfumarate is a potent inducer of apoptosis in human T cells. J Invest Dermatol 2003;121:1383–1388. [DOI] [PubMed] [Google Scholar]
- 5.de Jong R, Bezemer AC, Zomerdijk TP, et al. . Selective stimulation of T helper 2 cytokine responses by the anti- psoriasis agent monomethylfumarate. Eur J Immunol 1996;26:2067–2074. [DOI] [PubMed] [Google Scholar]
- 6.Peng H, Guerau-de-Arellano M, Mehta VB, et al. . Dimethyl fumarate inhibits dendritic cell maturation via nuclear factor κB (NF-κB) and extracellular signal-regulated kinase 1 and 2 (ERK1/2) and mitogen stress-activated kinase 1 (MSK1) signaling. J Biol Chem 2012;287:28017–28026. [DOI] [PMC free article] [PubMed] [Google Scholar]
- 7.Longbrake EE, Ramsbottom MJ, Cantoni C, et al. . Dimethyl fumarate selectively reduces memory T cells in multiple sclerosis patients. Mult Scler 2016;22:1061–1070. [DOI] [PMC free article] [PubMed] [Google Scholar]
- 8.Lundy SK, Wu Q, Wang Q, et al. . Dimethyl fumarate treatment of relapsing-remitting multiple sclerosis influences B-cell subsets. Neurol Neuroinflamm Neuroinflammation 2016;3:e211 doi: 10.1212/NXI.0000000000000211. [DOI] [PMC free article] [PubMed] [Google Scholar]
- 9.Li R, Rezk A, Ghadiri M, et al. . Dimethyl fumarate treatment mediates an anti-inflammatory shift in B cell subsets of patients with multiple sclerosis. J Immunol 2016;198:691–698. [DOI] [PubMed] [Google Scholar]
- 10.Brinkmann V. FTY720 (fingolimod) in multiple sclerosis: therapeutic effects in the immune and the central nervous system. Br J Pharmacol 2009;158:1173–1182. [DOI] [PMC free article] [PubMed] [Google Scholar]
- 11.Mehling M, Brinkmann V, Antel J, et al. . FTY720 therapy exerts differential effects on T cell subsets in multiple sclerosis. Neurology 2008;71:1261–1267. [DOI] [PubMed] [Google Scholar]
- 12.Nakamura M, Matsuoka T, Chihara N, et al. . Differential effects of fingolimod on B-cell populations in multiple sclerosis. Mult Scler 2014;20:1371–1380. [DOI] [PubMed] [Google Scholar]
- 13.Blumenfeld S, Staun-Ram E, Miller A. Fingolimod therapy modulates circulating B cell composition, increases B regulatory subsets and production of IL-10 and TGF-beta in patients with multiple sclerosis. J Autoimmun 2016;70:40–51. [DOI] [PubMed] [Google Scholar]
- 14.Miyazaki Y, Niino M, Fukazawa T, et al. . Suppressed pro-inflammatory properties of circulating B cells in patients with multiple sclerosis treated with fingolimod, based on altered proportions of B-cell subpopulations. Clin Immunol 2014;151:127–135. [DOI] [PubMed] [Google Scholar]
- 15.Grutzke B, Hucke S, Gross CC, et al. . Fingolimod treatment promotes regulatory phenotype and function of B cells. Ann Clin Transl Neurol 2015;2:119–130. [DOI] [PMC free article] [PubMed] [Google Scholar]
- 16.Claes N, Dhaeze T, Fraussen J, et al. . Compositional changes of B and T cell subtypes during fingolimod treatment in multiple sclerosis patients: a 12-month follow-up study. PLoS One 2014;9:e111115. [DOI] [PMC free article] [PubMed] [Google Scholar]
- 17.Kowarik MC, Pellkofer HL, Cepok S, et al. . Differential effects of fingolimod (FTY720) on immune cells in the CSF and blood of patients with MS. Neurology 2011;76:1214–1221. [DOI] [PubMed] [Google Scholar]
- 18.Van Der Maaten L, Hinton G, van der Maaten GH. Visualizing data using t-SNE. J Mach Learn Res 2008;9:2579–2605. [Google Scholar]
- 19.Calabresi PA, Radue EW, Goodin D, et al. . Safety and efficacy of fingolimod in patients with relapsing-remitting multiple sclerosis (FREEDOMS II): A double-blind, randomised, placebo-controlled, phase 3 trial. Lancet Neurol 2014;13:545–556. [DOI] [PubMed] [Google Scholar]
- 20.Fox RJ, Miller DH, Phillips JT, et al. . Placebo-controlled phase 3 study of oral BG-12 or glatiramer in multiple sclerosis. N Engl J Med 2012;367:1087–1097. [DOI] [PubMed] [Google Scholar]
- 21.Gold R, Kappos L, Arnold DL, et al. . Placebo-controlled phase 3 study of oral BG-12 for relapsing multiple sclerosis. N Engl J Med 2012;367:1098–1107. [DOI] [PubMed] [Google Scholar]
- 22.Chiba K, Yanagawa Y, Masubuchi Y, et al. . FTY720, a novel immunosuppressant, induces sequestration of circulating mature lymphocytes by acceleration of lymphocyte homing in rats: I: FTY720 selectively decreases the number of circulating mature lymphocytes by acceleration of lymphocyte homing. J Immunol 1998;160:5037–5044. [PubMed] [Google Scholar]
- 23.Brinkmann V, Cyster JG, Hla T. FTY720: sphingosine 1-phosphate receptor-1 in the control of lymphocyte egress and endothelial barrier function. Am J Transpl 2004;4:1019–1025. [DOI] [PubMed] [Google Scholar]
- 24.Spencer CM, Crabtree-Hartman EC, Lehmann-Horn K, et al. . Reduction of CD8+ T lymphocytes in multiple sclerosis patients treated with dimethyl fumarate. Neurol Neuroimmunol Neuroinflamm 2015;2:e76 doi: 10.1212/NXI.0000000000000076. [DOI] [PMC free article] [PubMed] [Google Scholar]
- 25.Gross CC, Schulte-Mecklenbeck A, Klinsing S, et al. . Dimethyl fumarate treatment alters circulating T helper cell subsets in multiple sclerosis. Neurol Neuroinflamm Neuroinflammation 2016;3:e183 doi: 10.1212/NXI.0000000000000183. [DOI] [PMC free article] [PubMed] [Google Scholar]
- 26.Perrone C, Williamson E. An examination of lymphocyte subpopulations in MS patients on dimethyl fumarate before and after therapy coupled with analysis of JCV serostatus. Mult Scler J 2017;23:33–34. [Google Scholar]
- 27.Ghadiri M, Rezk A, Li R, et al. . Dimethyl fumarate–induced lymphopenia in MS due to differential T-cell subset apoptosis. Neurol Neuroimmunol Neuroinflamm 2017;4:e340 doi: 10.1212/NXI.0000000000000340. [DOI] [PMC free article] [PubMed] [Google Scholar]
- 28.Ifergan I, Kebir H, Alvarez JI, et al. . Central nervous system recruitment of effector memory CD8+ T lymphocytes during neuroinflammation is dependent on α4 integrin. Brain 2011;134:3560–3577. [DOI] [PMC free article] [PubMed] [Google Scholar]
- 29.Wherry EJ, Teichgräber V, Becker TC, et al. . Lineage relationship and protective immunity of memory CD8 T cell subsets. Nat Immunol 2003;4:225–234. [DOI] [PubMed] [Google Scholar]
- 30.Annunziato F, Cosmi L, Santarlasci V, et al. . Phenotypic and functional features of human Th17 cells. J Exp Med 2007;204:1849–1861. [DOI] [PMC free article] [PubMed] [Google Scholar]
- 31.Goverman J. Autoimmune T cell responses in the central nervous system. Nat Rev Immunol 2009;9:393–407. [DOI] [PMC free article] [PubMed] [Google Scholar]
- 32.Sree Latha T, Reddy MC, Durbaka PVR, et al. . Gamma delta T cell-mediated immune responses in disease and therapy. Front Immunol 2014;5:571. [DOI] [PMC free article] [PubMed] [Google Scholar]
- 33.Imai T, Baba M, Nishimura M, et al. . The T cell-directed CC chemokine TARC is a highly specific biological ligand for CC chemokine receptor 4. J Biol Chem 1997;272:15036–15042. [DOI] [PubMed] [Google Scholar]
- 34.Acosta-Rodriguez EV, Rivino L, Geginat J, et al. . Surface phenotype and antigenic specificity of human interleukin 17-producing T helper memory cells. Nat Immunol 2007;8:639–646. [DOI] [PubMed] [Google Scholar]
- 35.Butti E, Bergami A, Recchia A, et al. . IL4 gene delivery to the CNS recruits regulatory T cells and induces clinical recovery in mouse models of multiple sclerosis. Gene Ther 2008;15:504–515. [DOI] [PubMed] [Google Scholar]
- 36.Komatsu-Fujii T, Kaneko S, Chinuki Y, et al. . Serum TARC levels are strongly correlated with blood eosinophil count in patients with drug eruptions. Allergol Int 2017;66:116–122. [DOI] [PubMed] [Google Scholar]
- 37.Kim TJ, Upadhyay V, Kumar V, et al. . Innate lymphoid cells facilitate NK cell development through a lymphotoxin-mediated stromal microenvironment. J Exp Med 2014;211:1421–1431. [DOI] [PMC free article] [PubMed] [Google Scholar]
- 38.Kallaur AP, Oliveira SR, Simao ANC, et al. . Tumor necrosis factor beta NcoI polymorphism is associated with inflammatory and metabolic markers in multiple sclerosis patients. J Neurol Sci 2014;346:156–163. [DOI] [PubMed] [Google Scholar]
- 39.Veiga-Parga T, Giménez F, Mulik S, et al. . Controlling herpetic stromal keratitis by modulating lymphotoxin-alpha-mediated inflammatory pathways. Microbes Infect 2013;15:677–687. [DOI] [PMC free article] [PubMed] [Google Scholar]