

Abstract
Objective
Pseudoaneurysms remain a significant complication after vascular procedures. We hypothesized that transforming growth factor-β (TGFβ) signaling plays a mechanistic role in the development of pseudoaneurysms.
Approach and Results
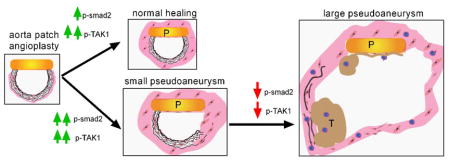
Aortic pericardial patch angioplasty was associated with a high incidence (88%) of pseudoaneurysms at 30 days, with increased smad2 phosphorylation in small pseudoaneurysms but not large pseudoaneurysms; TGFβ1 receptors were increased in small pseudoaneurysms and preserved in large pseudoaneurysms. Delivery of TGFβ1 via nanoparticles covalently bonded to the patch stimulated smad2 phosphorylation both in vitro and in vivo, and significantly decreased pseudoaneurysm formation (6.7%). Inhibition of TGFβ1 signaling with SB431542 decreased smad2 phosphorylation both in vitro and in vivo, and significantly induced pseudoaneurysm formation by day 7 (66.7%).
Conclusion
Normal healing after aortic patch angioplasty is associated with increased TGFβ1 signaling, and recruitment of smad2-signaling may limit pseudoaneurysm formation; loss of TGFβ1 signaling is associated with formation of large pseudoaneurysms. Enhancement of TGFβ1 signaling may be a potential mechanism to limit pseudoaneurysm formation after vascular intervention.
Keywords: TGFβ1, Pseudoaneurysm, Patch angioplasty, Nanoparticle, Elastin, Smad2, Tak1, Rat
Subject codes: Animal Model of Human Disease, Basic Science Research, Vascular Biology
Graphic Abstract
Introduction
Aneurysms are categorized as either “true” aneurysms or “false” aneurysms, with false aneurysms typically known as “pseudoaneurysms” based on their appearance on imaging. Whereas most true aneurysms are the generally the result of inflammation with consequent destruction of all three layers of the vessel wall, a pseudoaneurysm is a typically the result of vessel trauma, with a focal wall disruption and localized extravasation of blood that is contained by surrounding tissue. Although a pseudoaneurysm can be an acute complication of vascular catheterization including injection from drug abuse,1, 2 pseudoaneurysms are also complications that appear after long term vascular device implantation,3, 4 including after the common use of prosthetic and biological patch angioplasty to close arteriotomies such as after carotid or femoral endarterectomy.5,6,7 Anastomotic pseudoaneurysms are likely to be inherent to the surgical technique of using sutures to close vessels, with the first case reported not long after an early description of the technique of aortic graft implantation in 1956.8 Although the incidence of anastomotic pseudoaneurysms is low, the prevalence of these pseudoaneurysms has increased as a result of the increase of vascular procedures.9 The incidence of anastomotic pseudoaneurysms after aortic surgery is approximately 1–5% and after carotid endarterectomy is approximately 0.3%.6,10 Surgical repair of pseudoaneurysms are frequently associated with high rates of morbidity and mortality, especially in the aorta and the carotid arteries.
We recently described a rat model of aortic patch angioplasty, implanting an acellular bovine pericardial patch into the infrarenal aorta, that is associated with a high frequency of pseudoaneurysm formation; all arteries showed some degree of degeneration and pseudoaneurysm formation by day 30.11 Since TGFβ regulates fibrosis and plays a role in true aneurysm formation,12–14 we hypothesized that TGFβ may be active after patch angioplasty and thus might be a mechanism that regulates the pathogenesis of pseudoaneurysms.
Materials and Methods
Materials and Methods are available in the online-only Data Supplement.
Results
Pseudoaneurysm formation after aortic patch angioplasty
We used a rat model of pericardial patch angioplasty to assess pseudoaneurysm formation in the infrarenal aorta.15, 16 Only 12% (2/17) of the patches healed normally without pseudoaneurysm formation, whereas 88% (15/17) of the patches healed with aortic dilation and pseudoaneurysm formation (Figure 1A, 1B, 1C). A neointima formed on the luminal side of the implanted patch in both the normal healing group as well as in the group that developed pseudoaneurysms; intraluminal mural thrombus was characteristically formed in the group that developed into large pseudoaneurysms (Figure 1B). The lumen area varied widely among pseudoaneurysms (Figure 1C). Microscopic evaluation of the normal aorta and normal healing groups showed elastin fibers that were continuous without breaks, whereas in the small and large pseudoaneurysms the elastin fibers were discontinuous and broken in the residual aortic wall, especially in the large pseudoaneurysms (Figure 1D, 1E); however, both small and large pseudoaneurysms had little elastin in the pseudoaneurysm wall. Large pseudoaneurysms also had larger thrombus area, fewer smooth muscle cells, greater numbers of CD68+ cells, CD45+ cells and CD3+ cells, and less collagen deposition in the pseudoaneurysm wall compared to small pseudoaneurysms (Figure 1E, 1F; Supplementary figure 1A, 1B). The greater number of CD68+ cells in large pseudoaneurysms were CD68- and iNOS- dual-positive cells, as well as CD68- and TNF-α-dual-positive cells, consistent with M1 phenotype macrophages; there were similar numbers of CD68- and TGM2- dual-positive cells as well as CD68- and IL10- dual-positive cells (Supplementary figure 2A, 2B). Interestingly, there was increased proliferation and apoptosis in small pseudoaneurysms compared to normally healing arteries, but large pseudoaneurysms showed diminished proliferation and apoptosis, in both the wall and the patch neointima (Figure 1F, Supplementary figure 1A, 1C, 1D).
Figure 1. Pseudoaneurysm formation after rat aortic pericardial patch angioplasty.

A) Representative photographs of macroscopic features of pseudoaneurysms after rat aorta patch angioplasty at day 30; ruler marker, 1mm. B) Verhoeff–Van Gieson (VVG) staining of rat native aorta, patch angioplasty with normal healing and without pseudoaneurysm formation, small pseudoaneurysm formation and large pseudoaneurysm formation at day 30; P, pericardial patch; scale bar, 1mm. C) Heat map of the luminal area distribution after 17 rat aorta patch angioplasties (ratio, normalized to native aorta). Aorta, n=3; normal healing, n=2; small pseudoaneurysm, n=5; large pseudoaneurysm, n=10. D) Photomicrographs of the aorta, day 30 after patch angioplasty. First row, VVG staining of the residual aortic wall; second row, immunohistochemistry of the normally healing aortic wall or pseudoaneurysm wall stained for α-actin; third row, immunohistochemistry stained for CD68; fourth row, immunohistochemistry stained for CD45; fifth row, immunohistochemistry stained for CD3; arrow shows elastin breaks or positive cells; dashed line shows the demarcation of the media and adventitia; scale bar, 100 μm; L, lumen. E) Bar graphs showing elastin breaks per high power field (p=0.0004, ANOVA; *, p=0.005, vs. small; Tukey’s multiple comparisons test). Thrombus area (p=0.0247, ANOVA; *, p=0.0394, vs. small; Tukey’s multiple comparisons test). α-actin positive cell density (p=0.0004, ANOVA; *, p<0.003, vs. normal and small; Tukey’s multiple comparisons test). Number of CD68 positive cells (p=0.0001, ANOVA; *, p=0.0006, vs. small; Tukey’s multiple comparisons test). Number of CD45 positive cells (p=0.001, ANOVA; *, p=0.0022, vs. small; Tukey’s multiple comparisons test). Number of CD3 positive cells (p<0.0001, ANOVA; *, p=0.0001, vs. small; Tukey’s multiple comparisons test). Proliferation index in the pseudoaneurysm wall (p<0.0001, ANOVA; *, p<0.0001, vs. normal; **, p<0.0001, vs. normal and small; Tukey’s multiple comparisons test). Apoptosis index in the pseudoaneurysm wall (p=0.0001, ANOVA; *, p=0.0003, vs. normal; **, p=0.0003, vs. small; Tukey’s multiple comparisons test). n=2–5.
TGFβ1 signaling in pseudoaneurysms
Since pseudoaneurysms in this model have histological features similar to aneurysms, such as reduced collagen deposition and increased elastin disruption in the residual aortic wall as well as increased M1 macrophage infiltration (Figure 1, Supplementary Figures 1–2), and TGFβ1 signaling is associated with aneurysm formation,17 we determined whether TGFβ1 signaling is present during pseudoaneurysm formation.
There was greater TGFβ1 expression in the wall of small pseudoaneurysms compared to normally healing aorta, but diminished TGFβ1 expression in large pseudoaneurysms compared to small ones (Figure 2A, 2B); TGFβ receptor 1 (TGFβR1) expression was similarly increased in pseudoaneurysms with maximal expression in small pseudoaneurysms (Figure 2A, 2C). Immunofluorescence confirmed the presence of TGFβ1- or TGFβR1-positive cells in the walls of small pseudoaneurysms (Figure 2D–F). Thus, small pseudoaneurysms were associated with increased TGFβ expression and high cell turnover and increased proliferation, whereas large pseudoaneurysms were associated with decreased TGFβ expression and low cell turnover and decreased proliferation (Supplementary Figure 1C, 1D). Similarly, smad2 signaling was increased in small pseudoaneurysms (Figure 2G). Interestingly, TAK1 signaling was increased in both normally healing aortae as well as small pseudoaneurysms, but decreased in large pseudoaneurysms (Figure 2H). Immunofluorescence confirmed the increased smad2 signaling in small pseudoaneurysms, colocalized to vWF-, α-actin- and CD68-positive cells (Figure 2I–L; Supplementary Figure 3); similarly, TAK1 was present in vWF-positive cells of normally healing aortae and small pseudoaneurysms (Figure 2I, 2M; Supplementary Figure 3). This data suggests that TGFβ1 signaling is active after aortic patch angioplasty, with predominantly tak- signaling during normally healing and smad- signaling also present during formation of small pseudoaneurysms.
Figure 2. TGFβ pathway signaling during pseudoaneurysm formation.

A) Immunoblot of TGFβ1 and TGFβ receptor 1 (TGFβR1) in the native aorta, normal healing without pseudoaneurysm, small pseudoaneurysms and large pseudoaneurysms. n=3. B) Bar graph shows the ratio TGFβ1: GAPDH (p=0.0096, ANOVA; *, p<0.02, vs. aorta, normal and large; Tukey’s multiple comparisons test) n=3. C) Bar graph shows the ratio TGFβR1:GAPDH (p=0.0004, ANOVA; *, p<0.02, vs. aorta, normal; **, p=0.0132, vs. small; Tukey’s multiple comparisons test); n=3. D) Immunofluorescence showing TGFβ1 (green) and DAPI (blue); merged pictures of TGFβR1 (red) and DAPI (blue) in aortae and tissue with normal healing, small and large pseudoaneurysms; scale bar, 100 μm; n=2–5. E) Bar graph shows density of TGFβ1 (p<0.0001, ANOVA; *, p<0.0001, vs. normal and small; **, p<0.0001, vs. small; Tukey’s multiple comparisons test). F) Bar graph showing number of TGFBR1 positive cells in the vessel wall (p<0.0001, ANOVA; *, p<0.0001, vs. normal and small; **, p<0.0001, vs. small; Tukey’s multiple comparisons test); n=2–5. G) Immunoblot of phosphorylated and total smad2 in the native aorta, normal healing without pseudoaneurysm, small pseudoaneurysms and large pseudoaneurysms. Bar graph shows the ratio of phospho:total smad2 (p<0.0001, ANOVA; *, p<0.0001, vs. aorta and normal; **, p<0.0001, vs. small; Tukey’s multiple comparisons test) n=3. H) Immunoblot of phosphorylated and total TAK1 in the native aorta, normal healing without pseudoaneurysm, small pseudoaneurysms and large pseudoaneurysms. Bar graph showing the ratio of phospho:total TAK1 (p<0.0001, ANOVA; *, p<0.0025, vs. aorta; **, p=0.006, vs. normal and small, Tukey’s multiple comparisons test) n=3. I) Merged immunofluorescence of the vessel wall in aorta, normal healing without pseudoaneurysm, small pseudoaneurysms and large pseudoaneurysms, day 30. First row, merge of vWF (green), p-Smad2 (red) and DAPI (blue); second row, merge of α-actin (green), p-Smad2 (red) and DAPI (blue); third row, merge of CD68 (green), p-Smad2 (red) and DAPI (blue); forth row, merge of vWF (green), TAK1 (red) and DAPI (blue); yellow arrows show dual positive cells; scale bar, 100 μm. n=2–5. J) Bar graph showing vWF and p-Smad2 dual positive cells in the aorta wall (p=0.004, ANOVA; *, p=0.0036, vs. normal; **, p=0.0009, vs. small; Tukey’s multiple comparisons test); n=2–5. K) Bar graph showing α-actin and p-smad2 dual positive cells in the wall (p<0.0001, ANOVA; *, p<0.0001, vs. normal; **, p<0.0001, vs. small; Tukey’s multiple comparisons test); n=2–5. L) Bar graph showing CD68 and p-smad2 dual positive cells in the wall (p<0.0001, ANOVA; *, p<0.0001, vs. normal; p<0.0001, vs. small; Tukey’s multiple comparisons test); n=2–5. M) Bar graph showing vWF and TAK1 dual positive cells in the aorta wall (p<0.0001, ANOVA; *, p<0.0001, vs. aorta; **, p<0.0001, vs. normal and small; Tukey’s multiple comparisons test); n=2–5.
TGFβ1 inhibits pseudoaneurysm formation
Since our data suggests that development of large pseudoaneurysms is associated with reduced TGFβ1 signaling (Figure 2), but the TGFβR1 is still detectable in the aortic wall (Figure 2A–F), we hypothesized that activation of TGFβR1 might prevent development of large pseudoaneurysms after patch angioplasty. We previously showed that nanoparticles covalently bonded to pericardial patches can deliver therapeutic agents to the adjacent vena cava.18 We confirmed that this strategy could similarly deliver drugs to the aorta after aortic patch angioplasty. Nanoparticles containing rhodamine were bonded to patches and used for aortic patch angioplasty; as expected, rhodamine was delivered to the aortic wall, with increased delivery over 24 hours (Supplementary figure 4).
Nanoparticles were then loaded with TGFβ1 (NP-TGFβ1) and covalently bonded to pericardial patches; cumulative release of TGFβ1 from the patch in vitro was sustained for at least 5 days and then slowly decreased until 21 days (Figure 3A). NP-TGFβ1 induced phosphorylation of smad2 in endothelial cells in vitro, similar to native TGFβ1 (Figure 3B). Patches covalently bonded with control nanoparticles (NP-control), without any TGFβ1, showed similar rates (83%) of pseudoaneurysm formation as patches without any nanoparticles (Figure 3C–E); however, patches bonded with TGFβ1-releasing nanoparticles showed significantly reduced pseudoaneurysm formation (1/15; 7%; p=0.0161) (Figure 3C–E). Aortae treated with TGFβ1 showed minimal breaks in elastin, increased α-actin deposition, increased collagen immunoreactivity, fewer CD68-positive cells, fewer CD45-positive cells, and fewer CD3-positive cells compared to control-treated aortae (Figure 3F–L). In addition, aortae treated with TGFβ1 showed reduced numbers of CD68- and iNOS- dual positive cells, as well as reduced numbers of CD68- and TNFα-dual positive cells, without any change in the numbers of CD68- and TGM2- dual positive cells or CD68-and IL10- dual positive cells (Figure 4A, 4B). At 30 days there were similar rates of proliferation and apoptosis in control and TGFβ1-treated aortae (Supplementary Figure 5). Although Western blot of the whole vessel wall was unable to detect increased TGFβ1 in the aortae treated with TGFβ1, immunofluorescence showed significantly increased TGFβ1 (Figure 5A–B); delivery of TGFβ1 increased expression of TGFβR1 (Figure 5A–B; Supplementary Figure 6) as well as increased phosphorylation of both smad2 and Tak1 (Figure 5C–F; Supplementary Figure 6). These data suggest that delivery of TGFβ1 to the aortic wall after patch angioplasty prevents development of pseudoaneurysm formation.
Figure 3. Delivery of TGFβ1 decreases pseudoaneurysm formation.

A) In vitro elution curve showing TGFβ1 release from NP-TGFβ1 over 21 days. B) Immunoblot of phosphorylated and total smad2 in endothelial cells treated with control, NP-TGFβ1 and TGFβ1; n=3. Bar graph shows the ratio of phospho:total smad2 (p<0.0001, ANOVA; *, p<0.0001, vs. control; Tukey’s multiple comparisons test). C) Verhoeff–Van Gieson (VVG) staining after aortic patch angioplasty (day 30) using patches treated with control, NP-control or NP-TGFβ1; P, pericardial patch; scale bar, 1 mm; n=6–15. D) Heat map of the luminal area distribution (ratio, normalized to native aorta) after aortic patch angioplasty (day 30) using patches treated with control, NP-control or NP-TGFβ1. E) Bar graph showing pseudoaneurysm formation in control, NP-control and NP-TGFβ1 patches, day 30.*, p=0.0161, Chi-square. F) VVG staining of the residual aortic wall and immunohistochemistry showing the pseudoaneurysm or aorta wall of the NP-control and NP-TGFβ1 patches, day 30; first column, EVG staining; second column, immunohistochemistry stained for α-actin; third column, immunohistochemistry stained for collagen; fourth column, immunohistochemistry stained for CD68; fifth column, immunohistochemistry stained for CD45; sixth column, immunohistochemistry stained for CD3; dashed line shows the demarcation of the media and adventitia; scale bar, 100 μm; n=4–15. G) Bar graph showing number of elastin breaks per high power field in control, NP-control and NP-TGFβ1 patches, day 30 (p=0.0005, ANOVA; *, p<0.001, Tukey’s multiple comparisons test); n=4–6. H) Bar graph showing α-actin positive cell density; p=0.0004, ANOVA; *, p<0.0008, Tukey’s multiple comparisons test; n=4–6. I) Bar graph showing collagen density (p<0.0001, ANOVA; *, p<0.0001, Tukey’s multiple comparisons test); n=4–6. J) Bar graph showing numbers of CD68 positive cells (p=0.0002, ANOVA; *, p<0.001, Tukey’s multiple comparisons test); n=4–6. K) Bar graph showing the CD45 positive cells (p=0.0059, ANOVA; *, p=0.0096, Tukey’s multiple comparisons test); n=4–6. L) Bar graph showing the CD3 positive cells (p<0.0001, ANOVA; *, p=0.0001, Tukey’s multiple comparisons test); n=4–6.
Figure 4. Delivery of TGFβ1 diminishes M1 type macrophages.

A) Immunofluorescence analysis of the vessel wall and patch neointima after rat aorta patch angioplasty, day 30; upper row, NP-control; lower row, NP-TGFβ1. Merge of CD68 (green), iNOS (red) and DAPI (blue); CD68 (green), TNFα (red) and DAPI (blue); merge of CD68 (green), TGM2 (red) and DAPI (blue); merge of CD68 (green), IL10 (red) and DAPI (blue); N, patch neointima; L, lumen; yellow arrows showing the dual positive cells; scale bar, 100 μm; n=3. B) Bar graphs showing CD68 and iNOS dual positive cells in the vessel wall (*, p=0.0005; t-test) and patch neointima (*, p=0.0024; t-test); CD68 and TNFα dual positive cells in the vessel wall (*, p=0.0019; t-test) and patch neointima (*, p=0.0104; t-test); CD68 and TGM2 dual positive cells in the vessel wall (*, p=0.0257; t-test) and patch neointima (*, p=0.0161; t-test); CD68 and IL10 dual positive cells in the vessel wall (p=0.3739; t-test) and patch neointima (p=0.3739; t-test); n=3.
Figure 5. Delivery of TGFβ1 increases Smad2 and TAK1 phosphorylation in vivo.

A) Immunoblot of TGFβ1 and TGFβR1 in the NP-control and NP-TGFβ1 patches. n=3. Bar graphs show the ratio of TGFβ1 (p=0.1679, t-test) or TGFβR1 (p=0.0114, t-test) to GAPDH; n=3. B) Immunofluorescence of NP-control and NP-TGFβ1 patches showing TGFβ1 (green) and DAPI (blue); merged pictures of TGFβR1 (red) and DAPI (blue) in tissue in the NP-control and NP-TGFβ1 patches; scale bar, 100 μm; yellow arrows showing the positive cells. n=3. Bar graphs show density of TGFβ1 (*, p<0.0001, t-test); TGFβR1 positive cells (*, p=0.0002, t-test); n=3. C) Immunoblot of phosphorylated and total smad2 after aorta patch angioplasty using NP-control or NP-TGFβ1 patches, day 30; n=3. Bar graph shows the ratio of phospho:total smad2 (*, p<0.0001, t-test); n=3. D) Immunoblot of phosphorylated and total TAK1 after aorta patch angioplasty using NP-control or NP-TGFβ1 patches, day 30; n=3. Bar graph showing the ratio of phospho:total TAK1 (*, p=0.0087, t-test); n=3. E) Immunofluorescence showing the vessel wall after aorta patch angioplasty using NP-control or NP-TGFβ1 patches, day 30; First column, merge of vWF (green), p-Smad2 (red) and DAPI (blue); second column, merge of α-actin (green), p-Smad2 (red) and DAPI (blue); third column, merge of CD68 (green), p-Smad2 (red) and DAPI (blue); fourth column, merge of vWF (green), TAK1 (red) and DAPI (blue); L, lumen; yellow arrows show dual positive cells; scale bar, 100 μm; n=3. F) Bar graphs showing vWF-pSmad2 dual positive cells in the wall (*, p=0.0002, t-test); α-actin positive cells in the wall (*, p=0.0002, t-test); α-actin-pSmad2 dual positive cells in the wall (*, p=0.0127, t-test); CD68 positive cells in the wall (*, p=0.0008, t-test); CD68-pSmad2 dual positive cells in the wall ( p>0.9, t-test); vWF-TAK1 dual positive cells (*, p<0.0001, t-test).
Inhibition of TGFβ signaling stimulates pseudoaneurysm formation
Since increased TGFβ signaling is associated with reduced development of pseudoaneurysms (Figures 3, 4), we hypothesized that reduced TGFβ signaling will be associated with increased pseudoaneurysm formation. We encapsulated SB431542, a specific inhibitor of TGFβ type I receptor signaling,19 into nanoparticles (NP-SB431542); endothelial cells stimulated with TGFβ1 showed reduced smad2 phosphorylation in vitro with NP-SB431542 compared to NP-control (Figure 6A).
Figure 6. Reduced TGFβ1 signaling increases pseudoaneurysm formation.

A) Immunoblot of phosphorylated and total smad2 in endothelial cells treated with TGFβ1 (5μmol/ml) as well as NP-control or NP-SB431542 (5 μmol/ml). Bar graph shows the ratio of phospho:total smad2 (*, p=0.0061, t-test); n=3. B) Verhoeff–Van Gieson (VVG) staining after aortic patch angioplasty (day 7) using patches treated with control, NP-control, NP-SB431542, or NP-TGFβ1; P, pericardial patch; L, lumen; scale bar, 1 mm; n=6. C) Heat map of the aorta luminal area after patch angioplasty using control, NP-control, NP-SB431542 and NP-TGFβ1 patches (day 7). D) Bar graph showing the pseudoaneurysm rate at day 7 (*, p=0.0196, Chi-square); n=6. E) Bar graph showing the elastin breaks of the residual aortic wall (p<0.0001, ANOVA; *, p<0.0004, vs. control, NP-control and NP-TGFβ1 patches; Tukey’s multiple comparisons test). F) Bar graph showing the α-actin density (p=0.0175, ANOVA; *, p<0.047, vs. control, NP-control and NP-TGFβ1 patches; Tukey’s multiple comparisons test). G) Bar graph showing the collagen density (p=0.0016, ANOVA; *, p<0.0035, vs. control, NP-control and NP-TGFβ1 patches; Tukey’s multiple comparisons test). n=3. H) Bar graph showing the PCNA positive cells (p<0.0001, ANOVA; *, p<0.0001, vs. control, NP-SB431542 and NP-TGFβ1 patches; Tukey’s multiple comparisons test). n=3. I) Bar graph showing the cleaved caspase-3 positive cells (p<0.0001, ANOVA; *, p<0.0001, vs. control, NP-SB431542 and NP-TGFβ1 patches; Tukey’s multiple comparisons test); n=3. J) Bar graph showing CD68 and iNOS dual positive cells (p=0.0002, ANOVA; *, p<0.0004, Tukey’s multiple comparisons test), n=3. K) Bar graph showing CD68 and TNFα dual positive cells (p<0.0001, ANOVA; *, p<0.0001, Tukey’s multiple comparisons test); n=3. L) Bar graph showing CD68 and TGM2 dual positive cells (p=0.4411, ANOVA); n=3. M) Bar graph showing CD68 and IL10 dual positive cells (p=0.4411, ANOVA); n=3. N) Bar graph showing TGFβ1 density in control, NP-control, NP-SB431542 and NP-TGFβ1 patches, day 7 (p<0.0001, ANOVA; *, p<0.035, vs. control, NP-control, NP-SB431542 patch; Tukey’s multiple comparisons test); n=3. O) Bar graph showing number of TGFBR1 positive cells in control, NP-control, NP-SB431542 and NP-TGFβ1 patches, day 7 (p<0.0001, ANOVA; *, p<0.001, vs. control, NP-control patches; **, p<0.0001, VS. control, NP-control, NP-SB431542 patches; Tukey’s multiple comparisons test); n=3. P) Bar graph showing number of p-smad2 positive cells in control, NP-control, NP-SB431542 and NP-TGFβ1 patches, day 7 (p<0.0001, ANOVA; *, p<0.035, vs. control, NP-control patches; **, p<0.0001, VS. control, NP-control patches; Tukey’s multiple comparisons test), n=3. Q) Bar graph showing number of vWF and TAK1 dual positive cells in control, NP-control, NP-SB431542 and NP-TGFβ1 patches, day 7 (p<0.0001, ANOVA; *, p<0.0002, vs. NP-SB431542 patches; **, p<0.0004, VS. control, NP-control patches; Tukey’s multiple comparisons test), n=3.
NP-SB431542 was covalently bonded to pericardial patches and used for aortic patch angioplasty. At 7 days, there were no pseudoaneurysms detectable in the control, NP-control, or NP-TGFβ1 groups, but more than half of the aortae developed pseudoaneurysms with NP-SB431542 patches (p=0.0196, Figure 6B–D). In aortae treated with SB431542 there were increased numbers of elastin fiber breaks and reduced α-actin and collagen density, as well as increased proliferation and apoptosis, e.g. cell turnover, in the aortic wall (Figure 6E–I; Supplementary Figure 7). Patch angioplasty with NP-SB431542 was also associated with increased numbers of CD68- and iNOS-dual positive cells and CD68- and TNFα-dual positive cells, e.g. M1-type macrophages, but similar numbers of CD68- and TGM2-dual positive cells and CD68- and IL10-dual positive cells (Figure 6J–M; Supplementary Figure 8). As expected, there was less TGFβ1 and TGFβR1 immunoreactivity in the aortae treated with SB431542 but increased TGFβ1 and TGFβR1 immunoreactivity with TGFβ1 treatment (Figure 6N, 6O; Supplementary Figure 7). Similarly, there were fewer phosphorylated-smad2-positive cells and fewer Tak1-positive cells in the aortae treated with SB431542 but increased phosphorylated-smad2-positive cells and Tak1-positive cells with TGFβ1 treatment (Figure 6P, 6Q; Supplementary Figure 7). These results suggest that reduced TGFβ signaling after pericardial patch angioplasty is associated with increased pseudoaneurysms, consistent with a role for TGFβ signaling in modulating pseudoaneurysm formation.
Discussion
We show that pericardial patch angioplasty in the rat aorta reliably induces pseudoaneurysms (88%) that have histological features of human pseudoaneurysms and true aneurysms (Figure 1). Successful healing of the surgical site is characterized by Tak1 phosphorylation and small pseudoaneurysms are characterized by smad2 phosphorylation, whereas degeneration to large pseudoaneurysms is characterized by reduced TGFβ signaling (Figure 2; Supplementary Figure 9). Stimulation of TGFβ1 signaling decreases pseudoaneurysm formation (Figure 3), whereas inhibiting TGFβ signaling increases pseudoaneurysm formation (Figure 6). These results show that the TGFβ signaling pathway is a mechanism of pseudoaneurysm formation and suggest that modulation of this pathway may be a promising therapeutic strategy to prevent long term complications of vascular interventions.
Pseudoaneurysm formation in humans is not rare after vascular surgery; although pseudoaneurysms are less common in modern practice compared with earlier decades, pseudoaneurysms continue to present as a late complication in 1% to 5% of cases.20, 10 Although there are several animal models of true aneurysms, there has been no small animal model of pseudoaneurysm reported that reliably recapitulates human pseudoaneurysms; a rabbit model of traumatic pseudoaneurysm,21, 21 as well as pig models of arteriovenous graft and femoral pseudoaneurysm,22, 23 have been reported. Our small animal model of pseudoaneurysms is easily created with basic microsurgical skills and reliably creates pseudoaneurysms (Figure 1); since patch angioplasty is used clinically to prevent restenosis, it is not surprising that we also did not detect any restenosis in this model. In addition, the presence of disorganized extracellular matrix and macrophages mimics findings of human pseudoaneurysms.24 There are several animal models of true aneurysms, including Ang II infusion,25 periarterial calcium chloride,26, 27 pancreatic elastase infusion,26 as well as genetic mouse models of aneurysms.28 These models show characteristic wall destruction including elastin fiber disruption, collagen disorganization, and inflammatory cell infiltration.29, 30,31,32,33,34,35 Since our model of pseudoaneurysm shows some of these histological features, it may have applicability to aneurysm studies as well. However, we only performed this model in male rats. Female rats have smaller vessels than male rats, and we do not know whether these diameter differences will affect the development of pseudoaneurysms in this model; similarly there are sex differences in both human aneurysms,36, 37 as well as experimental models.38
Traditional risk factors for aneurysm formation include hypertension, smoking and other atherosclerotic risk factors.39,40,41 Recent studies have implicated the TGFβ signaling pathway in the pathogenesis of several genetic aneurysm syndromes.42,14, 28,43,44 In a mouse model, reduced TGFβ activity enhances aneurysm formation and rupture;45 overexpression of TGFβ limits plaque growth and prevents aortic dilation in apolipoprotein E-null mice.46 Similarly, in a rat abdominal aortic aneurysm model, increased TGFβ1 stabilized aortic dilation.47,48,49 TGFβ receptor (TGFBR1 and TGFBR2) mutations promote aortic aneurysm formation, both in mice and humans.50,51,52, 53, 54 Smad2 mediates TGFβ receptor signaling and mutations in smad2 are associated with human artery aneurysm formation and dissections.55,56 As such it is not surprising that the TGFβ signaling pathway is active during pseudoaneurysm formation. Our findings that both the smad- as well as the tak- pathways appear to be active in aortic healing of patch angioplasty (Figure 2) suggest that these pathways are compensatory for surgical injury, and that loss of these pathways is associated with degeneration to large pseudoaneurysms (Figure 2; Supplementary Figure 9). Since expression of the TGFβ receptor is present, it is not surprising that activation of the receptor prevents development of pseudoaneurysms (Figure 3); however, since both smad- and tak- signaling is stimulated (Figure 5), it is not clear which pathway is predominant or critical. In addition, the disorganized structure of the pseudoaneurysm walls may lead to unusual patterns of expression and localization of these pathways compared to those present in normal vessel walls. However the role of the tak- pathway is not clear; TAK1-null mice die at embryonic day 11.5 with significant vascular defects.57 Nonetheless, TGFβ plays an important role during healing of surgical wounds, typically increasing collagen deposition as well as promoting accumulation of protein and DNA. 58–60 Thus the decreased incidence of pseudoaneurysms in TGF-β-treated patches may be a result of increased tensile strength secondary to increased collagen synthesis (Figure 3, 6; Supplementary Figure 7).
Macrophages play a role in aneurysm formation, progression and healing.61 Macrophages were primarily present in the adventitia of the normally healing aortae; however, in large pseudoaneurysms that were associated with disordered wall architecture (Figure 1), macrophages could be seen in all layers (Figures 1D, 2I, 3F). M1 macrophages are initially recruited to the site of injury and produce proteases and proinflammatory cytokines, while M2 macrophages produce anti-inflammatory cytokines and extracellular matrix (ECM) components. M1 macrophages are required for formation of murine cerebral aneurysms;62 in humans, M1 macrophages are markedly increased in ruptured aneurysms.63 Conversely, injection of M2-polarized macrophages reduced aortic dilation after aneurysm induction.64 TGFβ signaling can regulate M2 polarization, suggesting one mechanism of aneurysm formation.65, 66 We found increased M1 macrophages in large pseudoaneurysms, but similar numbers of M2 macrophages compared to the normally healing aorta and small pseudoaneurysms (Figure 4; Supplementary Figures 2, 8); increased TGFβ signaling reduced the numbers of these M1 macrophages (Figure 4).67 However, in this model, there were very few M2 macrophages, and thus it is not clear whether prevention of TGFβ-mediated suppression of pseudoaneurysm formation is truly related to reduced M1 or increased M2 type macrophages. Interestingly, some macrophages expressed p-smad2 (Figure 2), delivery of TGFβ1 reduced the number of macrophages in the aorta wall, especially M1 type macrophages (Figures 4, 5E–F), and inhibition of TGFβ1 signaling was associated with increased number of M1 type macrophages (Figure 6J–K), suggesting a complicated relation between TGFβ and macrophages.68,65,69 For example, TGFβ regulates macrophage migration and polarization. 70, 65, 66 This data suggests that the protective effects of TGFβ1 may not be limited to endothelial or smooth muscle cells, and the TGFβ pathway in macrophages may also play a role in the formation of pseudoaneurysms.
In summary, rat aortic pericardial patch angioplasty induces pseudoaneurysms that mimic human patch angioplasty pseudoaneurysms. Normal healing after aortic patch angioplasty is associated with increased TGFβ1 signaling; loss of TGFβ1 signaling is associated with formation of large pseudoaneurysms. These results suggest that enhancement of TGFβ1 signaling may be a potential mechanism to limit pseudoaneurysm formation after vascular intervention.
Supplementary Material
Highlights.
A novel model of small animal pseudoaneurysm formation was established.
TGFβ1 smad- and tak- pathways play a role in prevention of pseudoaneurysm formation after patch angioplasty.
Delivery of TGFβ1 inhibits pseudoaneurysm formation, whereas inhibition of the TGFβ pathway stimulates early pseudoaneurysm formation.
Stimulation of TGFβ1 signaling may be a potential strategy to prevent pseudoaneurysm formation after vascular interventions.
Acknowledgments
Sources of Funding
This work was supported by the National Institutes of Health Grant R01-HL128406 and by the United States Department of Veterans Affairs Biomedical Laboratory Research and Development Program, Merit Review Award I01-BX002336, as well as through the resources and use of facilities at the Veterans Affairs Connecticut Healthcare System (West Haven, CT). XenoSure bovine pericardial patches were generously provided by LeMaitre Vascular Inc. (Burlington, MA).
Nonstandard Abbreviations and Acronyms
- CD
cluster of differentiation
- IL
interleukin
- iNOS
inducible nitric oxide synthase
- NP
nanoparticle
- PCNA
Proliferating cell nuclear antigen
- TAK
TGF-β-Activated Kinase
- TGF
transforming growth factor
- TGM
transglutaminase
- TNF
tumor necrosis factor
Footnotes
Disclosures
None
References
- 1.Webber GW, Jang J, Gustavson S, Olin JW. Contemporary management of postcatheterization pseudoaneurysms. Circulation. 2007;115:2666–2674. doi: 10.1161/CIRCULATIONAHA.106.681973. [DOI] [PubMed] [Google Scholar]
- 2.Klonaris C, Katsargyris A, Papapetrou A, Vourliotakis G, Tsiodras S, Georgopoulos S, Giannopoulos A, Bastounis E. Infected femoral artery pseudoaneurysm in drug addicts: The beneficial use of the internal iliac artery for arterial reconstruction. J Vasc Surg. 2007;45:498–504. doi: 10.1016/j.jvs.2006.11.014. [DOI] [PubMed] [Google Scholar]
- 3.Ryugo M, Yasugi T, Nagashima M, Izutani H, Okamura T, Shikata F, Kawamura M, Kawachi K. Pseudoaneurysm in the left groin due to ruptured knitted dacron graft. Ann Vasc Dis. 2011;4:154–156. doi: 10.3400/avd.cr.10.00018. [DOI] [PMC free article] [PubMed] [Google Scholar]
- 4.Belardi P, Noce R. pseudoaneurysm of the right femoral anastomosis from an aorto-femoral dacron bypass. Removal and reconstruction of the artery. Minerva Chir. 1968;23:1066–1074. [PubMed] [Google Scholar]
- 5.Krishnan S, Clowes AW. Dacron patch infection after carotid endarterectomy: Case report and review of the literature. Ann Vasc Surg. 2006;20:672–677. doi: 10.1007/s10016-006-9064-5. [DOI] [PubMed] [Google Scholar]
- 6.Branch CL, Jr, Davis CH., Jr False aneurysm complicating carotid endarterectomy. Neurosurgery. 1986;19:421–425. doi: 10.1227/00006123-198609000-00014. [DOI] [PubMed] [Google Scholar]
- 7.El-Sabrout R, Reul G, Cooley DA. Infected postcarotid endarterectomy pseudoaneurysms: Retrospective review of a series. Ann Vasc Surg. 2000;14:239–247. doi: 10.1007/s100169910041. [DOI] [PubMed] [Google Scholar]
- 8.Birch L, Cardwell ES, Claytor H, Zimmerman SL. Suture-line rupture of a nylon aortic bifurcation graft into the small bowel. AMA Arch Surg. 1956;73:947–950. doi: 10.1001/archsurg.1956.01280060047010. [DOI] [PubMed] [Google Scholar]
- 9.Briggs RM, Jarstfer BS, Collins GJ., Jr Anastomotic aneurysms. Am J Surg. 1983;146:770–773. doi: 10.1016/0002-9610(83)90338-0. [DOI] [PubMed] [Google Scholar]
- 10.Cronenwett Jack L, Johnston KW. Rutherford’s vascular surgery. 8. Philadelphia, pa: Elsevier; 2014. pp. 682–692. [Google Scholar]
- 11.Bai H, Kuwahara G, Wang M, Brownson KE, Foster TR, Yamamoto K, Xing Y, Dardik A. Pretreatment of pericardial patches with antibiotics does not alter patch healing in vivo. J Vasc Surg. 2016;63:1063–1073. doi: 10.1016/j.jvs.2014.09.067. [DOI] [PMC free article] [PubMed] [Google Scholar]
- 12.Meng XM, Nikolic-Paterson DJ, Lan HY. Tgf-beta: The master regulator of fibrosis. Nat Rev Nephrol. 2016;12:325–338. doi: 10.1038/nrneph.2016.48. [DOI] [PubMed] [Google Scholar]
- 13.Thatcher SE. Tgf-beta signaling: New insights into aortic aneurysms. EBioMedicine. 2016;12:24–25. doi: 10.1016/j.ebiom.2016.09.026. [DOI] [PMC free article] [PubMed] [Google Scholar]
- 14.Loeys BL, Schwarze U, Holm T, et al. Aneurysm syndromes caused by mutations in the tgf-beta receptor. N Engl J Med. 2006;355:788–798. doi: 10.1056/NEJMoa055695. [DOI] [PubMed] [Google Scholar]
- 15.Li X, Jadlowiec C, Guo Y, Protack CD, Ziegler KR, Lv W, Yang C, Shu C, Dardik A. Pericardial patch angioplasty heals via an ephrin-b2 and cd34 positive cell mediated mechanism. PLoS One. 2012;7:e38844. doi: 10.1371/journal.pone.0038844. [DOI] [PMC free article] [PubMed] [Google Scholar]
- 16.Bai H, Li X, Hashimoto T, Hu H, Foster TR, Hanisch JJ, Santana JM, Dardik A. Patch angioplasty in the rat aorta or inferior vena cava. J Vis Exp. 2017 doi: 10.3791/55253. [DOI] [PMC free article] [PubMed] [Google Scholar]
- 17.Angelov SN, Hu JH, Wei H, Airhart N, Shi M, Dichek DA. Tgf-beta (transforming growth factor-beta) signaling protects the thoracic and abdominal aorta from angiotensin ii-induced pathology by distinct mechanisms. Arterioscler Thromb Vasc Biol. 2017 doi: 10.1161/ATVBAHA.117.309401. [DOI] [PMC free article] [PubMed] [Google Scholar]
- 18.Bai H, Lee JS, Chen E, Wang M, Xing Y, Fahmy TM, Dardik A. Covalent modification of pericardial patches for sustained rapamycin delivery inhibits venous neointimal hyperplasia. Sci Rep. 2017;7:40142. doi: 10.1038/srep40142. [DOI] [PMC free article] [PubMed] [Google Scholar]
- 19.Inman GJ, Nicolas FJ, Callahan JF, Harling JD, Gaster LM, Reith AD, Laping NJ, Hill CS. Sb-431542 is a potent and specific inhibitor of transforming growth factor-beta superfamily type i activin receptor-like kinase (alk) receptors alk4, alk5, and alk7. Mol Pharmacol. 2002;62:65–74. doi: 10.1124/mol.62.1.65. [DOI] [PubMed] [Google Scholar]
- 20.del Nido PJ, Williams WG, Wilson GJ, Coles JG, Moes CA, Hosokawa Y, McLaughlin PR, Fowler RS, Izukawa T, Rowe RD, et al. Synthetic patch angioplasty for repair of coarctation of the aorta: Experience with aneurysm formation. Circulation. 1986;74:I32–36. [PubMed] [Google Scholar]
- 21.Zheng YM, Xu Y, Sun Y, Huang J, Yang S, Ke C, Yoa G. Studies on the animal model of traumatic pseudoaneurysm. Microsurgery. 1998;18:349–353. doi: 10.1002/(sici)1098-2752(1998)18:6<349::aid-micr1>3.0.co;2-w. [DOI] [PubMed] [Google Scholar]
- 22.Lin PH, Johnson CK, Pullium JK, Koffron AJ, Conklin B, Terramani TT, Bush R, Chen C, Lumsden AB. Transluminal stent graft repair with wallgraft endoprosthesis in a porcine arteriovenous graft pseudoaneurysm model. J Vasc Surg. 2003;37:175–181. doi: 10.1067/mva.2002.87. [DOI] [PubMed] [Google Scholar]
- 23.Geutjes PJ, van der Vliet JA, Faraj KA, Vries N, van Moerkerk HT, Wismans RG, Hendriks T, Daamen WF, van Kuppevelt TH. An animal model for femoral artery pseudoaneurysms. J Vasc Interv Radiol. 2010;21:1078–1083. doi: 10.1016/j.jvir.2010.01.040. [DOI] [PubMed] [Google Scholar]
- 24.Weber SS, Annenberg AJ, Wright CB, Braverman TS, Mesh CL. Early pseudoaneurysm degeneration in biologic extracellular matrix patch for carotid repair. J Vasc Surg. 2014;59:1116–1118. doi: 10.1016/j.jvs.2013.05.012. [DOI] [PubMed] [Google Scholar]
- 25.Daugherty A, Manning MW, Cassis LA. Angiotensin ii promotes atherosclerotic lesions and aneurysms in apolipoprotein e-deficient mice. J Clin Invest. 2000;105:1605–1612. doi: 10.1172/JCI7818. [DOI] [PMC free article] [PubMed] [Google Scholar]
- 26.Anidjar S, Salzmann JL, Gentric D, Lagneau P, Camilleri JP, Michel JB. Elastase-induced experimental aneurysms in rats. Circulation. 1990;82:973–981. doi: 10.1161/01.cir.82.3.973. [DOI] [PubMed] [Google Scholar]
- 27.Gertz SD, Kurgan A, Eisenberg D. Aneurysm of the rabbit common carotid artery induced by periarterial application of calcium chloride in vivo. J Clin Invest. 1988;81:649–656. doi: 10.1172/JCI113368. [DOI] [PMC free article] [PubMed] [Google Scholar]
- 28.Lindsay ME, Dietz HC. Lessons on the pathogenesis of aneurysm from heritable conditions. Nature. 2011;473:308–316. doi: 10.1038/nature10145. [DOI] [PMC free article] [PubMed] [Google Scholar]
- 29.Kent KC. Clinical practice. Abdominal aortic aneurysms. N Engl J Med. 2014;371:2101–2108. doi: 10.1056/NEJMcp1401430. [DOI] [PubMed] [Google Scholar]
- 30.Cheng J, Koenig SN, Kuivaniemi HS, Garg V, Hans CP. Pharmacological inhibitor of notch signaling stabilizes the progression of small abdominal aortic aneurysm in a mouse model. J Am Heart Assoc. 2014;3:e001064. doi: 10.1161/JAHA.114.001064. [DOI] [PMC free article] [PubMed] [Google Scholar]
- 31.Kanematsu Y, Kanematsu M, Kurihara C, Tsou TL, Nuki Y, Liang EI, Makino H, Hashimoto T. Pharmacologically induced thoracic and abdominal aortic aneurysms in mice. Hypertension. 2010;55:1267–1274. doi: 10.1161/HYPERTENSIONAHA.109.140558. [DOI] [PMC free article] [PubMed] [Google Scholar]
- 32.Leeper NJ, Raiesdana A, Kojima Y, et al. Loss of cdkn2b promotes p53-dependent smooth muscle cell apoptosis and aneurysm formation. Arterioscler Thromb Vasc Biol. 2013;33:e1–e10. doi: 10.1161/ATVBAHA.112.300399. [DOI] [PMC free article] [PubMed] [Google Scholar]
- 33.Wang S, Zhang C, Zhang M, Liang B, Zhu H, Lee J, Viollet B, Xia L, Zhang Y, Zou MH. Activation of amp-activated protein kinase alpha2 by nicotine instigates formation of abdominal aortic aneurysms in mice in vivo. Nat Med. 2012;18:902–910. doi: 10.1038/nm.2711. [DOI] [PMC free article] [PubMed] [Google Scholar]
- 34.Liu S, Xie Z, Daugherty A, Cassis LA, Pearson KJ, Gong MC, Guo Z. Mineralocorticoid receptor agonists induce mouse aortic aneurysm formation and rupture in the presence of high salt. Arterioscler Thromb Vasc Biol. 2013;33:1568–1579. doi: 10.1161/ATVBAHA.112.300820. [DOI] [PMC free article] [PubMed] [Google Scholar]
- 35.Son BK, Sawaki D, Tomida S, Fujita D, Aizawa K, Aoki H, Akishita M, Manabe I, Komuro I, Friedman SL, Nagai R, Suzuki T. Granulocyte macrophage colony-stimulating factor is required for aortic dissection/intramural haematoma. Nat Commun. 2015;6:6994. doi: 10.1038/ncomms7994. [DOI] [PubMed] [Google Scholar]
- 36.Lo RC, Bensley RP, Hamdan AD, Wyers M, Adams JE, Schermerhorn ML Vascular Study Group of New E. Gender differences in abdominal aortic aneurysm presentation, repair, and mortality in the vascular study group of new england. J Vasc Surg. 2013;57:1261–1268. 1268 e1261–1265. doi: 10.1016/j.jvs.2012.11.039. [DOI] [PMC free article] [PubMed] [Google Scholar]
- 37.Stenbaek J, Granath F, Swedenborg J. Outcome after abdominal aortic aneurysm repair. Difference between men and women. Eur J Vasc Endovasc Surg. 2004;28:47–51. doi: 10.1016/j.ejvs.2004.02.013. [DOI] [PubMed] [Google Scholar]
- 38.Ailawadi G, Eliason JL, Roelofs KJ, Sinha I, Hannawa KK, Kaldjian EP, Lu G, Henke PK, Stanley JC, Weiss SJ, Thompson RW, Upchurch GR., Jr Gender differences in experimental aortic aneurysm formation. Arterioscler Thromb Vasc Biol. 2004;24:2116–2122. doi: 10.1161/01.ATV.0000143386.26399.84. [DOI] [PubMed] [Google Scholar]
- 39.Lederle FA, Nelson DB, Joseph AM. Smokers’ relative risk for aortic aneurysm compared with other smoking-related diseases: A systematic review. J Vasc Surg. 2003;38:329–334. doi: 10.1016/s0741-5214(03)00136-8. [DOI] [PubMed] [Google Scholar]
- 40.Lopez-de-Andres A, Jimenez-Trujillo I, Jimenez-Garcia R, Hernandez-Barrera V, de Miguel-Yanes JM, Mendez-Bailon M, Perez-Farinos N, Salinero-Fort MA, Carrasco-Garrido P. National trends in incidence and outcomes of abdominal aortic aneurysm among elderly type 2 diabetic and non-diabetic patients in spain (2003–2012) Cardiovasc Diabetol. 2015;14:48. doi: 10.1186/s12933-015-0216-1. [DOI] [PMC free article] [PubMed] [Google Scholar]
- 41.Takagi H, Umemoto T, Group A. Association of hypertension with abdominal aortic aneurysm expansion. Ann Vasc Surg. 2016 doi: 10.1016/j.avsg.2016.04.019. [DOI] [PubMed]
- 42.Gillis E, Van Laer L, Loeys BL. Genetics of thoracic aortic aneurysm: At the crossroad of transforming growth factor-beta signaling and vascular smooth muscle cell contractility. Circ Res. 2013;113:327–340. doi: 10.1161/CIRCRESAHA.113.300675. [DOI] [PubMed] [Google Scholar]
- 43.Lindsay ME, Schepers D, Bolar NA, et al. Loss-of-function mutations in tgfb2 cause a syndromic presentation of thoracic aortic aneurysm. Nat Genet. 2012;44:922–927. doi: 10.1038/ng.2349. [DOI] [PMC free article] [PubMed] [Google Scholar]
- 44.Bertoli-Avella AM, Gillis E, Morisaki H, et al. Mutations in a tgf-beta ligand, tgfb3, cause syndromic aortic aneurysms and dissections. J Am Coll Cardiol. 2015;65:1324–1336. doi: 10.1016/j.jacc.2015.01.040. [DOI] [PMC free article] [PubMed] [Google Scholar]
- 45.Chen X, Rateri DL, Howatt DA, Balakrishnan A, Moorleghen JJ, Cassis LA, Daugherty A. Tgf-beta neutralization enhances angii-induced aortic rupture and aneurysm in both thoracic and abdominal regions. PLoS One. 2016;11:e0153811. doi: 10.1371/journal.pone.0153811. [DOI] [PMC free article] [PubMed] [Google Scholar]
- 46.Frutkin AD, Otsuka G, Stempien-Otero A, et al. Tgf-[beta]1 limits plaque growth, stabilizes plaque structure, and prevents aortic dilation in apolipoprotein e-null mice. Arterioscler Thromb Vasc Biol. 2009;29:1251–1257. doi: 10.1161/ATVBAHA.109.186593. [DOI] [PMC free article] [PubMed] [Google Scholar]
- 47.Dai J, Losy F, Guinault AM, Pages C, Anegon I, Desgranges P, Becquemin JP, Allaire E. Overexpression of transforming growth factor-beta1 stabilizes already-formed aortic aneurysms: A first approach to induction of functional healing by endovascular gene therapy. Circulation. 2005;112:1008–1015. doi: 10.1161/CIRCULATIONAHA.104.523357. [DOI] [PubMed] [Google Scholar]
- 48.Losy F, Dai J, Pages C, Ginat M, Muscatelli-Groux B, Guinault AM, Rousselle E, Smedile G, Loisance D, Becquemin JP, Allaire E. Paracrine secretion of transforming growth factor-beta1 in aneurysm healing and stabilization with endovascular smooth muscle cell therapy. J Vasc Surg. 2003;37:1301–1309. doi: 10.1016/s0741-5214(02)75336-6. [DOI] [PubMed] [Google Scholar]
- 49.Wang Y, Ait-Oufella H, Herbin O, Bonnin P, Ramkhelawon B, Taleb S, Huang J, Offenstadt G, Combadiere C, Renia L, Johnson JL, Tharaux PL, Tedgui A, Mallat Z. Tgf-beta activity protects against inflammatory aortic aneurysm progression and complications in angiotensin ii-infused mice. J Clin Invest. 2010;120:422–432. doi: 10.1172/JCI38136. [DOI] [PMC free article] [PubMed] [Google Scholar]
- 50.Yang P, Schmit BM, Fu C, DeSart K, Oh SP, Berceli SA, Jiang Z. Smooth muscle cell-specific tgfbr1 deficiency promotes aortic aneurysm formation by stimulating multiple signaling events. Sci Rep. 2016;6:35444. doi: 10.1038/srep35444. [DOI] [PMC free article] [PubMed] [Google Scholar]
- 51.Li W, Li Q, Jiao Y, Qin L, Ali R, Zhou J, Ferruzzi J, Kim RW, Geirsson A, Dietz HC, Offermanns S, Humphrey JD, Tellides G. Tgfbr2 disruption in postnatal smooth muscle impairs aortic wall homeostasis. J Clin Invest. 2014;124:755–767. doi: 10.1172/JCI69942. [DOI] [PMC free article] [PubMed] [Google Scholar]
- 52.Stheneur C, Collod-Beroud G, Faivre L, et al. Identification of 23 tgfbr2 and 6 tgfbr1 gene mutations and genotype-phenotype investigations in 457 patients with marfan syndrome type i and ii, loeys-dietz syndrome and related disorders. Hum Mutat. 2008;29:E284–295. doi: 10.1002/humu.20871. [DOI] [PubMed] [Google Scholar]
- 53.Nakao A, Imamura T, Souchelnytskyi S, Kawabata M, Ishisaki A, Oeda E, Tamaki K, Hanai J, Heldin CH, Miyazono K, ten Dijke P. Tgf-beta receptor-mediated signalling through smad2, smad3 and smad4. EMBO J. 1997;16:5353–5362. doi: 10.1093/emboj/16.17.5353. [DOI] [PMC free article] [PubMed] [Google Scholar]
- 54.Micha D, Guo DC, Hilhorst-Hofstee Y, et al. Smad2 mutations are associated with arterial aneurysms and dissections. Hum Mutat. 2015;36:1145–1149. doi: 10.1002/humu.22854. [DOI] [PubMed] [Google Scholar]
- 55.Loinard C, Basatemur G, Masters L, Baker L, Harrison J, Figg N, Vilar J, Sage AP, Mallat Z. Deletion of chromosome 9p21 noncoding cardiovascular risk interval in mice alters smad2 signaling and promotes vascular aneurysm. Circ Cardiovasc Genet. 2014;7:799–805. doi: 10.1161/CIRCGENETICS.114.000696. [DOI] [PubMed] [Google Scholar]
- 56.Gomez D, Kessler K, Michel JB, Vranckx R. Modifications of chromatin dynamics control smad2 pathway activation in aneurysmal smooth muscle cells. Circ Res. 2013;113:881–890. doi: 10.1161/CIRCRESAHA.113.301989. [DOI] [PubMed] [Google Scholar]
- 57.Jadrich JL, O’Connor MB, Coucouvanis E. The tgf beta activated kinase tak1 regulates vascular development in vivo. Development. 2006;133:1529–1541. doi: 10.1242/dev.02333. [DOI] [PubMed] [Google Scholar]
- 58.Mustoe TA, Pierce GF, Thomason A, Gramates P, Sporn MB, Deuel TF. Accelerated healing of incisional wounds in rats induced by transforming growth factor-beta. Science. 1987;237:1333–1336. doi: 10.1126/science.2442813. [DOI] [PubMed] [Google Scholar]
- 59.Sporn MB, Roberts AB, Shull JH, Smith JM, Ward JM, Sodek J. Polypeptide transforming growth factors isolated from bovine sources and used for wound healing in vivo. Science. 1983;219:1329–1331. doi: 10.1126/science.6572416. [DOI] [PubMed] [Google Scholar]
- 60.Lichtman MK, Otero-Vinas M, Falanga V. Transforming growth factor beta (tgf-beta) isoforms in wound healing and fibrosis. Wound Repair Regen. 2016;24:215–222. doi: 10.1111/wrr.12398. [DOI] [PubMed] [Google Scholar]
- 61.Raffort J, Lareyre F, Clement M, Hassen-Khodja R, Chinetti G, Mallat Z. Monocytes and macrophages in abdominal aortic aneurysm. Nat Rev Cardiol. 2017 doi: 10.1038/nrcardio.2017.52. [DOI] [PubMed] [Google Scholar]
- 62.Nowicki KW, Hosaka K, Walch FJ, Scott EW, Hoh BL. M1 macrophages are required for murine cerebral aneurysm formation. J Neurointerv Surg. 2017 doi: 10.1136/neurintsurg-2016-012911. [DOI] [PMC free article] [PubMed] [Google Scholar]
- 63.Hasan D, Chalouhi N, Jabbour P, Hashimoto T. Macrophage imbalance (m1 vs. M2) and upregulation of mast cells in wall of ruptured human cerebral aneurysms: Preliminary results. J Neuroinflammation. 2012;9:222. doi: 10.1186/1742-2094-9-222. [DOI] [PMC free article] [PubMed] [Google Scholar]
- 64.Dale MA, Xiong W, Carson JS, Suh MK, Karpisek AD, Meisinger TM, Casale GP, Baxter BT. Elastin-derived peptides promote abdominal aortic aneurysm formation by modulating m1/m2 macrophage polarization. J Immunol. 2016;196:4536–4543. doi: 10.4049/jimmunol.1502454. [DOI] [PMC free article] [PubMed] [Google Scholar]
- 65.Gong D, Shi W, Yi SJ, Chen H, Groffen J, Heisterkamp N. Tgfbeta signaling plays a critical role in promoting alternative macrophage activation. BMC Immunol. 2012;13:31. doi: 10.1186/1471-2172-13-31. [DOI] [PMC free article] [PubMed] [Google Scholar]
- 66.Zhang F, Wang H, Wang X, Jiang G, Liu H, Zhang G, Wang H, Fang R, Bu X, Cai S, Du J. Tgf-beta induces m2-like macrophage polarization via snail-mediated suppression of a pro-inflammatory phenotype. Oncotarget. 2016;7:52294–52306. doi: 10.18632/oncotarget.10561. [DOI] [PMC free article] [PubMed] [Google Scholar]
- 67.Werner F, Jain MK, Feinberg MW, Sibinga NE, Pellacani A, Wiesel P, Chin MT, Topper JN, Perrella MA, Lee ME. Transforming growth factor-beta 1 inhibition of macrophage activation is mediated via smad3. J Biol Chem. 2000;275:36653–36658. doi: 10.1074/jbc.M004536200. [DOI] [PubMed] [Google Scholar]
- 68.Sugiyama Y, Kakoi K, Kimura A, Takada I, Kashiwagi I, Wakabayashi Y, Morita R, Nomura M, Yoshimura A. Smad2 and smad3 are redundantly essential for the suppression of inos synthesis in macrophages by regulating irf3 and stat1 pathways. Int Immunol. 2012;24:253–265. doi: 10.1093/intimm/dxr126. [DOI] [PubMed] [Google Scholar]
- 69.Khalil N, Bereznay O, Sporn M, Greenberg AH. Macrophage production of transforming growth factor beta and fibroblast collagen synthesis in chronic pulmonary inflammation. J Exp Med. 1989;170:727–737. doi: 10.1084/jem.170.3.727. [DOI] [PMC free article] [PubMed] [Google Scholar]
- 70.Kim JS, Kim JG, Moon MY, Jeon CY, Won HY, Kim HJ, Jeon YJ, Seo JY, Kim JI, Kim J, Lee JY, Kim PH, Park JB. Transforming growth factor-beta1 regulates macrophage migration via rhoa. Blood. 2006;108:1821–1829. doi: 10.1182/blood-2005-10-009191. [DOI] [PubMed] [Google Scholar]
Associated Data
This section collects any data citations, data availability statements, or supplementary materials included in this article.