

Summary
Adenocarcinoma accounts for more than 40% of lung malignancy, and microscopic pathology evaluation is indispensable for its diagnosis. However, how histopathology findings relate to molecular abnormalities remains largely unknown. Here we obtained hematoxylin and eosin stained whole-slide histopathology images, pathology reports, RNA-sequencing, and proteomics data of 538 lung adenocarcinoma patients from The Cancer Genome Atlas and used these to identify molecular pathways associated with histopathology patterns. We report cell cycle regulation and nucleotide binding pathways underpinning tumor cell dedifferentiation, and we predicted histology grade using transcriptomics and proteomics signatures (area under curve > 0.80). We built an integrative histopathology-transcriptomics model to generate better prognostic predictions for stage I patients (P=0.0182±0.0021) compared with gene expression or histopathology studies alone, and the results were replicated in an independent cohort (P=0.0220±0.0070). These results motivate the integration of histopathology and omics data to investigate molecular mechanisms of pathology findings and enhance clinical prognostic prediction.
Keywords: Machine learning, Cancer genomics, Cancer imaging, Predictive medicine, Non-small-cell lung cancer
The eTOC Blurb
Integrative omics-histopathology analyses identified the gene and protein expression patterns associated with lung adenocarcinoma differentiation. Regularized machine-learning models using both transcriptomics and histopathology information better predicted the survival outcomes of stage I lung adenocarcinoma patients, with the results replicated in an independent cohort.
Introduction
Lung cancer causes more than 1.4 million deaths per year worldwide, and adenocarcinoma is the most common subtype(Jemal et al., 2011; Siegel et al., 2014). For decades, histopathology evaluation has been the definitive diagnostic method for lung cancer(Collins et al., 2007). However, the underlying molecular mechanisms for histological patterns are not fully understood(Gardiner et al., 2014; Zugazagoitia et al., 2014). In addition, whole-slide histopathology image scanning and high-throughput omics technologies generate terabytes of personal tumor profile per patient, but how to integrate these data to advance precision cancer medicine remain to be explored(Yu and Snyder, 2016).
Histopathology morphology has guided the diagnosis of lung cancer and defined subtypes of lung malignancy(Travis et al., 2011). To diagnose lung cancer, pathologists prepare microscopic slides from tissue samples, stain them with hematoxylin and eosin, which non-specifically bind to nuclear acids and proteins, respectively(Fischer et al., 2008). These slides are observed under light microscopy, and the cyto-architectural features define the specific types and subtypes of lung tumors. Studies have shown that certain pathology annotations, such as the level of tumor cell dedifferentiation, are associated with survival outcomes(Harpole et al., 1995). However, this manual evaluation process involves some level of subjectivity(Raab et al., 2005), and it is difficult to integrate these visual findings with terabytes of omics information. Thus, how these visual patterns associated with their underlying biological processes remain largely unknown(Zugazagoitia et al., 2014).
Computer vision algorithms have attained exceptionally good performance for image classification(Danuser, 2011; Lawrence et al., 1997). Previously, investigators have defined many types of quantitative image features, including the size, perimeter, shape, eccentricity, and texture patterns of the cell nuclei and cytoplasm, to analyze pathology images objectively(Beck et al., 2011; Yu et al., 2016b). A number of image features are not easily identified by human evaluators, but they are significantly associated with cancer patients’ diagnoses and prognoses (Beck et al., 2011). These results support the clinical utility of quantifying the morphological changes of tumor cells with an automated and objective algorithm.
Moreover, with the advent of the omics (including genomics, transcriptomics, and proteomics) revolution, there is the potential for understanding the molecular biology of histological phenotypes by integrating omics and morphological features of the tumor cells(Haspel et al., 2010; Wall and Tonellato, 2012; Wilkerson et al., 2012; Yuan et al., 2012). Omics studies have provided insights into the molecular mechanisms of many cancer types(Dong et al., 2016; Snyder, 2016; Yu et al., 2016a; Yu and Snyder, 2016; Zhang et al., 2016), and have characterized the inter-individual differences in disease phenotypes(Clinical Lung Cancer Genome and Network Genomic, 2013; Henry et al., 2016; Yu et al., 2017). The systematic integration of histomorphological studies and omics profiles is expected to provide further understandings of tumor cell morphology and potentially more accurate stratification of patients’ prognoses(Beck et al., 2011; Liu et al., 2006; Yu and Snyder, 2016; Yuan et al., 2012).
Here we analyze lung adenocarcinoma samples and correlate cell morphology features from histopathology images with genomic, transcriptomic or proteomic profiles to generate hypotheses about the biological processes associated with morphological changes and the molecular basis of cancer development. Additionally, the integration of histopathology features and omics profiles improved the prediction accuracy of patient prognosis, which contributes to personalizing cancer treatment plans(Chin et al., 2011; Revannasiddaiah et al., 2014; Tang et al., 2014).
Results
Patient Characteristics
We analyzed data from a total of 538 lung adenocarcinoma patients previously collected by The Cancer Genome Atlas (TCGA) project (Cancer Genome Atlas Research, 2014). These data included genetic variants identified by whole-exome sequencing, tumor transcriptomics profiles characterized by RNA-sequencing, tumor proteomics information quantified by reverse phase protein array, and clinical variables such as tumor stage and survival information. We also obtained digital whole-slide histopathology images of the primary tumors along with the accompanying pathology reports from the same TCGA data set. We divided the TCGA data set into distinct training and test sets for machine learning approaches. To validate our survival prediction methods, we acquired RNA-sequencing, histopathology annotations, and survival information of an independent lung adenocarcinoma patient cohort (n=27) from Mayo Clinic (Sun et al., 2014). Supplemental Table 1 shows the patient characteristics of all participants in the TCGA cohorts under study. Supplemental Table 2 shows the clinical profiles of stage I patients in both TCGA and Mayo Clinic cohorts for survival analysis. The tumor grade, stage I sub-classifications (stage IA and IB), and survival outcomes of stage I adenocarcinoma patients in the two cohorts were not significantly different (P-values: 0.1833, 0.4362, 0.3556, respectively).
We first processed the pathology images by applying an automated algorithm to convert the whole-slide histopathology scans into overlapping tiles, selected the regions of interest and discarded blank background, segmented the cells, and extracted quantitative features from the images, such as the size, shape, intensity distribution, and texture features from the identified tumor cells and tumor nuclei. Since there are tens to hundreds of cells per image tile, we calculated summary statistics including mean, median, percentiles, and standard deviations to capture the distribution of each basic quantitative feature. We next identified pathology grade from pathology reports and collected gene expression and protein expression data generated by RNA-sequencing and reverse-phase protein array respectively. The resulting histopathology and omics profiles served as the input to our machine learning tasks (Figure 1A).
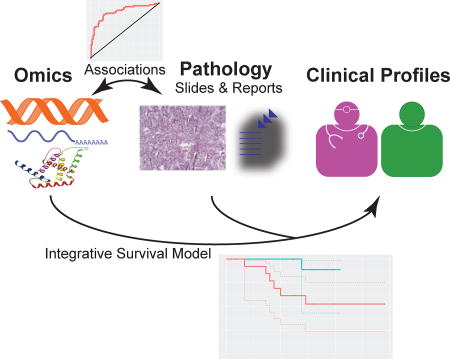
Figure 1.

(A) Model for data integration of this study. We processed the genomics, transcriptomics, and proteomics profiles of the primary tumor of lung adenocarcinoma patients and extracted quantitative histopathology features with a fully automated computational algorithm. The associations between functional omics and histopathology profiles were then analyzed to better understand the biology of this cancer. We further utilized both elements to generate an improved clinical prediction framework for lung adenocarcinoma patients. (B) A flow diagram of the machine learning approach for classification. We divided the data sets into distinct training and test sets, extracted genomic, transcriptomic, proteomic, and histopathology features from the tumor samples, selected the top features, built random forest models, and used the untouched test set to evaluate the model performance.
Genes Involved in Cell Cycle Regulation and Nucleotide Binding are Predictive of Histological Grade
With an aim of revealing the biological processes underlying tumor differentiation, we first used machine-learning methods to identify the correlations between pathology grade and global gene/protein expression profiles (Figure 1B). To reduce the impact from inter-rater variability on tumor grade, we divided the patient cohort into a higher-grade group (with poorly differentiated or moderately to poorly differentiated tumor) and a lower grade group (with well differentiated or moderately differentiated tumor)(Barletta et al., 2010), built transcriptomics and proteomics signatures for pathology grade in the training set (n=300 for transcriptomics; n=109 for proteomics), and evaluated the prediction models with the held-out test set (n=128 for transcriptomics; n=47 for proteomics).
We found that the gene expression profiles of 15 genes predicted the histopathology grade in the held-out test set with an area under the receiver operating characteristic curve (AUC) of 0.80 ± 0.0067 (Figure 2A). This prediction performance was significantly better than a random classifier (P < 0.001), and each of the 15 features was significantly associated with histopathology grade (adjusted P < 0.01). The expression levels of the top genes associated with tumor grade are summarized in Supplemental Figure 1A. All genes highly associated with tumor grade possessed significantly more gene-gene interactions compared with a null model consisting of random genes (P<0.0001, Figures 2C and Supplemental Figure 2A. Please see the STAR Methods section for the statistical methods.). KEGG pathway analysis showed that the differentially expressed genes between the two grade groups are enriched in cell cycle, DNA replication, and p53 signaling pathways. GO enrichment analysis also revealed that these genes were highly enriched in mitosis, cell cycle regulation, and nucleotide binding. Similarly, we identified a proteomics signature that correlated with pathology grade. Our classifiers using a total of 15 proteins attained AUCs approximately 0.81 ± 0.0071 in the test set, demonstrating that these protein expression profiles were indicative of pathology grade (Figure 2B). The abundance levels of the proteins indicative of tumor differentiation levels were outlined in Supplemental Figure 1B. The prediction performance was significantly better than expected by chance (P < 0.001). These proteins have significant interactions among one another (P<0.0001; Figures 2C and Supplemental Figure 2B). GO and KEGG analysis revealed that proteins predictive of tumor grade are enriched in cancer signaling pathways and regulation of cell development, pointing to the regulatory mechanisms related to tumor cell differentiation at the protein level. Taken together, our analyses suggest that genes participating in the cell cycle and cancer signaling pathways contribute to the levels of tumor cell dedifferentiation.
Figure 2.

Functional omics profiles predicted the dedifferentiation levels of lung adenocarcinoma. (A) The expression levels of fifteen genes selected by information gain ratio accurately predicted pathology grade, with an area under the ROC curve (AUC) approximately 0.80 ± 0.0067. (B) Fifteen proteomics features predicted histology grade with good accuracy. A panel of protein markers predicted pathology grade with AUC greater than 0.81 ± 0.0071. (C) Dysregulated genes and proteins associated with tumor grade were enriched in gene-gene/protein-protein interactions. The observed numbers of gene-gene/protein-protein interactions and the expected numbers were shown for the transcriptomic and proteomic analyses.
Correlation of Quantitative Histopathology Features with TP53 Mutation and Histological Sub-classifications
Next, we investigated the associations between quantitative histopathology measurements and omics data as well as previously established histological sub-classifications. To quantify the histopathology changes, we previously developed an automated method to identify the tumor nucleus and cytoplasm patterns. The extracted features were shown to associate with patient diagnosis and prognosis (Yu et al., 2016b)
TP53 mutation in lung adenocarcinoma has been associated with poorer prognosis(Ahrendt et al., 2003; Gu et al., 2016). We correlated the TP53 mutation status with the established quantitative morphological features. Our results showed that TP53 mutation was significantly associated with the pixel intensity distribution in the cytoplasm as well as the texture features in the tumor nuclei (adjusted Wilcoxson rank sum test P < 0.05; Supplemental Table 3). Transcriptomic analysis showed that TP53 mutation was correlated with dysregulation of genes participating in the DNA replication, mismatch repair, and cell cycle pathways (hypergeometric test Benjamini–Hochberg adjusted P < 0.05; Supplemental Table 4).
We further associated quantitative histological features with sub-classifications of lung adenocarcinoma patients. Previously, researchers defined a few tumor sub-classifications associated with the genomic and transcriptomic patterns of lung adenocarcinoma, including acinar predominant, papillary predominant, and solid predominant tumors(Cancer Genome Atlas Research, 2014). When correlating these sub-classifications with quantitative histological features, a texture feature of the tumor nucleus was significantly different among the sub-classifications, after correcting for multiple tests (adjusted Wilcoxson rank sum test P = 0.0254; Supplemental Table 5). Five image features that quantified the radial distribution of pixels were marginally significant in their associations with these sub-classifications (adjusted Wilcoxson rank sum test P = 0.054), and clustering analysis identified some heterogeneity in patients with the same sub-classification (Supplemental Figure 3). In addition, 68 quantitative image features were associated with the purity of tumor (Supplemental Table 6). Despite the wide range of purity score in the TCGA cohort, a LASSO regression model with the quantitative image features showed a moderate correlation between the histopathology-estimated purity scores and those measured by sequencing (Spearman’s correlation coefficient = 0.323; P<0.0001).
Integrative Model for Survival Prediction in Patients with Stage I Lung Adenocarcinoma
Next, we explored the use of omics and histopathology data to build regularized Cox proportional hazards models (Tibshirani, 1997) to predict patient survival. Patients with pathology stage I generally have better survival outcomes than patients with stage II or higher (log-rank test P<0.001; Figure 3A). However, the survival outcomes of stage I patients are very diverse and difficult to predict. After being diagnosed with stage I lung adenocarcinoma, more than half of this patient population died within 5 years, but there are approximately 15% of stage I patients who survived 10 years or more after the initial diagnosis. In addition, the clinical distinction between stage IA and stage IB did not reliably distinguish patients with different survival outcomes (P=0.878; Figure 3B), and the differences in overall survival between lung adenocarcinoma patients with stage II or higher tumor was not statistically significant in our cohort (P=0.139 among stage IIa, IIb, IIIa, IIIb, and IV; Supplemental Figure 4A) either. Furthermore, tumor grade alone did not significantly correlate with stage I patient survival (P>0.06; Figure 3C and Supplemental Figure 4B).
Figure 3.

Integrative models with gene expression profiles and pathology information predicted the survival outcomes of stage I lung adenocarcinoma patients. Red asterisks indicated censored data. (A) Lung adenocarcinoma patient survival stratified by tumor stage. Stage I patients generally have better prognoses (P<0.001), but there are significant inter-individual differences in their survival outcomes. (B) Survival outcomes of stage IA and stage IB lung adenocarcinoma patients. This refinement in the staging system could not distinguish patients with different prognoses in this cohort (P=0.878). (C) Stage I lung adenocarcinoma patient survival stratified by tumor grade. Grade alone could not predict patient survival reliably (P=0.0616). (D) A previously reported gene set could not distinguish longer-term survivors (n=112) from shorter-term survivors (n=110) with statistically significance in the TCGA stage I lung adenocarcinoma cohort (P=0.1097±0.0096). (E) The same set of genes could not distinguish patient survival in the Mayo Clinic stage I lung adenocarcinoma cohort either (P=0.0560±0.0108; 13 predicted longer-term survivors; 14 predicted shorter-term survivors). (F) Integrating pathology with gene expression profiles better predicted patient survival in the TCGA stage I lung adenocarcinoma cohort (P=0.0182±0.0021; 110 predicted longer-term survivors; 112 predicted-shorter-term survivors). (G) The improved performance of the integrative survival prediction method is replicated in the Mayo Clinic stage I lung adenocarcinoma cohort (P=0.0220±0.0070; 11 predicted longer-term survivors; 16 predicted shorter-term survivors).
Previously, researchers have proposed gene expression profiles associated with survival outcomes in stage I lung adenocarcinoma patients(Bianchi et al., 2007). However, the reported gene set together with known clinical variables could not reliably distinguish the survival outcomes of stage I patients in either the TCGA or the Mayo Clinic cohort (P=0.1097±0.0096 and P=0.0560±0.0108 respectively, adjusted for patient age; Figures 3D and 3E).
We built integrative models by employing gene expression, histopathology grade, and patient age as input features of the regularized Cox proportional hazards model. The integrative model performed better than gene expression or histopathology alone in prognostic prediction (P=0.0182±0.0021, adjusted for patient age; Figure 3F) on cross-validation in the TCGA cohort. We further replicated this integrative prediction method in the Mayo Clinic cohort (P=0.0220±0.0070, adjusted for patient age; Figure 3G), which confirmed the improved performance of our integrative method. Since the Mayo Clinic cohort was not involved in building the survival prediction model, these results suggested the generalizability of our prognostic stratification framework. These results indicated the efficacy of combining the information from multiple sources and modalities in improving cancer prognosis prediction.
Discussion
Our results demonstrate promising biological applications and prognostic utilities of considering both omics and histopathology features. We investigate the correlation of functional omics profiles with pathology grade, revealing both genes and proteins associated with tumor grade. Pathway analyses on these transcriptomics and proteomics patterns suggested that the level of cancer cell differentiation was related to mitosis and cell division pathways. This finding is consistent with the observation that higher-grade tumors generally have higher mitotic figures, i.e. the number of cells undergoing mitosis observed by light microscopy, and more atypical mitosis(Kadota et al., 2012; Poleri et al., 2003). The slight difference between the enrichments from the gene and the protein level analyses might originate from the fact that gene expression levels can be altered by posttranscriptional modifications. Our methods can be used to identify the molecular mechanisms driving other clinically important pathology findings in other complex diseases.
There are several limitations of this work. One limitation is that all patients are from medical centers in the United States. Participants in our cohorts came from 11 participating medical centers across the country but are predominantly Caucasians. Results from other studies have shown different genetic alterations in lung adenocarcinoma in other ethnic groups(Koivunen et al., 2008; Shi et al., 2014). Thus, it would be interesting to systematically analyze the functional omics and histopathology in patients of other ethnicities. In addition, the Mayo Clinic data set only contains 27 patients, and all of them were never-smokers. Although our integrative methods showed significant improvement in survival prediction in this cohort, the improvement over gene expression or histopathology only model was smaller than that in the TCGA test set. Further validation with a larger cohort is needed.
In summary, this work systematically correlated histopathology patterns with omics findings to develop models to predict survival outcomes of lung adenocarcinoma patients. The developed algorithms are likely extensible to other tumor types or complex diseases.
STAR Methods
Contact for Reagent and Resource Sharing
Further information and requests for resources and reagents should be directed to and will be fulfilled by the Lead Contact, Michael Snyder (mpsnyder@stanford.edu).
Method Details
Extracting Genomic, Transcriptomic, Proteomic, Histopathology, and Clinical Features of Lung Adenocarcinoma Patients
A high-quality data set for omics, histopathology, and clinical information of all 538 lung adenocarcinoma patients was obtained from The Cancer Genome Atlas (TCGA) data portal(Cancer Genome Atlas Research, 2014). The omics data were processed by standard bioinformatics pipelines (GATK(McKenna et al., 2010) for exome-sequencing, RSEM(Li and Dewey, 2011) for RNA-sequencing, and ArrayPro for reversed phase protein array) by the TCGA consortium. Whole-slide histopathology images, pathology reports, as well as clinical information were acquired for this patient cohort. To validate our clinical prediction method, an independent cohort of stage I lung adenocarcinoma patients (n=27) from Mayo Clinic was identified from the Gene Expression Omnibus(Sun et al., 2014). RNA-sequencing results and clinical variables were obtained and histopathology grade was manually extracted from the associated pathology reports. This study was retrospective and did not involve randomization or blinding. All samples with available data were included in the study.
Quantification and Statistical Analysis
Correlating Omics Profiles with Histopathology Annotations by Machine Learning Methods
Histopathology grade was manually extracted, due to their implications for patients’ survival outcomes and their presence in most pathology reports(Barletta et al., 2010; Warth et al., 2012). To reduce the impact of inter-observer disagreement, pathology grades were binarized into a higher-grade group (poorly differentiated or moderately-to-poorly differentiated) or a lower-grade group (well differentiated or moderately differentiated)(Barletta et al., 2010). These group assignments led to relatively balanced groups, with at least 40% of cases in each group.
Breiman’s random forest(Breiman, 2001; Liaw and Wiener, 2002) was used to correlate transcriptomics and proteomics profiles with pathology grade. To reduce the risk of overfitting, the information gain ratio of each feature is calculated and only the top features ranked by information gain ratio were selected and included in the model. Wilcoxon rank sum test, which does not rely on assumptions about the probability distributions of the variables, was performed to evaluate the expression difference of each of the selected feature, and the Benjamini-Hochberg procedure was performed to adjust for multiple tests. Unlike convention machine learning methods that tend to select a minimal number of complementary features, this method ensured that the selected feature sets contain the individual transcriptomics or proteomics patterns correlated with the histopathology annotation of interest, which could be used for enrichment analysis.
To evaluate the performance of the resulting classifiers, the data set was divided into distinct training and test sets, with 80% of the cases in the training and 20% in the test set. There is no overlap between the training and test set. The top features were selected and the models were finalized using the training set. To ensure the robustness of the machine learning framework, the random partition process was repeated 20 times, generating distinct training and test sets each time with no overlaps between training and test data. The machine learning models were built using the training data and evaluated on the test set. The distribution of the area under the receiver operating characteristic curves (AUC) for the classifiers from repeated random partitions was reported.
To identify the biological pathways implicated in the selected lists of genes and proteins, we performed gene ontology (GO) enrichment analysis, KEGG pathway analysis, and network analysis using the String Database Tool (Szklarczyk et al., 2015). To estimate the enrichments in gene-gene interactions, the String Database Tool used a Poisson-Binomial variable to model the number of edges connecting the genes, and calculated the P-value of observing the number of gene-gene interactions under the null hypothesis that this gene set did not possess more gene-gene interactions than a random set(Franceschini et al., 2013). Significant gene-gene interactions often indicated that the selected genes participated in related molecular pathways. The gene expression and protein expression levels associated with tumor grade were visualized using heatmaps, and hierarchical clustering was employed to group genes/proteins with similar expression patterns.
Genetic Aberrations, Tumor Purity and their Correlations with Quantitative Histopathology
The associations between quantitative histopathology image features and TP53 mutation status were investigated due to the clinical significance of TP53 mutation and the availability of patients with both TP53 mutation information and histopathology image data(Cancer Genome Atlas Research, 2014). To extract the quantitative features from the whole slide histopathology images, a fully automated computational framework was employed (Yu et al., 2016b). The framework employed the “IdentifyPrimaryObjects” and the “IdentifySecondaryObject” modules in CellProfiler to identify the lung tumor cells and tumor cell nuclei from the histopathology slides, and used the "Measure Image Area Occupied", “Measure Correlation", Measure Granularity", "Measure Image Intensity", "Measure Image Quality", "Measure Object Size Shape", "Measure Object Intensity", "Measure Object Radial Distribution", "Measure Object Neighbors", and "Measure Texture" modules to extract the size, shape, intensity distribution, and texture features from the identified tumor cells(Carpenter et al., 2006). A total of 694 basic quantitative image features for the tumor cells were extracted using this bioinformatics framework (Supplemental Data 1). Wilcoxon rank sum test with Benjamini-Hochberg procedure was employed to identify the associations between the quantitative image features and TP53 mutation status.
Similar procedures were employed to characterize the correlations between quantitative histopathology image features and adenocarcinoma sub-classifications as well as tumor purity estimates in the TCGA cohort(Cancer Genome Atlas Research, 2014). When correlating with adenocarcinoma sub-classification, analysis of variance with Benjamini-Hochberg procedure was used to account for the multiple classes. Tumor purity estimates were binarized into two groups, where samples with absolute purity call less than 0.5 were categorized as the low purity group and those with absolute purity call greater than or equal to 0.5 were defined as the high purity group. Wilcoxon rank sum test with Benjamini-Hochberg procedure was employed to identify the associations between the quantitative image features and purity groups. A Least Absolute Shrinkage and Selection Operator (LASSO) regression model was built using the quantitative image features, and Spearman's rank correlation coefficient, a non-parametric measure of rank correlation, was calculated to quantify the association between the predicted purity value and the absolute purity call.
Prognostic Prediction
Survival stratification by tumor stage and grade were evaluated with the log-rank test, which is non-parametric. Sets of reported genes associated with stage I lung adenocarcinoma patient survival(Bianchi et al., 2007) were intersected with gene expression levels measured in the TCGA data set. LASSO-Cox proportional hazards models(Friedman et al., 2010; Simon et al., 2011; Tibshirani, 1997) were employed to handle right-censored survival information and avoid overfitting. The LASSO-Cox method used L1 regularization to push the coefficients of uninformative features to zero, which achieved the goal of feature selection while building the survival model.
Current clinical stratification methods using tumor stage and grade as well as a previously-reported gene expression signature(Bianchi et al., 2007) were used as the baseline for comparison. The survival stratifications between all stages as well as between stage IA and stage IB were investigated. In order to better predict the diverse clinical prognoses of stage I adenocarcinoma patients, integrative LASSO-Cox models were built using the previously reported gene expression signature(Bianchi et al., 2007), the pathology grades, and patient age as inputs. The regularization parameters in the LASSO-Cox models were optimized through cross-validation on the training set. After all parameters in the model were finalized, a survival index was calculated for each patient in the training set, and the median survival index in the training set was used as a threshold for distinguishing longer-term survivors from shorter-term survivors. Patients with missing pathology or omics data were discarded from the analysis. All models were adjusted for patient age.
Evaluation of Prognostic Prediction Models
To evaluate the prediction performance of our prediction models in the TCGA cohort, leave-one-out cross-validation was employed. The log-rank test was used to determine the difference in survival outcomes between the predicted groups.
To further validate the survival model, an independent cohort from Mayo Clinic(Sun et al., 2014) was obtained and the gene expression and histopathology profiles of each patient in this cohort were analyzed. The same procedure described above was used to stratify patients in this replication set into two survival groups. Again, the log-rank test was used to determine the survival outcome difference between groups.
Data and Software Availability
The quantitative histopathology image features are provided in Supplemental Data 1.
Supplementary Material
Supplemental Data 1: Related to Figure 1. Quantitative histopathology image features of lung adenocarcinoma.
Supplemental Figures and Tables
Highlights.
Gene and protein expression levels predicted lung adenocarcinoma grade.
Quantitative histopathology features correlated with omics classifications.
An integrative omics-pathology model better predicted stage I patients’ prognosis.
The improved survival prediction results were replicated in an independent cohort.
Acknowledgments
The authors would like to thank Dr. Matt van de Rijn for his valuable advice on the study design and interpretation of results, and Ce Zhang, Feiran Wang, Andrej Krevl, and Rok Sosic for their assistance on the computation framework. K.-H.Y. is a Harvard Data Science Postdoctoral Fellow, Howard Hughes Medical Institute International Student Research Fellow, and Winston Chen Stanford Graduate Fellow. This work was supported in part by grants from the NIH, grant numbers 5U24CA160036, 5P50HG007735, 1U01CA190214, and U01CA142555, and the Defense Advanced Research Projects Agency (DARPA) Simplifying Complexity in Scientific Discovery (SIMPLEX) grant number N66001-15-C-4043 and Data-Driven Discovery of Models contract number FA8750-17-2-0095. The authors thank the AWS Cloud Credits for Research, the Microsoft Azure Research Award, and the NVIDIA GPU Grant Program for their support.
Footnotes
Publisher's Disclaimer: This is a PDF file of an unedited manuscript that has been accepted for publication. As a service to our customers we are providing this early version of the manuscript. The manuscript will undergo copyediting, typesetting, and review of the resulting proof before it is published in its final citable form. Please note that during the production process errors may be discovered which could affect the content, and all legal disclaimers that apply to the journal pertain.
Author Contributions
K.-H. Y. conceived, designed, performed the analyses, interpreted the results, and wrote the manuscript. G.B, D.L.R, C.R., R.B.A., and M.S. interpreted the results and edited the manuscript. C.R., R.B.A, and M.S. supervised the work.
Conflict of Interest
M.S. is a cofounder and member of the scientific advisory board for Personalis, Sensomics and Qbio. He is a member of the scientific advisory board of Epinomics and Genapsys.
References
- Ahrendt SA, Hu Y, Buta M, McDermott MP, Benoit N, Yang SC, Wu L, Sidransky D. p53 mutations and survival in stage I non-small-cell lung cancer: results of a prospective study. Journal of the National Cancer Institute. 2003;95:961–970. doi: 10.1093/jnci/95.13.961. [DOI] [PubMed] [Google Scholar]
- Barletta JA, Yeap BY, Chirieac LR. Prognostic significance of grading in lung adenocarcinoma. Cancer. 2010;116:659–669. doi: 10.1002/cncr.24831. [DOI] [PMC free article] [PubMed] [Google Scholar]
- Beck AH, Sangoi AR, Leung S, Marinelli RJ, Nielsen TO, van de Vijver MJ, West RB, van de Rijn M, Koller D. Systematic analysis of breast cancer morphology uncovers stromal features associated with survival. Science translational medicine. 2011;3:108ra113. doi: 10.1126/scitranslmed.3002564. [DOI] [PubMed] [Google Scholar]
- Bianchi F, Nuciforo P, Vecchi M, Bernard L, Tizzoni L, Marchetti A, Buttitta F, Felicioni L, Nicassio F, Di Fiore PP. Survival prediction of stage I lung adenocarcinomas by expression of 10 genes. The Journal of clinical investigation. 2007;117:3436–3444. doi: 10.1172/JCI32007. [DOI] [PMC free article] [PubMed] [Google Scholar]
- Breiman L. Random forests. Mach Learn. 2001;45:5–32. [Google Scholar]
- Cancer Genome Atlas Research, N. Comprehensive molecular profiling of lung adenocarcinoma. Nature. 2014;511:543–550. doi: 10.1038/nature13385. [DOI] [PMC free article] [PubMed] [Google Scholar]
- Carpenter AE, Jones TR, Lamprecht MR, Clarke C, Kang IH, Friman O, Guertin DA, Chang JH, Lindquist RA, Moffat J, et al. CellProfiler: image analysis software for identifying and quantifying cell phenotypes. Genome biology. 2006;7:R100. doi: 10.1186/gb-2006-7-10-r100. [DOI] [PMC free article] [PubMed] [Google Scholar]
- Chin L, Andersen JN, Futreal PA. Cancer genomics: from discovery science to personalized medicine. Nature medicine. 2011;17:297–303. doi: 10.1038/nm.2323. [DOI] [PubMed] [Google Scholar]
- Clinical Lung Cancer Genome, P., and Network Genomic, M. A genomics-based classification of human lung tumors. Science translational medicine. 2013;5:209ra153. doi: 10.1126/scitranslmed.3006802. [DOI] [PMC free article] [PubMed] [Google Scholar]
- Collins LG, Haines C, Perkel R, Enck RE. Lung cancer: diagnosis and management. American family physician. 2007;75:56–63. [PubMed] [Google Scholar]
- Danuser G. Computer vision in cell biology. Cell. 2011;147:973–978. doi: 10.1016/j.cell.2011.11.001. [DOI] [PubMed] [Google Scholar]
- Dong F, Davineni PK, Howitt BE, Beck AH. A BRCA1/2 Mutational Signature and Survival in Ovarian High-Grade Serous Carcinoma. Cancer epidemiology, biomarkers & prevention : a publication of the American Association for Cancer Research, cosponsored by the American Society of Preventive Oncology. 2016;25:1511–1516. doi: 10.1158/1055-9965.EPI-16-0286. [DOI] [PubMed] [Google Scholar]
- Fischer AH, Jacobson KA, Rose J, Zeller R. Hematoxylin and eosin staining of tissue and cell sections. CSH protocols. 2008;2008 doi: 10.1101/pdb.prot4986. pdb prot4986. [DOI] [PubMed] [Google Scholar]
- Franceschini A, Szklarczyk D, Frankild S, Kuhn M, Simonovic M, Roth A, Lin J, Minguez P, Bork P, von Mering C, et al. STRING v9.1: protein-protein interaction networks, with increased coverage and integration. Nucleic acids research. 2013;41:D808–815. doi: 10.1093/nar/gks1094. [DOI] [PMC free article] [PubMed] [Google Scholar]
- Friedman J, Hastie T, Tibshirani R. Regularization Paths for Generalized Linear Models via Coordinate Descent. J Stat Softw. 2010;33:1–22. [PMC free article] [PubMed] [Google Scholar]
- Gardiner N, Jogai S, Wallis A. The revised lung adenocarcinoma classification-an imaging guide. Journal of thoracic disease. 2014;6:S537–546. doi: 10.3978/j.issn.2072-1439.2014.04.05. [DOI] [PMC free article] [PubMed] [Google Scholar]
- Gu J, Zhou Y, Huang L, Ou W, Wu J, Li S, Xu J, Feng J, Liu B. TP53 mutation is associated with a poor clinical outcome for non-small cell lung cancer: Evidence from a meta-analysis. Mol Clin Oncol. 2016;5:705–713. doi: 10.3892/mco.2016.1057. [DOI] [PMC free article] [PubMed] [Google Scholar]
- Harpole DH, Jr, Herndon JE, 2nd, Wolfe WG, Iglehart JD, Marks JR. A prognostic model of recurrence and death in stage I non-small cell lung cancer utilizing presentation, histopathology, and oncoprotein expression. Cancer research. 1995;55:51–56. [PubMed] [Google Scholar]
- Haspel RL, Arnaout R, Briere L, Kantarci S, Marchand K, Tonellato P, Connolly J, Boguski MS, Saffitz JE. A call to action: training pathology residents in genomics and personalized medicine. American journal of clinical pathology. 2010;133:832–834. doi: 10.1309/AJCPN6Q1QKCLYKXM. [DOI] [PubMed] [Google Scholar]
- Henry WS, Hendrickson DG, Beca F, Glass B, Lindahl-Allen M, He L, Ji Z, Struhl K, Beck AH, Rinn JL, et al. LINC00520 is induced by Src, STAT3, and PI3K and plays a functional role in breast cancer. Oncotarget. 2016;7:81981–81994. doi: 10.18632/oncotarget.11962. [DOI] [PMC free article] [PubMed] [Google Scholar]
- Jemal A, Bray F, Center MM, Ferlay J, Ward E, Forman D. Global cancer statistics. CA: a cancer journal for clinicians. 2011;61:69–90. doi: 10.3322/caac.20107. [DOI] [PubMed] [Google Scholar]
- Kadota K, Suzuki K, Kachala SS, Zabor EC, Sima CS, Moreira AL, Yoshizawa A, Riely GJ, Rusch VW, Adusumilli PS, et al. A grading system combining architectural features and mitotic count predicts recurrence in stage I lung adenocarcinoma. Modern pathology : an official journal of the United States and Canadian Academy of Pathology, Inc. 2012;25:1117–1127. doi: 10.1038/modpathol.2012.58. [DOI] [PMC free article] [PubMed] [Google Scholar]
- Koivunen JP, Kim J, Lee J, Rogers AM, Park JO, Zhao X, Naoki K, Okamoto I, Nakagawa K, Yeap BY, et al. Mutations in the LKB1 tumour suppressor are frequently detected in tumours from Caucasian but not Asian lung cancer patients. British journal of cancer. 2008;99:245–252. doi: 10.1038/sj.bjc.6604469. [DOI] [PMC free article] [PubMed] [Google Scholar]
- Lawrence S, Giles CL, Tsoi AC, Back AD. Face recognition: A convolutional neural-network approach. Ieee T Neural Networ. 1997;8:98–113. doi: 10.1109/72.554195. [DOI] [PubMed] [Google Scholar]
- Li B, Dewey CN. RSEM: accurate transcript quantification from RNA-Seq data with or without a reference genome. BMC Bioinformatics. 2011;12:323. doi: 10.1186/1471-2105-12-323. [DOI] [PMC free article] [PubMed] [Google Scholar]
- Liaw A, Wiener M. Classification and Regression by randomForest. R News. 2002;2:18–22. [Google Scholar]
- Liu H, Kho AT, Kohane IS, Sun Y. Predicting survival within the lung cancer histopathological hierarchy using a multi-scale genomic model of development. PLoS medicine. 2006;3:e232. doi: 10.1371/journal.pmed.0030232. [DOI] [PMC free article] [PubMed] [Google Scholar]
- McKenna A, Hanna M, Banks E, Sivachenko A, Cibulskis K, Kernytsky A, Garimella K, Altshuler D, Gabriel S, Daly M, et al. The Genome Analysis Toolkit: a MapReduce framework for analyzing next-generation DNA sequencing data. Genome research. 2010;20:1297–1303. doi: 10.1101/gr.107524.110. [DOI] [PMC free article] [PubMed] [Google Scholar]
- Poleri C, Morero JL, Nieva B, Vazquez MF, Rodriguez C, de Titto E, Rosenberg M. Risk of recurrence in patients with surgically resected stage I non-small cell lung carcinoma: histopathologic and immunohistochemical analysis. Chest. 2003;123:1858–1867. doi: 10.1378/chest.123.6.1858. [DOI] [PubMed] [Google Scholar]
- Raab SS, Grzybicki DM, Janosky JE, Zarbo RJ, Meier FA, Jensen C, Geyer SJ. Clinical impact and frequency of anatomic pathology errors in cancer diagnoses. Cancer. 2005;104:2205–2213. doi: 10.1002/cncr.21431. [DOI] [PubMed] [Google Scholar]
- Revannasiddaiah S, Thakur P, Bhardwaj B, Susheela SP, Madabhavi I. Pulmonary adenocarcinoma: implications of the recent advances in molecular biology, treatment and the IASLC/ATS/ERS classification. Journal of thoracic disease. 2014;6:S502–525. doi: 10.3978/j.issn.2072-1439.2014.05.19. [DOI] [PMC free article] [PubMed] [Google Scholar]
- Shi Y, Au JS, Thongprasert S, Srinivasan S, Tsai CM, Khoa MT, Heeroma K, Itoh Y, Cornelio G, Yang PC. A prospective, molecular epidemiology study of EGFR mutations in Asian patients with advanced non-small-cell lung cancer of adenocarcinoma histology (PIONEER) Journal of thoracic oncology : official publication of the International Association for the Study of Lung Cancer. 2014;9:154–162. doi: 10.1097/JTO.0000000000000033. [DOI] [PMC free article] [PubMed] [Google Scholar]
- Siegel R, Ma J, Zou Z, Jemal A. Cancer statistics, 2014. CA: a cancer journal for clinicians. 2014;64:9–29. doi: 10.3322/caac.21208. [DOI] [PubMed] [Google Scholar]
- Simon N, Friedman J, Hastie T, Tibshirani R. Regularization Paths for Cox's Proportional Hazards Model via Coordinate Descent. J Stat Softw. 2011;39:1–13. doi: 10.18637/jss.v039.i05. [DOI] [PMC free article] [PubMed] [Google Scholar]
- Snyder M. Genomics and Personalized Medicine: What Everyone Needs to Know (Oxford University Press) 2016 [Google Scholar]
- Sun Z, Wang L, Eckloff BW, Deng B, Wang Y, Wampfler JA, Jang J, Wieben ED, Jen J, You M, et al. Conserved recurrent gene mutations correlate with pathway deregulation and clinical outcomes of lung adenocarcinoma in never-smokers. BMC Med Genomics. 2014;7:32. doi: 10.1186/1755-8794-7-32. [DOI] [PMC free article] [PubMed] [Google Scholar]
- Szklarczyk D, Franceschini A, Wyder S, Forslund K, Heller D, Huerta-Cepas J, Simonovic M, Roth A, Santos A, Tsafou KP, et al. STRING v10: protein-protein interaction networks, integrated over the tree of life. Nucleic acids research. 2015;43:D447–452. doi: 10.1093/nar/gku1003. [DOI] [PMC free article] [PubMed] [Google Scholar]
- Tang Y, He Z, Zhu Q, Qiao G. The 2011 IASLC/ATS/ERS pulmonary adenocarcinoma classification: a landmark in personalized medicine for lung cancer management. Journal of thoracic disease. 2014;6:S589–596. doi: 10.3978/j.issn.2072-1439.2014.09.15. [DOI] [PMC free article] [PubMed] [Google Scholar]
- Tibshirani R. The lasso method for variable selection in the Cox model. Statistics in medicine. 1997;16:385–395. doi: 10.1002/(sici)1097-0258(19970228)16:4<385::aid-sim380>3.0.co;2-3. [DOI] [PubMed] [Google Scholar]
- Travis WD, Brambilla E, Noguchi M, Nicholson AG, Geisinger KR, Yatabe Y, Beer DG, Powell CA, Riely GJ, Van Schil PE, et al. International association for the study of lung cancer/american thoracic society/european respiratory society international multidisciplinary classification of lung adenocarcinoma. Journal of thoracic oncology : official publication of the International Association for the Study of Lung Cancer. 2011;6:244–285. doi: 10.1097/JTO.0b013e318206a221. [DOI] [PMC free article] [PubMed] [Google Scholar]
- Wall DP, Tonellato PJ. The future of genomics in pathology. F1000 medicine reports. 2012;4:14. doi: 10.3410/M4-14. [DOI] [PMC free article] [PubMed] [Google Scholar]
- Warth A, Muley T, Meister M, Stenzinger A, Thomas M, Schirmacher P, Schnabel PA, Budczies J, Hoffmann H, Weichert W. The novel histologic International Association for the Study of Lung Cancer/American Thoracic Society/European Respiratory Society classification system of lung adenocarcinoma is a stage-independent predictor of survival. Journal of clinical oncology : official journal of the American Society of Clinical Oncology. 2012;30:1438–1446. doi: 10.1200/JCO.2011.37.2185. [DOI] [PubMed] [Google Scholar]
- Wilkerson MD, Yin X, Walter V, Zhao N, Cabanski CR, Hayward MC, Miller CR, Socinski MA, Parsons AM, Thorne LB, et al. Differential pathogenesis of lung adenocarcinoma subtypes involving sequence mutations, copy number, chromosomal instability, and methylation. PloS one. 2012;7:e36530. doi: 10.1371/journal.pone.0036530. [DOI] [PMC free article] [PubMed] [Google Scholar]
- Yu KH, Fitzpatrick MR, Pappas L, Chan W, Kung J, Snyder M. Omics AnalySIs System for PRecision Oncology (OASISPRO): A Web-based Omics Analysis Tool for Clinical Phenotype Prediction. Bioinformatics. 2017 doi: 10.1093/bioinformatics/btx572. [DOI] [PMC free article] [PubMed] [Google Scholar]
- Yu KH, Levine DA, Zhang H, Chan DW, Zhang Z, Snyder M. Predicting Ovarian Cancer Patients' Clinical Response to Platinum-Based Chemotherapy by Their Tumor Proteomic Signatures. Journal of proteome research. 2016a;15:2455–2465. doi: 10.1021/acs.jproteome.5b01129. [DOI] [PMC free article] [PubMed] [Google Scholar]
- Yu KH, Snyder M. Omics profiling in precision oncology. Molecular & cellular proteomics : MCP. 2016;15:2525–2536. doi: 10.1074/mcp.O116.059253. [DOI] [PMC free article] [PubMed] [Google Scholar]
- Yu KH, Zhang C, Berry GJ, Altman RB, Re C, Rubin DL, Snyder M. Predicting non-small cell lung cancer prognosis by fully automated microscopic pathology image features. Nature communications. 2016b;7:12474. doi: 10.1038/ncomms12474. [DOI] [PMC free article] [PubMed] [Google Scholar]
- Yuan Y, Failmezger H, Rueda OM, Ali HR, Graf S, Chin SF, Schwarz RF, Curtis C, Dunning MJ, Bardwell H, et al. Quantitative image analysis of cellular heterogeneity in breast tumors complements genomic profiling. Science translational medicine. 2012;4:157ra143. doi: 10.1126/scitranslmed.3004330. [DOI] [PubMed] [Google Scholar]
- Zhang H, Liu T, Zhang Z, Payne SH, Zhang B, McDermott JE, Zhou JY, Petyuk VA, Chen L, Ray D, et al. Integrated Proteogenomic Characterization of Human High-Grade Serous Ovarian Cancer. Cell. 2016;166:755–765. doi: 10.1016/j.cell.2016.05.069. [DOI] [PMC free article] [PubMed] [Google Scholar]
- Zugazagoitia J, Enguita AB, Nunez JA, Iglesias L, Ponce S. The new IASLC/ATS/ERS lung adenocarcinoma classification from a clinical perspective: current concepts and future prospects. Journal of thoracic disease. 2014;6:S526–536. doi: 10.3978/j.issn.2072-1439.2014.01.27. [DOI] [PMC free article] [PubMed] [Google Scholar]
Associated Data
This section collects any data citations, data availability statements, or supplementary materials included in this article.
Supplementary Materials
Supplemental Data 1: Related to Figure 1. Quantitative histopathology image features of lung adenocarcinoma.
Supplemental Figures and Tables