

Summary
ERK signaling regulates the expression of target genes, but it is unclear how ERK activity dynamics are interpreted. Here, we investigate this question using simultaneous, live, single-cell imaging of two ERK activity reporters and expression of Fra-1, a target gene controlling epithelial cell identity. We find that Fra-1 is expressed in proportion to the amplitude and duration of ERK activity. In contrast to previous “persistence detector” and “selective filter” models in which Fra-1 expression only occurs when ERK activity persists beyond a threshold duration, our observations demonstrate that the network regulating Fra-1 expression integrates total ERK activity and responds to it linearly. However, exploration of a generalized mathematical model of the Fra-1 coherent feedfoward loop demonstrates that it can perform either linear integration or persistence detection, depending on the basal mRNA production rate and protein production delays. Our data indicate that significant basal expression and short delays cause Fra-1 to respond linearly to integrated ERK activity.
Keywords: FRET, KTR, transcription, signal transduction dynamics, amplification, mitogen-activated protein kinase, MAPK, Ras, MEK, FOSL1, c-Fos, Egr-1, EGF, growth factor, stabilization, EGFR, MCF10A, MCF-10A, amphiregulin, live-cell
eTOC blurb
Using a combination of live-cell ERK activity reporters and mathematical analysis, Gillies et al. determine that the immediate early gene, Fra-1, is produced in linear relation to total ERK activity. This demonstrates that the network functions as a linear integrator, not a selective filter, of ERK activity patterns.

Introduction
Most mammalian signaling pathways induce post-translational protein modifications (PTMs) within minutes following stimulation, followed by changes in gene expression over the course of hours or days. Because gene expression ultimately causes changes in cellular phenotype, the transduction of immediate PTM events to transcriptional machinery is critical and has been the subject of a number of quantitative studies (Hansen et al., 2015; Hao and O’Shea, 2011; Lee et al., 2014; Tay et al., 2010). However, testing models of these systems is difficult because of the very different time scales of these processes. In principle, if all cells within a population responded homogenously to stimuli, then traditional techniques, which report the average protein activity or transcript number across many cells, would be sufficient. However, recent studies have revealed that signaling responses at both the PTM and gene expression levels display a remarkable degree of cell-to-cell variability (Albeck et al., 2013; Aoki et al., 2013), and it is now clear that population-level time course measurements distort the underlying quantitative relationship. For example, averaging across a population containing both responding and non-responding cells may give the appearance of an analog response, when the underlying cellular behavior is in fact binary (Purvis and Lahav, 2013). Furthermore, “snapshot” approaches that collect single cell data at fixed time points can fail to reveal dynamic behaviors or artificially indicate a bimodal response (Birtwistle et al., 2012). A more suitable dataset would provide time-course data for both PTM and gene expression events within the same individual cell, so that the dynamics of each can be cross-correlated without assumption or inference.
The Ras/MAPK pathway plays a central role in many cell types in controlling cellular proliferation and differentiation. Within this pathway, transduction begins with activation of receptor tyrosine kinases (RTKs) such as EGFR, and culminates with activation of the kinase ERK (Fig. 1A). ERK activation has been observed as early as 30 seconds following exposure to growth factors and typically peaks 10–15 minutes later (Nakakuki et al., 2010; Saito et al., 2013). Depending on the cell type or the specific growth factor ligand, ERK activity may return rapidly to baseline within 30 minutes, or remain elevated for hours (Niepel et al., 2014). ERK phosphorylates hundreds of substrates, including transcription factors (TFs) such as SRF and Elk-1 (Gille et al., 1995), which increase transcription rates for ERK target genes (ETGs) including c-Fos, c-Myc, Egr-1, and Fra-1 (Amit et al., 2007; Treisman, 1985). The resulting increases in mRNA and protein numbers are detectable within minutes, but typically take >30 minutes to reach their peak level. Several ETGs, including c-Fos, c-Myc, and Fra-1, are subject to an additional layer of regulation: the protein products of these genes are initially unstable, with a half-life of ~30 minutes, but are protected from degradation upon phosphorylation by ERK and RSK (a kinase also activated by ERK) (Okazaki and Sagata, 1995). Of these genes, Fra-1 is of particular importance within mammary epithelial cells, where it controls epithelial-to-mesenchymal transitions (Bakiri et al., 2015) and plays a role in the development of invasive characteristics during breast cancer progression (Tam et al., 2013).
Figure 1. Different ERK reporters measure activity in different ranges.
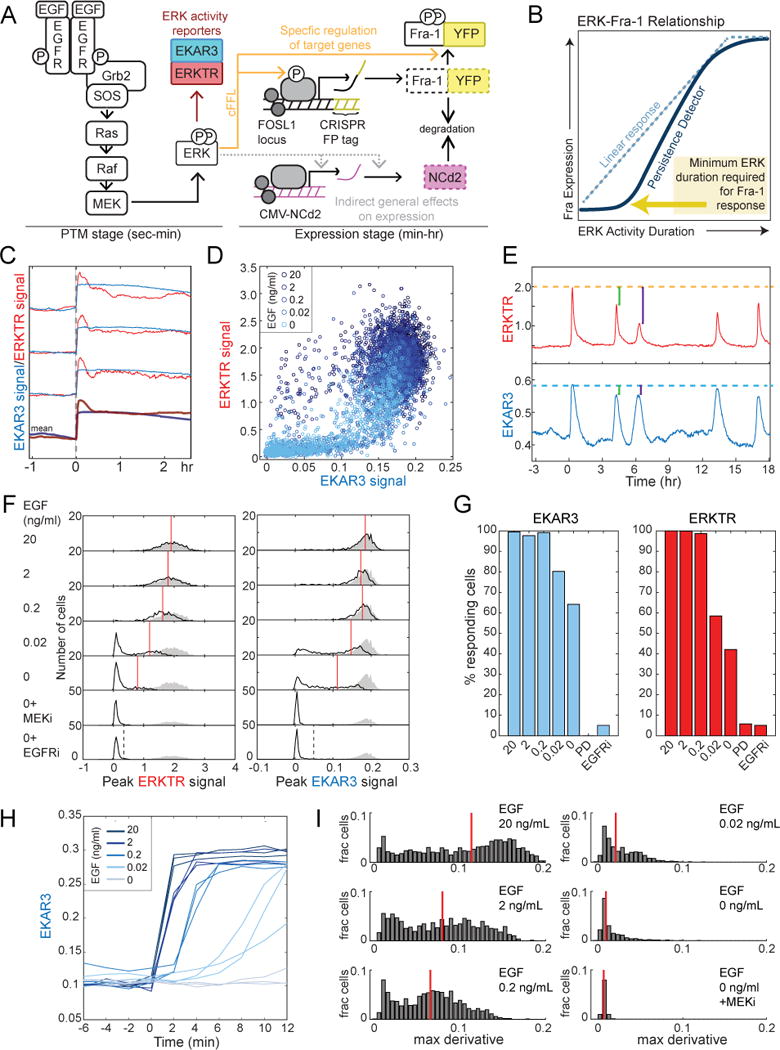
A. Schematic of the pathway and reporters used in this study. EKAR3 and ERKTR indicate ERK activity with minute-scale resolution, providing a readout of the PTM stage of EGF response. Genomic knock-in of a YFP fusion tag at the FOSL1 locus results in production of a fluorescent signal that responds to ERK activity at the level of both transcription and protein stabilization (orange arrows). NCd2 expressed from a viral promoter provides a control for general changes in gene expression capacity.
B. Expected behavior of a persistence detector. As the duration of ERK activity increases, Fra-1 expression responds selectively to longer periods of stimulation. In the absence of mechanisms imposing this selectivity, a saturating linear response would be expected (blue dotted line).
C. Sample EKAR3 and ERKTR measurements in single cells starved of growth factors and then stimulated at time 0 with 20 ng/mL EGF. Paired measurements from three individual cells are shown, and the mean for 489 cells below.
D. Scatter plot of initial peak amplitude on EGF stimulation, for 5935 single cells, stimulated with different EGF concentrations (indicated by color). Each point represents the peak EKAR3 and ERKTR signals for an individual cell within a 1.5-hour window after stimulation.
E. Spontaneous ERK activity pulses occurring in a single cell, stimulated at time 0 with 0.02 ng/mL EGF, reported by both ERKTR and EKAR3. Dotted orange and blue lines indicate the peak signal immediately following stimulation for ERKTR and EKAR3, respectively. Green and purple bars indicate the differences of subsequent peaks relative to the initial response.
F. Histograms of the peak ERKTR (left) and EKAR3 (right) initial pulse amplitude reached in single cells, when stimulated with various concentrations of EGF. For comparison, shaded gray regions show the fully stimulated distribution (20 ng/mL EGF) in all panels. Red lines indicate the mean values of the responding population in each condition; responders were are defined as cells whose peak ERK activity is below the 95th percentile of the EGFRi (gefitinib) treated population (dashed lines). See also Fig. S1.
G. Quantification of responding cells as detected by EKAR3 and ERKTR for multiple doses of EGF (as defined in F).
H. Individual cell traces of EKAR3 following EGF stimulation, imaged at higher time resolution (2 min), demonstrating the increase in initial slope of EKAR3 with EGF concentration.
I. Distributions of initial slope (maximum derivative within 30 min following stimulation) in EKAR3 following stimulation by EGF at different concentrations. Red bars indicate medians.
Because ERK acts to increase the abundance of ETG proteins at the levels of both synthesis and turnover, the system forms a coherent feedforward loop (cFFL)(Mangan et al., 2003). This motif can potentially filter ERK inputs by responding to pulses of long, but not short, duration and driving approximately binary (all-or-none) expression of ETG proteins (Mackeigan et al., 2005; Murphy et al., 2004; Murphy et al., 2002; Nakakuki et al., 2010), a behavior termed “persistence detection” (Purvis and Lahav, 2013). Other studies have concluded that the amplitude (or peak response) of ERK activity qualitatively changes gene induction levels (Kwong et al., 2012; Woods et al., 1997). Thus, the nature of ETG regulation remains unclear, in part because studies to date have only tested a small number of conditions and used population-average or fixed cell methods. While a common interpretation of the existing data is that ETG expression is preferentially (that is, non-linearly) sensitive to the duration of ERK activity (Legewie et al., 2005), it remains possible that ETGs respond more consistently to other patterns or to the integrated or cumulative ERK activity profile (Fig. 1B). A more exact understanding of the input-output behavior of ETG expression is needed because these characteristics determine whether modulation of ETG expression by growth factors or drugs is sufficient to alter cell function.
Here, we describe a multiplexed combination of live-cell reporters to simultaneously track dynamic activity of ERK signaling and induction of Fra-1. This combination allows us to directly measure the correspondence between the kinetics of ERK activity and the rate of Fra-1 protein production in the same cell, which was not possible with previous methods. We describe an extensive analysis of how the activation of Fra-1 is affected by both the amplitude and duration of ERK activity, as controlled by both growth factor availability and small molecule inhibitors. At both the population and the single-cell level, ERK amplitude and duration both contribute to the induction of Fra-1, such that the expression level of Fra-1 protein linearly reflects the integral of ERK activity. We incorporate this behavior into a generalized mathematical model that explains how the same gene expression motif can generate either rapid, high-gain linear responses or non-linear persistence detection of ERK activity duration.
Results
ERK response to growth factors combines digital and analog features
To assess how downstream effectors respond to ERK signals, it is first necessary to accurately measure ERK kinase activity. We used two genetically encoded live-cell reporters, a Förster Resonance Energy Transfer (FRET)-based Erk activity reporter (EKAR3) and a translocation-based reporter (ERKTR) (Regot et al., 2014)(Fig. 1A). Both reporters produce a ratiometric signal that is related to ERK activity (see STAR Methods for details of ratio calculations). EKAR3 and ERKTR detect sporadic pulses of ERK activity with similar but distinct kinetics; EKAR3 rises faster and attenuates more slowly than ERKTR (Sparta et al., 2015). To reliably detect ERK activity, we measured the ERK response to increasing EGF concentrations following a period of growth factor withdrawal in cells expressing both EKAR3 and ERKTR (Fig. 1C, S1). Both reporters responded rapidly to stimulation (rising by 2–4 minutes), but ERKTR typically peaked at 6–20 minutes and then rapidly declined to 50–75% of its peak value, while EKAR3 peaked immediately and maintained a plateau for 3 or more hours, suggesting it may have reached saturation. Comparing the initial response amplitudes across various doses of EGF revealed that EKAR3 and ERKTR respond to different segments of the ERK dynamic range, with EKAR3 sensitive at lower activity levels and ERKTR at higher levels (Fig. 1D). Moreover, at lower EGF doses ERKTR, but not EKAR3, measured sporadic pulses as lower amplitude than the first pulse (Fig. 1E, cf. green and purple bars). While sporadic pulses of ERK activity were previously reported to be quantal in size (Albeck et al., 2013), this uniformity is likely an artifact of the saturation of FRET-based reporters. Alternatively, it is possible that nuclear phosphatases induced by ERK activity attenuate ERKTR preferentially, due to its differential localization (Shah et al., 2017).
It has remained ambiguous whether ERK responses are digital/bimodal (Altan-Bonnet and Germain, 2005; Das et al., 2009; Ferrell and Machleder, 1998) or analog (O’Shaughnessy et al., 2011; Sturm et al., 2010) with respect to EGF dose. To address this question using the advantages of both reporters, we built dose response distributions by resolving the peak signal in each cell. At doses of EGF >2ng/ml, both reporters indicate that essentially 100% of cells respond with a uniformly high amplitude signal (Fig. 1F,G). Conversely, treatment with inhibitors of EGFR or MEK reduced all cells to a uniformly low ERK reporter signal, allowing us to set threshold criteria, above which signals were considered specific ERK responses (Fig. 1F). At 0.02 ng/ml EGF, the fraction of responding cells fell to 80%, assessed by the more sensitive EKAR3 (58% when using ERKTR; Fig. 1G). For the same EGF stimulus, we used ERKTR to distinguish peak ERK activity and found that the median amplitude for responding cells was 38% lower at 0.02 compared to 20 ng/ml EGF (20% lower for EKAR3; Fig.1F). When stimulated only with unsupplemented medium, 65% of cells displayed a detectable ERK response, with an even lower median (58% lower than with 20 ng/ml EGF). The rate of reporter signal increase also rose with increasing EGF dose (measured by EKAR3; Fig. 1H,I). Another EGFR ligand, amphiregulin, displayed essentially identical dose response characteristics (Fig. S1). These data indicate that ERK activity in individual cells does not respond in a strictly digital manner to EGF and similar ligands. Instead, ERK activity reflects the stimulus strength in its amplitude and rate of activation, but with an increasing fraction of refractory cells at lower concentrations of EGF.
Fra-1 production rate responds linearly to ERK activity
To enable dynamic measurements of ERK-responsive gene expression, we used CRISPR-mediated homologous recombination to insert monomeric, fast-folding fluorescent protein tags (mVenus or mCherry) as in-frame fusions at the C-terminus of the FOSL1 locus (Fos-related antigen 1, encoding Fra-1; we refer to this genomic reporter as Fra-1::mVenus or Fra-1::mCherry). Correct integration was confirmed via western blot and genomic PCR; in cells, the nuclear Fra-1::mVenus signal was clearly distinguishable from autofluorescence (Fig. S2). Integration of fluorescent protein tags into the genome is a reliable method to track gene expression from endogenous loci (Ghaemmaghami et al., 2003), and allows the net effect of transcriptional induction and stabilization by ERK to be monitored. We also introduced a destabilized, nuclear-localized fluorescent protein (NLS-mCerulean-d2, or NCd2) under a generic viral promoter/enhancer, to serve as a control for variation in the global rates of transcription and translation (Fig. 1A). Constitutive degradation of NCd2 is controlled by an ornithine decarboxylase PEST sequence that is distinct from the Fra-1 PEST and is not regulated by phosphorylation.
To establish baseline ERK and Fra-1 levels, we withdrew growth factors for 48 hours. Under these conditions, baseline ERK activity was undetectable by EKAR3 (Fig. S2), while Fra-1 decreased to low but detectable levels (Fig. 2A, S2). We then exposed cells to different concentrations of EGF to produce initial ERK responses of varying intensity. Upon stimulation, Fra-1 began to rise within 12–24 minutes and continued to increase gradually over the course of 24 hours, while NCd2 began to rise after 2 hours (Fig. 2A, Supplemental Movie 1). To evaluate the direct relationship between ERK activity and Fra-1 expression, we focused on the initial rate of Fra-1 increase following stimulation, as this response is less likely to be affected by global cellular changes induced by active ERK. ERKTR was used to measure ERK activity, as it is most responsive to the higher amplitudes initially achieved upon stimulation by different EGF doses (see Fig. 1C–E). Collating experimental data across multiple EGF concentrations to span the full range of ERK activity levels, we found that the rate of Fra-1 increase rose linearly as a function of the amplitude of ERKTR (Fig. 2B). In contrast, the rate of NCd2 accumulation was approximately constant across all ERKTR intensities (Fig. 2C), indicating that the early relationship between ERK and Fra-1 induction was specific and not the result of global changes in protein production.
Figure 2. Measuring Fra-1 production as a function of ERK activity.
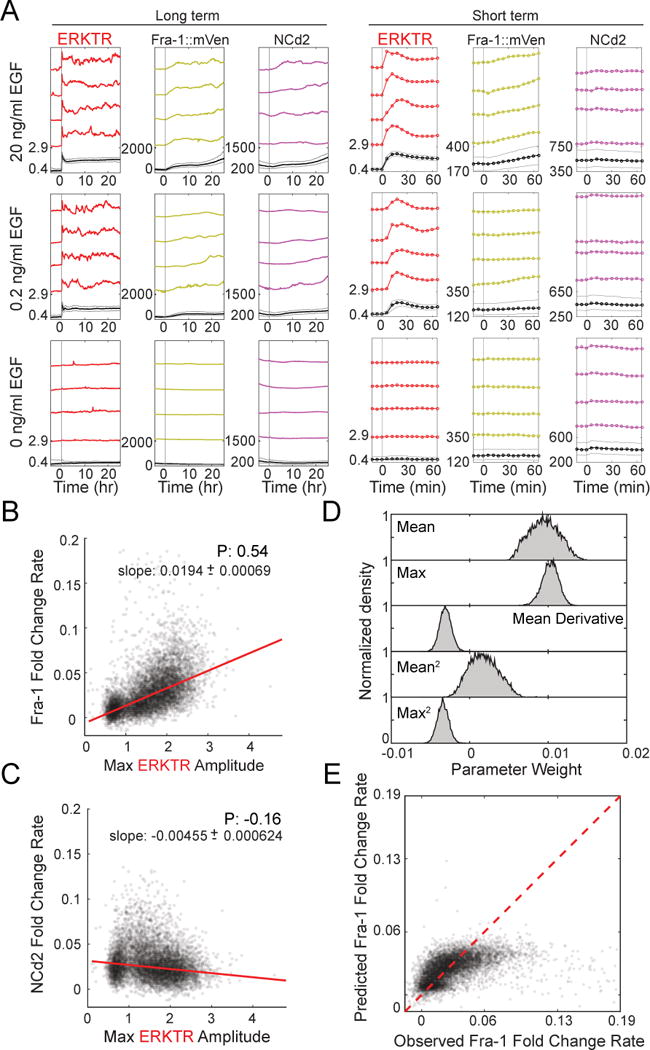
A. Mean and representative single-cell time course measurements of ERKTR, Fra-1::Venus and NCd2 in the same cells following stimulation with 20, 0.2, or 0 ng/mL EGF. Prior to imaging, cells were cultured in the absence of growth factors for 48 hours, then stimulated with EGF at different concentrations. Four single cells and the mean (with 25th–75th percentile range as gray lines) are shown for each concentration of EGF, on both long and short time scales.
B. Correlation between stimulated ERK activity and Fra-1 production rate. The maximum amplitude of ERKTR is plotted against the maximum slope of Fra-1::mVenus fold change within the first 60 minutes following EGF stimulation for each cell. Cells from multiple conditions are combined on a single plot. Red line represents a linear regression fit. P: Pearson’s correlation; slope is indicated with 95% confidence intervals.
C. Correlation between stimulated ERK activity and NCd2 production rate. Plot was constructed as in (B), using NCd2 instead of Fra-1::mVenus.
D. Contributions of ERK parameters to a PLSR model of Fra-1 expression. A PLSR model was constructed using the mean, maximum amplitude, mean derivative, and squared terms of ERKTR over the first 60 minutes following EGF treatment as inputs, and maximum slope of Fra-1 intensity as an output. Parameter weight distributions were generated by bootstrapping 8629 cells with replacement 10,000 times. ERKTR was used because of its broader amplitude response
E. Prediction of Fra-1 rate by linear modeling of ERK signal terms, plotted against measured Fra-1 value. Values falling on the red line are predicted exactly by the model.
To comprehensively evaluate possible relationships between ERK and Fra-1 within each cell, we considered the maximum rate, peak amplitude, or mean amplitude of ERKTR during the first hour, as well as the squares of these metrics. We performed Partial Least Squares Regression (PLSR) analysis, which reduces the complexity of the data and identifies the aspects of the input data set most predictive of the output (Fra-1 expression). We found that mean and maximum amplitude were the most predictive of the rate of Fra-1 accumulation (Fig. 2D). When comparing the predictions of the resulting PLSR linear model to the observed Fra-1 output, we find the expected linear 1:1 relationship with considerable variance, but also a discrepancy where the model fails to predict the highest levels of Fra-1 expression (Fig. 2E). This discrepancy could arise because ERKTR (like EKAR) may eventually reach saturation and fail to provide an accurate measurement at very high ERK activity; alternatively, ERK-independent factors may drive high expression in some cells. Together, these analyses support a mass-action model in which, within minutes of EGF stimulation, the rate of Fra-1 accumulation is linearly regulated by the intensity of ERK activity.
Total Fra-1 expression responds linearly to ERK activity duration
To assess the effects of the feedforward stabilization motif, we performed longer-term experiments inducing varied durations of ERK activity, directly testing the hypothesis that ETG responses are refractory to short duration ERK activity. To generate ERK activity pulses of uniform amplitude, we used a high concentration of EGF to maximally stimulate ERK, followed by a MEK inhibitor at varying times ranging in duration from the shortest achievable pulse (approximately 24 minutes) to 10 hours (Fig. 3A, S3). We found that even the shortest ERK activity pulses induced detectable Fra-1 expression (Fig. 3B), as well as an increase in NCd2 (Fig. 3C). While the response of Fra-1 depended strongly on the duration of stimulation, NCd2 displayed a more uniform increase regardless of ERK activity duration (Fig. 3C, D), indicating that Fra-1 is specifically responsive to ERK while NCd2 reflects a general increase in expression capacity. Pretreatment with a MEK inhibitor reduced the amplitude of Fra-1 and delayed it to a similar timescale as NCd2 (Fig. 3B,C), confirming that NCd2 reflects a non-specific component that likely results from EGF stimulation of other mitogenic pathways. Comparing the mean Fra-1 area under the curve (AUC) or peak intensity to the duration of ERK stimulation, we found a linear relationship, regardless of normalization (Fig. 3E and S3). At longer durations of ERK activity (>6 hours), the expression of Fra-1 approached a saturation level, but we did not observe a minimum duration of ERK activity for Fra-1 induction (Fig. 3E, S3), or a bimodal response with an increasing proportion of Fra-1 expressing cells (Fig. 3F). Together, these data suggest that Fra-1 responds proportionally to cumulative ERK activity, rather than requiring a minimum duration of stimulation, across the practical range of durations of ERK activity. This analysis complements the above findings (Fig. 2) that establish a linear response to ERK activity intensity after a 12–24 minute delay, indicating that Fra-1 induction is controlled primarily by the cumulative integral of ERK activity.
Figure 3. Fra-1 induction as a function of ERK activity duration.
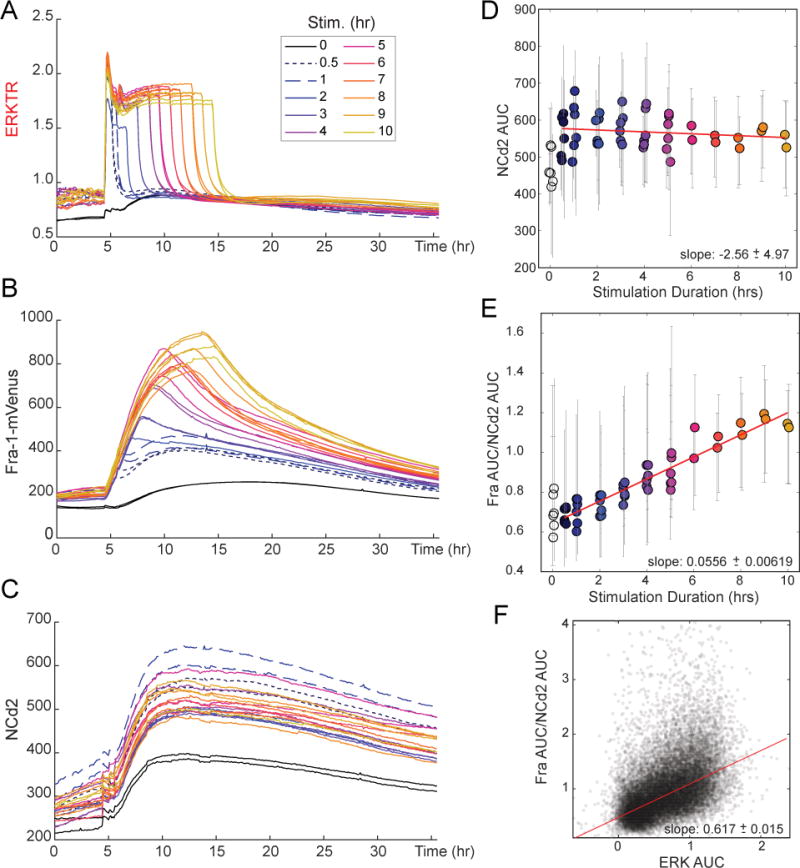
A–C. Response of Fra-1 to ERK pulses of varying duration. MCF10A cells expressing Fra-1::mVenus, ERKTR, and NCd2 were cultured in the absence of growth factors for 48 hours and then stimulated by 20 ng/ml EGF. At various times following EGF treatment, ranging from 30 minutes to 10 hours, 100 nM PD0325901 was added to acutely inhibit ERK activity. Stimulation duration 0 received PD 15 hours prior to EGF stimulation. Plots indicate the population mean values for ERKTR cytoplasmic/nuclear ratio (A), Fra-1::mVenus intensity (B), and NCd2 intensity (C); lines are color coded according to the interval between stimulation and inhibition.
D, E. Plot of population-averaged AUC of NCd2 (D) or Fra-1::mVenus normalized to NCd2 (E) as a function of the interval between EGF addition and PD325901 addition. Error bars show 25th – 75th percentile range. Red line indicates linear fit. Data were also fit to a library of nonlinear models, and the linear model was chosen as the most parsimonious by Akaike’s Information Criterion. AUC was used to reflect the net Fra-1 output for the single defined ERK pulse. Regressed slopes are indicated with 95% confidence intervals. See also Fig. S3.
F. Scatter plot of single cell measurements of Fra-1::mVenus (normalized as in E) plotted against ERKTR area under the curve. Red line indicates linear fit.
Fra-1 expression integrates ERK activity across pharmacological conditions
Pharmacological inhibitors that act at different parts of the pathway (denoted EGFRi, MEKi, and ERKi) have distinct effects on the kinetics of ERK activity (Fig. 4A, S4)(Albeck et al., 2013). We therefore investigated whether Fra-1 production would still respond proportionally when ERK activity was suppressed by each of these compounds. As indicated by both EKAR3 and ERKTR reporters, ERK activity following EGFRi (gefitinib) treatment was initially suppressed, but then rebounded to a pulsatile state after a period of hours, consistent with the suppression of negative feedback loops (Duncan et al., 2012). With MEKi, a similar rebound occurred, but ERK activity reverted instead to an intermediate level with a moderate degree of pulsatility (with trametinib showing a slightly higher degree of pulsatility than PD325901). ERKi (SCH772984) induced a sharp drop in ERK activity that was maintained for 10–30 minutes, followed by a rapid rebound to a very stable level of ERK activity. These differences provide a means to test the response of Fra-1 to widely varying ERK kinetics.
Figure 4. Fra-1 expression in response to pharmacological modulation of ERK activity patterns.
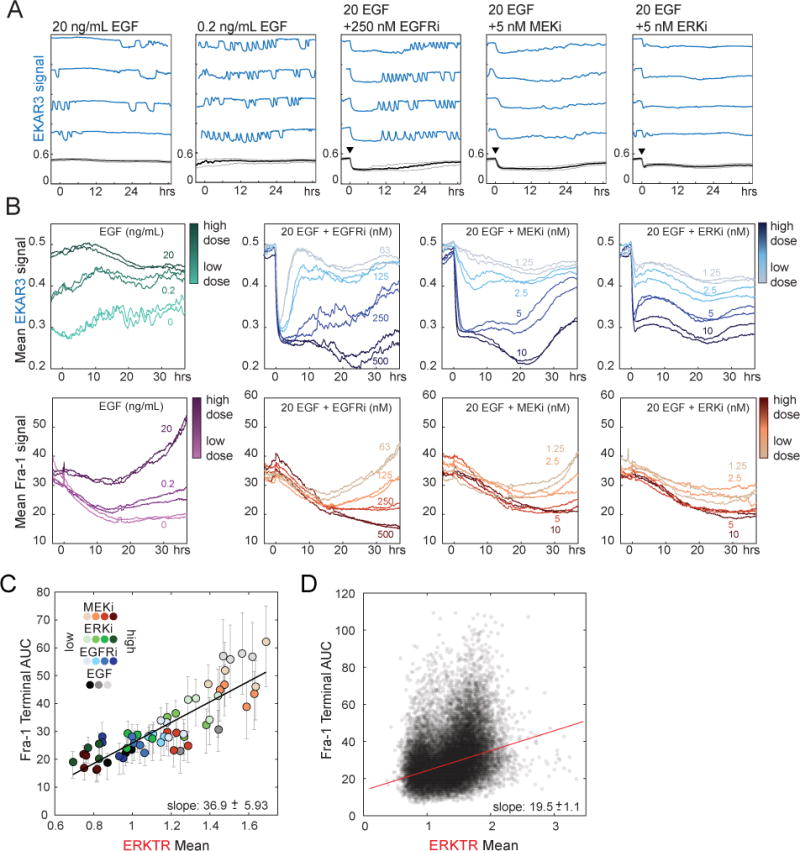
A. Single-cell responses of ERK activity to inhibitors. MCF10A cells expressing EKAR3 were cultured in imaging medium containing 20 or 0.2 ng/ml EGF and treated with inhibitors of EGFR (gefitinib), MEK (trametinib), or ERK (SCH772984) at time 0 (arrows). Each plot shows the mean value in black at the bottom, with lighter gray lines representing the 25th and 75th percentile. Colored lines above the mean depict four randomly selected single cells for each condition, plotted with the same scaling as the mean. The higher-sensitivity EKAR3 is used here to show low ERK activity under inhibition; see Fig. S4 for corresponding ERKTR data.
B. Population responses of ERK activity and Fra-1 expression to the indicated inhibitors. Cells were cultured in the presence of EGF and treated at time 0, at concentrations indicated by line color.
C,D. Correlation of integrated ERK activity with Fra-1 expression across pharmacological conditions. In (C), each point represents the population average, for one drug condition, of Fra-1 intensity plotted against integrated ERKTR cytoplasmic/nuclear ratio; replicate experiments are shown individually. Measurements were made for a 20-hour window beginning 17 hours following drug treatment. Fra-1 intensity is quantified as AUC during the final hour of the 20-hour window to reflect the steady state response to the preceding ERK activity, which is represented as AUC over the 20-hour window. In (D) each point represents a single cell measurement of ERKTR and Fra-1, calculated over the same interval as in (C). Cells from all conditions are pooled, a total of 24,620 cells. ERKTR is used here to capture the wide dynamic range across all conditions; corresponding EKAR3 data shown in Fig. S4.
When mean Fra-1 trajectories were examined for each drug, Fra-1 levels decreased upon the initial inhibitor treatment, but gradually recovered after ~24 hours, correlating approximately with the time of ERK recovery (Fig. 4B). At the level of cell populations, when the integrated ERK activity was compared to final level of Fra-1 expression during a 20-hour period spanning the recovery phase, we found a correlation across all drug conditions (Fig. 4C, S4), in accord with the linearity described above in the relationship between ERK activity and Fra-1 expression. The variation in ERK waveform between drugs did not appear to have a strong influence on Fra-1 recovery. At the single-cell level, we observed a high degree of variability within populations (Fig. 4D). Potentially, this variability could reflect either non-ERK contributions or a failure to identify the correct attributes of the ERK signal responsible for controlling Fra-1 expression. Therefore, to investigate the relationship of ERK to Fra-1 we applied PLSR modeling to a collated dataset containing a wide range of ERK activity patterns assembled from EGF and inhibitor concentrations over multiple independent experimental replicates, using both mVenus and mCherry-tagged versions of Fra-1.
To create the input vector for PLSR we reduced each single cell’s ERK activity trace to a set of 8 scalar values, including mean activity, pulse frequency, and mean pulse duration (Fig. 5A, Table S1). The predictive capacity of these models varied between 20% and 60% depending on the conditions included in the dataset. As a control, models in which ERK and Fra-1 signals were randomly paired predicted less than 1% of Fra variance, indicating that a common trend in both ERK activity and Fra-1 induction did not artificially elevate estimates of prediction capacity. When using the broadest set of conditions and the EKAR/Fra1::mCherry configuration (as shown in Fig. 4C), the model improved only negligibly beyond the first component, which explained 32% of variance in Fra-1 (Fig. 5B). We examined the PLSR weights in this component to determine the relative importance of the 8 dynamic features on the response variable (Fra-1 AUC over the last hour of the modeled interval). Mean and mean-squared ERK activity were weighted most heavily, with a more moderate contribution from maximum ERK activity; similar weightings were observed across all of the data sets considered (Fig. 5C, S5, and Table S2). These weightings again suggest that integrated (or mean) ERK activity is the primary determinant of Fra-1 expression within single cells. The weighting of the mean-squared term potentially indicates a non-linearity in the induction process, but models constructed without the mean squared term were still able to capture 31% of the variance in Fra-1, while omitting both mean and mean-squared reduced predictive capacity to 16% (Fig. 5B). Notably, the mean and mean squared alone were capable of explaining 28% and 30% of variance, respectively. When model predictions of Fra-1 expression are compared to observed values on a cell-by-cell basis (Fig. 5D), the variance not explained by the models was accounted for by both a spread around the central relationship, and by a subpopulation of 17% of cells for which the model under-predicted Fra-1 expression. Altogether, this comprehensive analysis of the dependence of Fra-1 expression on single-cell measurements of ERK indicates that 1) the relationship between ERK activity and Fra-1 expression is approximately linear across many conditions, 2) the specific dynamic form of ERK activity has little influence on the expression of Fra-1, and 3) other factors beyond ERK are likely to exert a strong influence on the Fra-1 expression level in a given cell.
Figure 5. PLSR modeling of the ERK-Fra-1 relationship across all conditions.
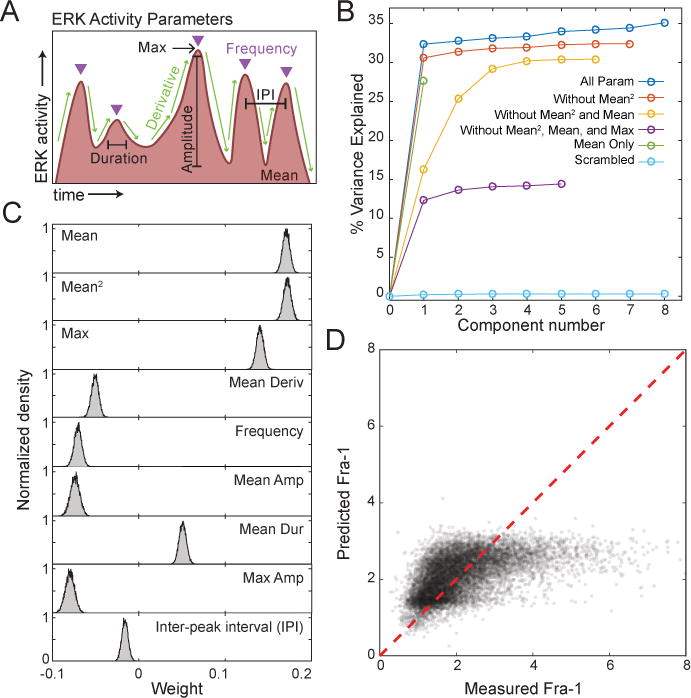
A. ERK activity metrics for single cells. Triangles indicate peak position; IPI, inter-pulse interval. For subsequent PLSR analysis, per-peak metrics were summarized on an individual cell basis, using the average or maximum as indicated in (C), over all measured peaks for that cell.
B. Predictive capabilities of PLSR models for Fra-1 expression (measured by percent of total variance explained) using different combinations of ERK activity measurements (by EKAR3). For the “scrambled” model, pairings between input and output measurements for each cell were randomly reassigned. Models generated using ERKTR data (Fig. S5) showed similar trends but lower predictive capacity, possibly due to sampling bias within the dataset that included large numbers of low-ERK conditions.
C. Contributions of ERK parameters to the PLSR model. Distributions of parameter coefficients generated by bootstrapping with replacement 10,000 times.
D. Prediction of Fra-1 maximum value by linear modeling of ERK signal terms, plotted against measured maximum Fra-1 value. The PLSR model was constructed using the EKAR3 features in (A) over the 20 hour window, with the endpoint value of Fra-1 intensity as the output. Non-linear dependence was assessed by including mean squared in the PLSR. Red line represents perfect prediction of the data by the model.
Stabilization of pre-existing Fra-1 enables linear expression responses
Given that cFFLs, such as the one connecting ERK and Fra-1, can in principle produce nonlinear responses to ERK duration, we sought to understand why Fra-1 accumulation is essentially linear with respect to ERK activity duration. We constructed a minimal mathematical model comprising ERK phosphorylation of a transcription factor that promotes Fra-1 mRNA production and ERK-mediated stabilization of Fra-1 protein (Fig. 6A). The minimal model retains the structure of the known system and includes an explicit delay on the production of new protein but avoids the additional complexity of cooperativity or modeling every intermediate; it is thus situated to predict conditions giving rise to persistence detection but conservatively represent their magnitude. We analyzed model conditions necessary for persistence detection by numerically simulating the time-dependent accumulation of Fra-1 over a screen of model parameters (Fig. S6, Table S3, STAR Methods).
Figure 6. Model analysis predicts linear response with baseline Fra-1.
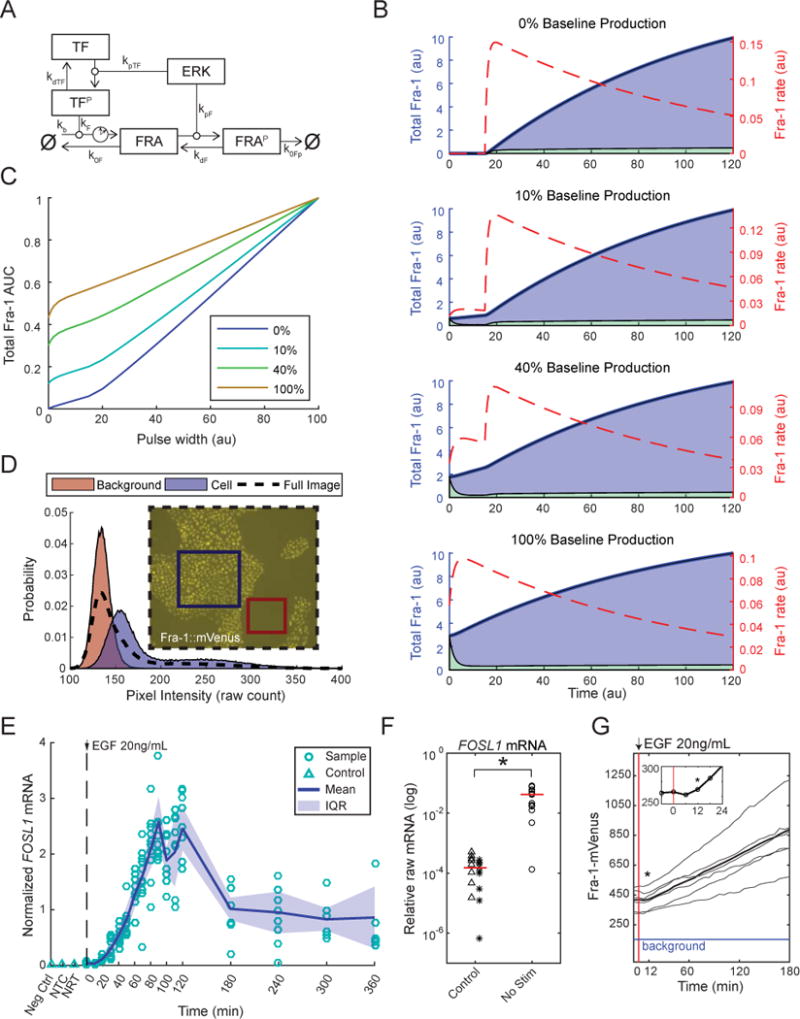
A. Network diagram of the delay differential equation analyzed and simulated. Delay (clock symbol) is included for the stimulated production of Fra-1 by activated transcription factor (TFP). See STAR Methods for a full description of the model.
B. Minimal model simulations with various relative levels of baseline Fra-1 production (percentage given by 100 * kb/(kb + kF)). Total Fra-1 (shaded regions) is plotted against left axes; lower (green) and upper (blue) regions correspond to naïve and stabilized Fra-1 respectively. Fra-1 accumulation rate (dashed line) is plotted against right axes. Models were simulated with ERK activity beginning at time 0 and a 15 time-point delay for Fra-1 production; the effect of baseline production is most apparent in this window at the start of each simulation. See also Fig. S6.
C. Simulated experiments with varied ERK pulse width, using the same parameter values as plots in B. The total Fra-1 AUC was calculated for square waves of ERK activity, performed with different relative baseline production levels (indicated in legend). Fra-1 AUC is plotted against the duration of ERK activity (as in Figure 3E).
D. Sample image and pixel intensity histograms from cells expressing the Fra-1::mVenus fusion, after growth factor withdrawal for 48 hours and treatment with MEK inhibitor for another 15 hours. Histograms shown for regions indicated in the image: background only (red), cells (blue), whole frame (dashed line).
E. Time course measurement of Fra-1 mRNA in MCF-10A cells, by RT-qPCR. Cells were cultured without growth factors for 48 hours, then stimulated with 20 ng/ml EGF and lysed for RNA extraction at ten-minute intervals up to 2 hours, followed by 1-hour intervals to 6 hours. Data were compiled from 3 replicate RNA extractions, with at least 2 replicate qPCR measurements per sample. NTC: No Target Control, NRT: No Reverse Transcription; IQR: Inter-Quartile Range, from 25th to 75th percentile.
F. Comparison of RT-qPCR measurements of Fra-1 mRNA in unstimulated cells (48 hour growth factor withdrawal) to NTC (stars) and NRT (triangles), shown on a log scale. These data are not normalized to the control, HINT1. Red line indicates median.
G. Early Fra-1 response following EGF stimulation (red line). Data for Fra-1::mVenus in cells cultured in the absence of growth factors for 48 hours and then stimulated with 20 ng/ml EGF are re-plotted from Fig. 3 to clarify early dynamics. Bold line indicates the population mean, and lighter lines represent 6 individual cells. Asterisk (*) indicates first time point significantly greater than baseline (p < 0.05). Blue line indicates the mean intensity of background (non-cell) pixels. Inset shows further magnification of the mean signal on a shorter time scale.
The model indicates that persistence detection depends critically on two parameter values in the production of Fra-1: delay and baseline. Delay arises from the synthesis time of mRNA and protein, and sets the minimal input signal duration needed to allow both arms of the cFFL to be simultaneously active. Baseline refers to mRNA (and protein) production either in the absence of stimulus (ERK) or due to pre-existing stimulus. If baseline Fra-1 mRNA production is significant, ERK stimulation immediately drives accumulation of the stabilized protein (Fig. 6B). Thus, the presence of baseline expression in any cFFL motif may prime the system to respond to stimuli shorter than its processing delay. The model therefore predicts that the linear response of Fra-1 could result from a short delay, a high baseline, or both. To evaluate the feasible range of experimental outcomes in light of the theoretical analysis, we simulated ERK pulse experiments, calculating the total Fra-1 AUC as a function of pulse duration (Fig. 6C). The simulated AUC varies in initial slope and curvature according to baseline levels, and is strictly linear in the long term. Comparing these curves to Fig. 3E and S3C,E, the long term linearity is well corroborated and the apparent short term linearity of the data implies an intermediate mixture of baseline and induced expression.
We further tested the applicability of the model by evaluating whether experimental measurements of Fra-1 (FOSL1) mRNA and protein were consistent with the prediction of significant baseline expression as well as transcriptional induction, and/or relatively short delays. Fra-1 protein expression in the prolonged absence of ERK activity, evidenced by non-zero intensity in serum-starved and inhibitor treated cells (Figs. 3B, 6D), suggests that baseline production is indeed substantial in this cell line. To evaluate transcription and processing delays, we measured FOSL1 mRNA at the population level over a time course and observed a statistically detectable increase within 20 minutes of EGF stimulation (p < 0.05), followed by accumulation reaching a maximum at ~1.5–2 hours (Fig. 6E), confirming transcriptional induction. Without stimulus, FOSL1 mRNA is significantly higher than RT controls, confirming non-zero baseline transcription (Fig. 6F, p<0.05). In comparison, increases in Fra-1::mVenus or Fra-1::mCherry fluorescence occurred on an equivalent or faster timescale, detectable within 12 minutes following EGF stimulation (Fig. 6G, p<0.05), consistent with Fra-1 protein already existing at the time of initial stimulus. Furthermore, the shortest spontaneous ERK activity pulses, or those achievable by timed stimulation-inhibition, are approximately 20 minutes long. That these are equivalent with the time required to produce FOSL1 mRNA and protein leaves little room for any practical ERK pulses to be effectively rejected even in the absence of any baseline FOSL1 mRNA. Together, these measurements indicate that the baseline expression and relatively short production delay of Fra-1 bias it against selectively excluding typical ERK pulses.
To evaluate the functional impact of transcriptional vs. stabilization control on Fra-1, we performed an experiment to measure the stabilization response independently. We used a reporter termed FIRE (Fra-1-based Integrative Reporter of ERK), in which the regulated PEST domain of Fra-1 is fused to a fluorescent protein and expressed under the control of a constitutive viral enhancer (Albeck et al., 2013), thereby reproducing only the degradation effects of Fra-1 without specific transcriptional control (Fig. 7A). We measured both the full feedforward system (Fra-1) and the non-feedforward, stabilization-only system (FIRE) in individual cells following stimulation with various concentrations of EGF. Strikingly, the time series traces of Fra-1::mVenus closely resembled those of FIRE (Fig. 7B), with median correlation of 0.78 – 0.88 vs. 0.27 – 0.55 against total RFP as a non-specific expression control (across multiple EGF doses, Fig. 7C). Directly comparing Fra-1 and FIRE fold change responses over time (Fig. 7D), the distributions of the two reporters overlap extensively, and at early times the median signals are indistinguishable. After 3 hours, the median Fra-1 signal continues to rise while the stabilization-only FIRE attenuates, consistent with a model in which the immediate increase following stimulation is due to stabilization of Fra-1 protein produced from pre-existing mRNA, while stimulated production of mRNA contributes to total Fra-1 levels at later times. Additionally, Fra-1 exhibits a median coefficient of variation 50% lower than that of FIRE, potentially resulting from the additional regulation acting at the endogenous promoter.
Figure 7. Comparative analysis of ETG responses between configurations and genes.
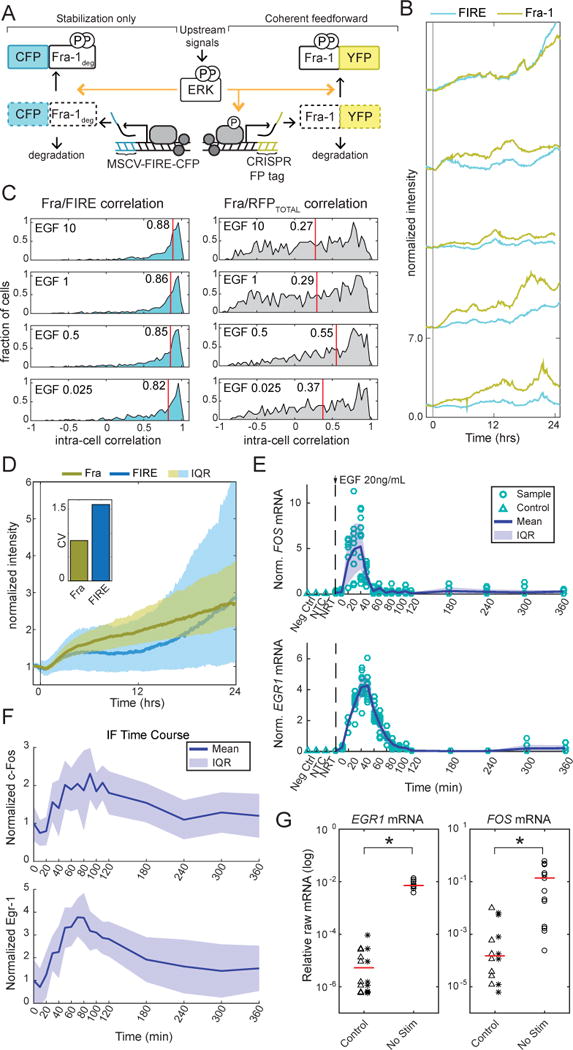
A. Schematic of FIRE/Fra-1 comparison experiment. FIRE consists of the Fra-1 degradation domain fused to mCerulean and expressed from a stably integrated constitutive viral promoter; relative to endogenous Fra-1 it lacks stimulated mRNA production.
B. Simultaneous measurements of Fra-1 and FIRE signals in five individual cells treated with 100 ng/ml EGF at time 0.
C. Distributions of correlations between Fra-1 and FIRE within individual cells. Pairwise Pearson’s correlation coefficients were computed between Fra-1::mVenus and FIRE signals for 4383 cells over a period of 60 hours following treatment with different EGF concentrations; mean values are shown as red lines and numbers. To control for the correlation of FIRE with general expression increases, the same calculations were made between FIRE and total (nuclear+cytosolic) ERKTR-RFP signal, which is not directly controlled by ERK activity (right panels).
D. Median intensities of Fra-1 and FIRE in cells treated with 1 ng/ml EGF. Shaded region indicates interquartile range across all cells. Inset plot shows median (across all time points) coefficient of variation between cells.
E. Measurements of c-Fos and Egr-1 mRNA by RT-qPCR. Cells were stimulated, analyzed, and annotated as in Fig. 6(E).
F. Measurements of c-Fos and Egr-1 protein abundance by immunofluorescence following growth factor withdrawal for 48 hours and stimulation with 20 ng/ml EGF at ten-minute intervals up to 2 hours, followed by 1-hour intervals to 6 hours. c-Fos data are compiled from 3 replicates. Egr-1 data are compiled from 2 replicates.
G. Comparison of RT-qPCR measurements of Egr-1 and c-Fos mRNA in unstimulated cells (48 hour growth factor withdrawal) to NTC (stars) and NRT (triangles), shown on a log scale. These data are not normalized to the control, HINT1. Red line indicates median.
Finally, we investigated the potential for variance in mRNA production parameters governing persistence detection among ETGs. We sampled the mRNA and protein kinetics of c-Fos and Egr-1 via RT-qPCR and immunofluorescence. In comparison to Fra-1 measurements, c-Fos and Egr-1 showed an earlier peak in both mRNA and protein abundance and a return to baseline levels within 2 hours of stimulation, suggesting additional negative regulation (Fig. 7E,F). EGR1 mRNA appears even faster (within 10 minutes, vs. 20 minutes for FOSL1 and FOS), though protein levels only become detectably higher at 20 minutes. EGR1 and FOS mRNA were also detectable even in the absence of stimulus (Fig. 7G, p<0.05). 1. Thus, all three ETGs analyzed share kinetic characteristics that make them weak discriminators of characteristic ERK pulses.
Discussion
Model analysis reconciles a linear Fra-1 response with past studies
At the center of quantitative signaling biology is the question of how the time-varying activation of an upstream regulator is converted into the time-varying outputs of downstream molecules, which ultimately alter cell fate (Kholodenko et al., 2010; Rhee et al., 2012). This process of information transfer can take many forms in principle, and remains poorly understood in many central mammalian signaling systems because of the difficulty of making adequate experimental measurements over time in the same cell. In this study, we developed a method to accurately track, in the same cell, both input and output for the ERK-ETG system, which has been heavily studied for both its relevance to human disease and its importance as a canonical model signaling system. Previous studies have highlighted the potential for this system to selectively transform the kinetics of ERK activity into different gene expression profiles. We show here that across many different conditions, the ETG Fra-1 is produced in essentially linear proportion to the integrated magnitude of ERK activity, and that the related ETGs c-Fos and Egr-1 are similar in their response characteristics.
Under some interpretations of previous data, a linear response appears to contrast with the concept of the ERK-ETG feedforward motif as a persistence detector discriminating between short and long pulses of ERK activity. This apparent conflict can be resolved by careful consideration of previous studies, in which ERK activity was manipulated using two different growth factors (e.g. EGF and NGF)(Murphy et al., 2002; Nakakuki et al., 2010), or several concentrations of a growth factor (Murphy et al., 2004) to generate either short- or long-lived average ERK activity in the cell lines examined. Because only a small range of ERK activity profiles were compared in each case, these studies were able to establish that greater duration of ERK activity increases the amount of ETG protein produced, but could not directly test the idea that longer pulses would preferentially induce the ETG. Similarly, in later studies that compared more conditions, head to head comparisons in which only ERK duration varied were not performed (Saito et al., 2013). Methodological differences also play a role in the apparent inconsistency, as the average responses previously measured by immunoblot have lower time resolution and more potential for non-linear readouts (Janes, 2015). Taken together, the existing body of data is neutral on the question of if (and when) ETGs respond linearly or non-linearly to ERK activity.
Our data agree with previous studies that the duration of an ERK activity period can be converted into differences in the peak and in the AUC (or mean) of ETG protein abundance. However, these properties are not specific to the feedforward motif of the ERK-ETG system. Intuition suggests, and modeling confirms, that creating a selective duration-sensitive response requires a delay between the initiation of ETG transcription and stabilization of the protein product. For the ETGs we examine here this delay is on the order of 10–20 minutes, and it is reasonable that we observe little evidence of selective persistence detection when growth factor stimulated ERK responses typically last >20 minutes. We emphasize that our analysis does not exclude the ability of ETGs (or their active forms) to conform to a non-linear persistence detector model, depending on their particular parameter values (i.e. production and degradation rates)(Uhlitz et al., 2017). Even within an individual cell, response profiles for different genes may vary, or the same gene could be reconfigured by changes in chromatin state or general transcription factor availability. While the topological motif of a gene circuit is often interpreted as an indicator of its behavior and function, we demonstrate that, in this case, topology can be misleading in predicting the output of a key gene regulatory event; this is consistent with theoretical studies that have emphasized the importance of parameter values over topology (Gutenkunst et al., 2007; Ingram et al., 2006). This importance is also evident at the level of EKAR3 and ERKTR, whose different parameters of response to phosphorylation yield distinct readouts to the same ERK activity pulse within the same cell. These data underscore that diversity in signaling responses is generated in part by differential tuning of the kinetic parameters specific to each effector (Pargett and Albeck, 2016).
Implications of linear Fra-1 response for tissue and cancer biology
The lack of persistence detection in Fra-1 regulation raises the question of what function the cFFL motif plays in cellular regulation. Among ETGs, Fra-1 is prominent in the homeostasis of epithelial tissues, and expression of Fra-1 induces epithelial to mesenchymal transition (EMT) and long-term cell motility (Vial et al., 2003). The capacity of the Fra-1 regulatory motif to integrate transient ERK signals may enable a cell to “remember” past ERK activity over hours or days, rather than reacting only to the immediate activity level. Such memory may increase the information transmission capacity of the pathway, preventing chance events from inducing inappropriate and costly cell fate choices. Our comparison of the native cFFL configuration of Fra-1 regulation to stabilization-only control indicates that the cFFL enables both a rapid high-gain response and a more linear accumulation over time than stabilization alone, which are useful attributes for integrative memory. Our data also suggest that the cFFL motif reduces variance of Fra-1 protein abundance relative to stabilization alone, consistent with the concept that accurate information transmission may require multiple parallel pathways (Hansen and O’Shea, 2015). Notably, we also observe a high degree of variability in population-level FOSL1 mRNA measurements (Fig. 6E, >2 hours), which may suggest that the motif can perform dosage compensation. Together, the characteristics of Fra-1 regulation are consistent with the ability to reliably express this transcription factor in proportion to frequently fluctuating ERK inputs, which may be important for maintaining epithelial tissue integrity.
A precise kinetic understanding of ETG responses and their variance could allow more effective therapeutic use of ERK pathway inhibitors (Ryan et al., 2015). Overexpression of Fra-1 has been linked to metastasis in multiple cancer types (Chiappetta et al., 2007; Zhong et al., 2016) and in breast cancer drives a cancer stem cell-like gene expression program (Tam et al., 2013). Conversely, in liver pathology, loss of Fra-1 expression and replacement by c-Fos result in fatty liver disease (Hasenfuss et al., 2014). Ideally, predictive models of multiple ETGs would identify pharmacological conditions that best manipulate the kinetic profile of ERK to restore healthy gene expression profiles. The small subset of cells (<20%) that we observe falling outside the linear trend with higher than expected Fra-1 levels may also be of particular importance under pathological conditions. Identifying parallel mechanisms of regulation, such as local histone modifications that alter the range of Fra-1 mRNA copies produced during an ERK activation event, may explain the remaining variance and provide additional strategies to manipulate Fra-1 expression.
STAR METHODS
CONTACT FOR REAGENT AND RESOURCE SHARING
Further information and requests for resources and reagents should be directed to and will be fulfilled by the Lead Contact, John Albeck (jgalbeck@ucdavis.edu)
EXPERIMENTAL MODEL AND SUBJECT DETAILS
Cell culture and media
MCF-10A 5E cells (Janes et al., 2010) were used for all experiments. Cells were cultured in DMEM/F12 supplemented with 5% horse serum, 10 ng/mL insulin, 500 ng/mL hydrocortisone, 100 ng/mL Cholera Toxin, 20 ng/mL EGF, and 50 μg/mL Penicillin/Streptomycin. Cells were maintained in 10 cm plates and passaged approximately every 4 days. For imaging, cells were cultured in DMEM/F12 lacking phenol red, folate, and riboflavin, supplemented with 0.1% BSA, hydrocortisone, and cholera toxin; EGF and inhibitors were added at the indicated concentrations.
METHOD DETAILS
Reporter cell line construction
MCF10A cells with FP tags inserted at the endogenous FOSL1 locus were generated by transfecting cells with a pX330 plasmid (Cong et al., 2013) carrying the Cas9 gene and an sgRNA guide specific for FOSL1 together with a plasmid homology repair template carrying either mCherry or mVenus, flanked on either side by 1.4 kB of FOSL1 genomic sequence. Positive integrants were selected by fluorescence-based cell sorting, and clonal populations were isolated. Correct integration was confirmed by sequencing of PCR products amplified from genomic DNA and by immunoblotting to confirm a 26 kDa shift in the molecular weight of Fra-1 corresponding to the FP tag. NCd2, ERKTR, and FIRE reporters were introduced using retroviral gene transfer, and the EKAR3 reporter was stably integrated using the piggyBAC transposase system (Pargett et al., 2017). For each reporter configuration shown in the paper, clonal cell lines were derived and used for analysis to eliminate heterogeneity arising from different integration sites.
Live cell microscopy and data processing
Multi-well plates with #1.5 glass bottoms were coated with collagen and seeded with reporter cell lines. Prior to imaging, growth medium was replaced with a custom imaging medium, iGM-base (DMEM/F12 lacking phenol red, riboflavin, and folic acid and supplemented with 0.1% BSA, hydrocortisone, and cholera toxin). Prepared culture plates were imaged on a Nikon Ti-E inverted microscope with a stage-top incubator to maintain the culture at 37°C and 5% CO2 throughout the experiment. Microscopy and image processing were performed as described previously (Pargett et al., 2017). Briefly, imaging sites within each well were selected and imaged sequentially at each acquisition time, automated via the NIS-Elements AR software. Images were captured using a 20×/0.75 NA objective and an Andor Zyla 5.5 scMOS camera.
mRNA isolation and RT-qPCR
MCF-10a cells were cultured in 10 cm dishes to approximately 50% confluence, and growth factors were withdrawn for 48 prior to the start of a time course. Cells were stimulated with 20 ng/ml EGF, followed by lysis for RNA isolation at 17 time points: 0 (no stimulation), 10, 20, 30, 40, 50, 60, 70, 80, 90, 100, 110, 120, 180, 240, 300, and 360 minutes. Lysis and isolation employed the Macherey-Nagel NucleoSpin RNA kit or the Invtrogen RNAqueous total RNA Isolation kit. RNA isolates were reverse transcribed using a poly-T primer to select for mRNA, and amplified under conditions preserving linearity (Janes et al., 2010), accompanied by No-Target and No-Reverse-Transcription controls. qPCR of the resulting cDNA was performed with Taq polymerase and the SYBR Green dye on a Bio-Rad CFX-96 Touch, using the primers listed under Key Resources. Three replicate time courses and RNA isolations were performed. For each, two replicate qPCR plates were prepared per target gene, with some replicate wells per plate (typically for early time points). All qPCR measurements were fit to a standard curve made by serially diluting purified amplicon on each plate. All qPCR measurements were normalized to HINT1, which was, on average, invariant across the time course. Control data (negative, NRT and NTC) were normalized by the mean of the HINT1 samples. Comparisons against control values were made without normalization to HINT1. Data were excluded from the analysis only for experimental error (e.g. missed wells or contamination indicated by grossly outlier values).
Immunofluorescence microscopy
After growth and treatment as indicated on glass-bottom 96-well plates, cells were fixed for 20 min at room temperature with a freshly prepared solution of 4% paraformaldehyde in PBS and permeabilized with 1% Triton X-100. Samples were then stained with primary and secondary antibodies in PBS+0.1% Triton X-100+2% bovine serum albumin, and images were captured on a Nikon Ti-E inverted microscope with a 20×/0.75 NA objective with an Andor Zyla 5.5 scMOS camera.
QUANTIFICATION AND STATISTICAL ANALYSIS
Image processing
Imaging data were processed to segment and average pixels within each identified cell’s nucleus and cytoplasm, using a custom procedure written for MATLAB (Pargett et al., 2017). The procedure accessed image data from ND2 files generated by NIS Elements, using the Bio-Formats MATLAB toolbox, and tracked single cell positions over time using uTrack 2.0 (Jaqaman et al., 2008). The resulting single cell time series traces were filtered for quality (minimum length of trace, maximum number of contiguous missing or corrupt data points), and ratiometric reporter levels calculated. EKAR3 level was calculated as , where CFP and YFP are the pixel intensities of the cyan and yellow channels, respectively, and RP is the ratio of total power collected in cyan over that of yellow (each computed as the spectral products of relative excitation intensity, exposure time, molar extinction coefficient, quantum yield, light source spectrum, filter transmissivities, and fluorophore absorption and emission spectra). ERKTR level was calculated as ICyto/INuc., where ICyto and INuc are the average fluorescent intensities in the cytoplasm and nucleus, respectively.
Linear Fitting
Linear regression analysis was preformed using a MATLAB implementation of the Theil-Sen estimator, which is insensitive to outliers and robust to heteroskedastic data.
Partial Least Squares Regression
To parameterize dynamic data, each single cell ERK time trace was processed to calculate features (see Table S1). Distinct pulses in dynamic data were identified by a customized procedure implemented in MATLAB. To be robust to noise and baseline drift, pulses were defined by where the intensity rises/falls across both a minimum peak threshold and maximum valley threshold, defined as 33% and 60% of the local signal (35 time points). Mean derivative was defined as the average absolute value point-to-point difference over the entire time window. Mean duration, mean amplitude, and max amplitude calculated from all peaks within the window. Inter-peak-interval (IPI) calculated as the distance between the centers of sequential peaks. The MATLAB implementation of the SIMPLS partial least squares regression algorithm was employed to fit paired data sets to a linear model. Data were first centered by subtracting the mean from each parameter and input parameters were scaled to unit variance.
Normalization and Statistical analysis
For all experiments shown, a minimum of 100 cells were imaged and tracked for each condition. Single-cell data points were excluded as outliers if greater than six standard deviations from the dataset mean. For all analyses, at least two independent experimental replicates were performed. Where feasible, replicate datasets were merged by normalizing for experimental differences by minimizing the mean variance over a scaling factor attributed per experiment (not per replicate well in a multi-well plate). For visual clarity, some figures show individual replicate experiments, and we verified that similar trends were observable in every replicate.
A p-value of 0.05 was considered significant for all hypothesis testing. Multiple comparison statistics were controlled for false discovery rate (at 5%) via the step-up procedure of Benjamini and Hochberg. All statistical and computational tasks were performed using MATLAB. Data dispersion and precision measures are provided in the figure legends.
Dynamic mathematical modeling
Mathematical modeling of ERK-to-Fra-1 regulation was designed as a system of delay differential equations (DDE). Simulation of the model and calculation of the associated metrics were performed using MATLAB, and its built-in DDE solver dde23. The purpose of this theoretical treatment was to evaluate the conditions required for a “persistence detector” in this production-stabilization context. More formally, a persistence detector requires a super-linear response to increasing input duration, meaning that the longer the input lasts, the faster the stable product is produced. We begin from the putative theoretical formulation around ERK and Fra-1. This basic model of Fra-1 regulation by ERK is analyzed to identify conditions (i.e. parameter ranges) corresponding with duration sensitivity that could give rise to a persistence detector system. From these parameter ranges, we infer qualitative conditions necessary for a persistence detector.
A basic model of the Fra-1 response to ERK activity is constructed (Figure 6A), considering ERK acting to upregulate Fra-1 via two mechanisms: activation of a transcription factor, and inhibition of Fra-1 protein degradation by phosphorylation. To facilitate analysis of the basic regulatory effects, we restrict the model to summary mass action kinetics without detailed accounting for the processes of transcription and translation. Although for some ETGs, such as c-Fos, multiple phosphorylation events appear to be involved (Murphy et al., 2002), we implicitly make the simplifying assumption that a single phosphorylation of Fra-1 protein is sufficient to confer stabilization, or that subsequent modifications are relatively rapid. We include the delay of protein production via the term τ (eq. 2) to account for latency in processes such as transcriptional initiation and mRNA splicing and transport. The resulting 3 differential equations are linear in their states, and describe the dynamics of an active transcription factor TFP, Fra-1 protein FRA, and stabilized Fra-1 protein FRAP (parameters are described in Table S3).
| (1) |
| (2) |
| (3) |
To evaluate super-linearity with respect to duration, we first establish a suitable measure of FRA accumulation, given that some portion of FRA may degrade rapidly (recall that the two forms of FRA may decay at differing rates, which depend on the parameter values for any particular model run). We seek a metric suitable to describe the overall FRA concentration remaining in the future (after ERK is deactivated) based only on current levels of FRA and FRAP. This is possible if we assume a rapid deactivation of ERK and TFP, as the subsequent decay of FRA species is completely defined by the model parameters. Without ERK and TFP, modeled FRA and FRAP levels decay according to eqs. (4–5), i.e. exponentially depending only on their respective degradation and de-phosphorylation rates.
| (4) |
| (5) |
We define and numerically evaluate this “future Fra” metric, derived from the explicit solution of the system after ERK deactivation (eqs. 4–5). Solving first the homogenous equation for FRAP, then the non-homogenous for FRA (using the FRAP solution), results in the following (eqs. 6–7). The sum of the two represents the total FRA, as a function of time after ERK deactivation, i.e. FRATOTAL(t) = FRA(t) + FRAP(t).
| (6) |
| (7) |
To arrive at a scalar metric that avoids the dependence on time since ERK deactivation (while retaining the differences in degradation rate), we evaluate (eqs. 6–7) at a non-zero value of t. We choose t = 1 for convenience, as any value of t > 0 will retain the qualitative relationships between different parameter values or starting FRA concentrations. The resulting metric, termed fF for “future FRA”, depends on the model parameters and the concentrations of FRA and FRAP when ERK is deactivated. The question of persistence detection (super-linear accumulation) regards the rate of fF accumulation, i.e. it’s time derivative (dfF/dt). A rise in this derivative (eq. 8, Figure S6A, red line) indicates super-linearity, while a constant value is perfectly linear and a falling value sub-linear.
| (8) |
In a super-linear response, this value will rise to a peak significantly after the stimulation time, while an approximately linear response will start high. In both cases, peak rates cannot feasibly be sustained indefinitely and will decrease as the reactions saturate. We use the time value at which dfF/dt peaks as a scalar measure of this super-linear duration dependence. To evaluate a single parameter set, we simulate the system (eqs. 1–3), evaluate dfF/dt at each time point and identify the peak time. We numerically sample over the parameter space, evaluating the peak dfF/dt time, to map the requirements for duration sensitivity. All sampling is log-spaced and relative, with nominal values being 1 (100), and ranging 2 orders of magnitude in each direction (10−2 to 102). Due to system stiffness under certain parameters with the delay term, numerical solution is intractable with the readily available dde23 algorithm in MATLAB (a Runge-Kutta order 2,3 procedure). For these parameter screens, we neglect the explicit delay term for the convenience of employing MATLAB’s ode15s, a variable step solver designed for stiff systems. In this case, feasible persistence detection requires relatively slow phosphorylation of the transcription factor (kptf = 10−1.5, kdtf = 10−1.5); this approximates a delay between TF phosphorylation and FRA production, an expected necessary condition.
Parameter regions where duration sensitivity is feasible are shown in Figure S6B (top), by plotting level sets (i.e. planes along which the value of the peak time metric is uniform). The region where k0F is low (i.e. FRA is not rapidly degraded) corresponds to stabilization-independent super-linearity, due to the slow rise of the TF increasing the rate of FRA production; this is illustrated by producing the same plot with the phosphorylation rate for FRA (kpF) set to zero (Figure S6B, bottom). The remaining region of super-linearity in Figure S6B (top) corresponds to the current conceptual model: FRA degradation (k0F) is fast, while FRAP degradation and dephosphorylation (kdF, k0Fp) are slow. Selecting a point in this region (k0F = 10−1, kdF = 10−1, k0Fp. = 10−1, red dot in Figure S6B, top), we explore the effects of varying remaining model parameters, especially as relates to the production of FRA (Figure S6C). Variation of FRA baseline and stimulated production clearly shows a tradeoff, that duration sensitivity can only exist when baseline production is small compared to stimulated production. From this model-based hypothesis, we designed experiments and analyses to evaluate FRA baseline levels and the contribution of ERK-dependent transcription, via phosphor-specific western blot time series and live cell imaging of the FIRE reporter that mimics the FRA degron on a naïve promoter.
Simulations of ERK pulse experiments were performed using the DDE model. Starting from steady state conditions with no ERK, we simulated ERK pulses as square waves of various durations; simulations were continued for twice as long as the longest pulse (200 arbitrary time units). For each simulation, the total Fra-1 AUC was calculated by the trapezoidal method. We validated the AUC of Fra-1 abundance as a metric to assess persistence detection and confirmed that this metric is strictly linear in the long term with significant early curvature differences dependent on baseline and delay. From the biological perspective, the AUC is the metric most likely to reflect its net functional effect as a transcription factor, as the number of transcripts produced will scale with both the rate and duration of transcript production (Little et al., 2013), and we therefore focused our subsequent analysis on this output parameter.
Supplementary Material
Highlights.
Multiple reporters are needed to capture the full dynamic range of ERK activity
Fra-1 induction is related linearly to the integrated activity of ERK
Basal transcription rate determines whether a gene may act as a persistence detector
ERK-independent factors contribute substantially to Fra-1 variance in single cells
Acknowledgments
Funding for this work was provided by the American Cancer Society (IRG-95-125-13), the National Institute of General Medical Sciences (1R01GM115650), the Department of Defense Neurofibromatosis Research Program (W81XWH-16-1-0085), and the American Association for Cancer Research Stand Up To Cancer (SU2C-AACR-IRG-01-16). Stand Up To Cancer is a program of the Entertainment Industry Foundation. Research grants are administered by the American Association for Cancer Research, the scientific partner of SU2C. Flow cytometry services were supported by the UC Davis Comprehensive Cancer Center Support Grant (CCSG) awarded by the National Cancer Institute (NCI P30CA093373), and we acknowledge the expert cell sorting assistance of Dr. Bridget McLaughlin and Jonathan Van Dyke.
Footnotes
Publisher's Disclaimer: This is a PDF file of an unedited manuscript that has been accepted for publication. As a service to our customers we are providing this early version of the manuscript. The manuscript will undergo copyediting, typesetting, and review of the resulting proof before it is published in its final citable form. Please note that during the production process errors may be discovered which could affect the content, and all legal disclaimers that apply to the journal pertain.
DATA AND SOFTWARE AVAILABILITY
Datasets are available at https://www.mcb.ucdavis.edu/faculty-labs/albeck/data.htm
Supplemental Movie Legend
Supplemental Movie 1, related to Fig. 2: ERKTR, Fra::mVenus, and NCd2 response to EGF stimulation.
MCF10A Cells expressing ERKTR-mCherry (left panel), Fra-1::mVenus (middle panel), and NCd2 (right panel) were starved of all growth factors for 48 hours prior to imaging. After 3.5 hours of imaging, 20 ng/mL EGF was added to culture media. Time stamp represents HH:MM.
Author Contributions
All authors contributed to experimental data collection. T.G., M.P., and J.A. analyzed data and wrote the manuscript. M.P. performed mathematical modeling and analysis.
References
- Albeck JG, Mills GB, Brugge JS. Frequency-modulated pulses of ERK activity transmit quantitative proliferation signals. Mol Cell. 2013;49:249–261. doi: 10.1016/j.molcel.2012.11.002. [DOI] [PMC free article] [PubMed] [Google Scholar]
- Altan-Bonnet G, Germain RN. Modeling T cell antigen discrimination based on feedback control of digital ERK responses. PLoS Biol. 2005;3:e356. doi: 10.1371/journal.pbio.0030356. [DOI] [PMC free article] [PubMed] [Google Scholar]
- Amit I, Citri A, Shay T, Lu Y, Katz M, Zhang F, Tarcic G, Siwak D, Lahad J, Jacob-Hirsch J, et al. A module of negative feedback regulators defines growth factor signaling. Nat Genet. 2007;39:503–512. doi: 10.1038/ng1987. [DOI] [PubMed] [Google Scholar]
- Aoki K, Kumagai Y, Sakurai A, Komatsu N, Fujita Y, Shionyu C, Matsuda M. Stochastic ERK activation induced by noise and cell-to-cell propagation regulates cell density-dependent proliferation. Mol Cell. 2013;52:529–540. doi: 10.1016/j.molcel.2013.09.015. [DOI] [PubMed] [Google Scholar]
- Bakiri L, Macho-Maschler S, Custic I, Niemiec J, Guio-Carrion A, Hasenfuss SC, Eger A, Muller M, Beug H, Wagner EF. Fra-1/AP-1 induces EMT in mammary epithelial cells by modulating Zeb1/2 and TGFbeta expression. Cell Death Differ. 2015;22:336–350. doi: 10.1038/cdd.2014.157. [DOI] [PMC free article] [PubMed] [Google Scholar]
- Birtwistle MR, Rauch J, Kiyatkin A, Aksamitiene E, Dobrzynski M, Hoek JB, Kolch W, Ogunnaike BA, Kholodenko BN. Emergence of bimodal cell population responses from the interplay between analog single-cell signaling and protein expression noise. BMC Syst Biol. 2012;6:109. doi: 10.1186/1752-0509-6-109. [DOI] [PMC free article] [PubMed] [Google Scholar]
- Chiappetta G, Ferraro A, Botti G, Monaco M, Pasquinelli R, Vuttariello E, Arnaldi L, Di Bonito M, D’Aiuto G, Pierantoni GM, et al. FRA-1 protein overexpression is a feature of hyperplastic and neoplastic breast disorders. BMC Cancer. 2007;7:17. doi: 10.1186/1471-2407-7-17. [DOI] [PMC free article] [PubMed] [Google Scholar]
- Cong L, Ran FA, Cox D, Lin S, Barretto R, Habib N, Hsu PD, Wu X, Jiang W, Marraffini LA, et al. Multiplex genome engineering using CRISPR/Cas systems. Science. 2013;339:819–823. doi: 10.1126/science.1231143. [DOI] [PMC free article] [PubMed] [Google Scholar]
- Das J, Ho M, Zikherman J, Govern C, Yang M, Weiss A, Chakraborty AK, Roose JP. Digital signaling and hysteresis characterize ras activation in lymphoid cells. Cell. 2009;136:337–351. doi: 10.1016/j.cell.2008.11.051. [DOI] [PMC free article] [PubMed] [Google Scholar]
- Duncan JS, Whittle MC, Nakamura K, Abell AN, Midland AA, Zawistowski JS, Johnson NL, Granger DA, Jordan NV, Darr DB, et al. Dynamic reprogramming of the kinome in response to targeted MEK inhibition in triple-negative breast cancer. Cell. 2012;149:307–321. doi: 10.1016/j.cell.2012.02.053. [DOI] [PMC free article] [PubMed] [Google Scholar]
- Ferrell JE, Jr, Machleder EM. The biochemical basis of an all-or-none cell fate switch in Xenopus oocytes. Science. 1998;280:895–898. doi: 10.1126/science.280.5365.895. [DOI] [PubMed] [Google Scholar]
- Gille H, Kortenjann M, Thomae O, Moomaw C, Slaughter C, Cobb MH, Shaw PE. ERK phosphorylation potentiates Elk-1-mediated ternary complex formation and transactivation. EMBO J. 1995;14:951–962. doi: 10.1002/j.1460-2075.1995.tb07076.x. [DOI] [PMC free article] [PubMed] [Google Scholar]
- Gutenkunst RN, Waterfall JJ, Casey FP, Brown KS, Myers CR, Sethna JP. Universally sloppy parameter sensitivities in systems biology models. PLoS Comput Biol. 2007;3:1871–1878. doi: 10.1371/journal.pcbi.0030189. [DOI] [PMC free article] [PubMed] [Google Scholar]
- Hansen AS, Hao N, O’Shea EK. High-throughput microfluidics to control and measure signaling dynamics in single yeast cells. Nat Protoc. 2015;10:1181–1197. doi: 10.1038/nprot.2015.079. [DOI] [PMC free article] [PubMed] [Google Scholar]
- Hansen AS, O’Shea EK. Limits on information transduction through amplitude and frequency regulation of transcription factor activity. Elife. 2015;4 doi: 10.7554/eLife.06559. [DOI] [PMC free article] [PubMed] [Google Scholar]
- Hao N, O’Shea EK. Signal-dependent dynamics of transcription factor translocation controls gene expression. Nat Struct Mol Biol. 2011;19:31–39. doi: 10.1038/nsmb.2192. [DOI] [PMC free article] [PubMed] [Google Scholar]
- Hasenfuss SC, Bakiri L, Thomsen MK, Williams EG, Auwerx J, Wagner EF. Regulation of steatohepatitis and PPARgamma signaling by distinct AP-1 dimers. Cell Metab. 2014;19:84–95. doi: 10.1016/j.cmet.2013.11.018. [DOI] [PMC free article] [PubMed] [Google Scholar]
- Ingram PJ, Stumpf MP, Stark J. Network motifs: structure does not determine function. BMC Genomics. 2006;7:108. doi: 10.1186/1471-2164-7-108. [DOI] [PMC free article] [PubMed] [Google Scholar]
- Janes KA. An analysis of critical factors for quantitative immunoblotting. Sci Signal. 2015;8:rs2. doi: 10.1126/scisignal.2005966. [DOI] [PMC free article] [PubMed] [Google Scholar]
- Janes KA, Wang CC, Holmberg KJ, Cabral K, Brugge JS. Identifying single-cell molecular programs by stochastic profiling. Nat Methods. 2010;7:311–317. doi: 10.1038/nmeth.1442. [DOI] [PMC free article] [PubMed] [Google Scholar]
- Jaqaman K, Loerke D, Mettlen M, Kuwata H, Grinstein S, Schmid SL, Danuser G. Robust single-particle tracking in live-cell time-lapse sequences. Nat Methods. 2008;5:695–702. doi: 10.1038/nmeth.1237. [DOI] [PMC free article] [PubMed] [Google Scholar]
- Kholodenko BN, Hancock JF, Kolch W. Signalling ballet in space and time. Nat Rev Mol Cell Biol. 2010;11:414–426. doi: 10.1038/nrm2901. [DOI] [PMC free article] [PubMed] [Google Scholar]
- Kwong LN, Costello JC, Liu H, Jiang S, Helms TL, Langsdorf AE, Jakubosky D, Genovese G, Muller FL, Jeong JH, et al. Oncogenic NRAS signaling differentially regulates survival and proliferation in melanoma. Nat Med. 2012;18:1503–1510. doi: 10.1038/nm.2941. [DOI] [PMC free article] [PubMed] [Google Scholar]
- Lee RE, Walker SR, Savery K, Frank DA, Gaudet S. Fold change of nuclear NF-kappaB determines TNF-induced transcription in single cells. Mol Cell. 2014;53:867–879. doi: 10.1016/j.molcel.2014.01.026. [DOI] [PMC free article] [PubMed] [Google Scholar]
- Legewie S, Bluthgen N, Herzel H. Quantitative analysis of ultrasensitive responses. FEBS J. 2005;272:4071–4079. doi: 10.1111/j.1742-4658.2005.04818.x. [DOI] [PubMed] [Google Scholar]
- Little SC, Tikhonov M, Gregor T. Precise developmental gene expression arises from globally stochastic transcriptional activity. Cell. 2013;154:789–800. doi: 10.1016/j.cell.2013.07.025. [DOI] [PMC free article] [PubMed] [Google Scholar]
- Mackeigan JP, Murphy LO, Dimitri CA, Blenis J. Graded mitogen-activated protein kinase activity precedes switch-like c-Fos induction in mammalian cells. Mol Cell Biol. 2005;25:4676–4682. doi: 10.1128/MCB.25.11.4676-4682.2005. [DOI] [PMC free article] [PubMed] [Google Scholar]
- Mangan S, Zaslaver A, Alon U. The coherent feedforward loop serves as a sign-sensitive delay element in transcription networks. J Mol Biol. 2003;334:197–204. doi: 10.1016/j.jmb.2003.09.049. [DOI] [PubMed] [Google Scholar]
- Murphy LO, MacKeigan JP, Blenis J. A network of immediate early gene products propagates subtle differences in mitogen-activated protein kinase signal amplitude and duration. Mol Cell Biol. 2004;24:144–153. doi: 10.1128/MCB.24.1.144-153.2004. [DOI] [PMC free article] [PubMed] [Google Scholar]
- Murphy LO, Smith S, Chen RH, Fingar DC, Blenis J. Molecular interpretation of ERK signal duration by immediate early gene products. Nat Cell Biol. 2002;4:556–564. doi: 10.1038/ncb822. [DOI] [PubMed] [Google Scholar]
- Nakakuki T, Birtwistle MR, Saeki Y, Yumoto N, Ide K, Nagashima T, Brusch L, Ogunnaike BA, Okada-Hatakeyama M, Kholodenko BN. Ligand-specific c-Fos expression emerges from the spatiotemporal control of ErbB network dynamics. Cell. 2010;141:884–896. doi: 10.1016/j.cell.2010.03.054. [DOI] [PMC free article] [PubMed] [Google Scholar]
- Niepel M, Hafner M, Pace EA, Chung M, Chai DH, Zhou L, Muhlich JL, Schoeberl B, Sorger PK. Analysis of growth factor signaling in genetically diverse breast cancer lines. BMC Biol. 2014;12:20. doi: 10.1186/1741-7007-12-20. [DOI] [PMC free article] [PubMed] [Google Scholar]
- O’Shaughnessy EC, Palani S, Collins JJ, Sarkar CA. Tunable signal processing in synthetic MAP kinase cascades. Cell. 2011;144:119–131. doi: 10.1016/j.cell.2010.12.014. [DOI] [PMC free article] [PubMed] [Google Scholar]
- Okazaki K, Sagata N. The Mos/MAP kinase pathway stabilizes c-Fos by phosphorylation and augments its transforming activity in NIH 3T3 cells. EMBO J. 1995;14:5048–5059. doi: 10.1002/j.1460-2075.1995.tb00187.x. [DOI] [PMC free article] [PubMed] [Google Scholar]
- Pargett M, Albeck JG. Mapping the Spectrum of Gene Expression Responses. Cell Syst. 2016;2:221–222. doi: 10.1016/j.cels.2016.04.005. [DOI] [PubMed] [Google Scholar]
- Pargett M, Gillies TE, Teragawa CK, Sparta B, Albeck JG. Single-Cell Imaging of ERK Signaling Using Fluorescent Biosensors. Methods Mol Biol. 2017;1636:35–59. doi: 10.1007/978-1-4939-7154-1_3. [DOI] [PMC free article] [PubMed] [Google Scholar]
- Purvis JE, Lahav G. Encoding and decoding cellular information through signaling dynamics. Cell. 2013;152:945–956. doi: 10.1016/j.cell.2013.02.005. [DOI] [PMC free article] [PubMed] [Google Scholar]
- Regot S, Hughey JJ, Bajar BT, Carrasco S, Covert MW. High-sensitivity measurements of multiple kinase activities in live single cells. Cell. 2014;157:1724–1734. doi: 10.1016/j.cell.2014.04.039. [DOI] [PMC free article] [PubMed] [Google Scholar]
- Rhee A, Cheong R, Levchenko A. The application of information theory to biochemical signaling systems. Phys Biol. 2012;9:045011. doi: 10.1088/1478-3975/9/4/045011. [DOI] [PMC free article] [PubMed] [Google Scholar]
- Ryan MB, Der CJ, Wang-Gillam A, Cox AD. Targeting RAS-mutant cancers: is ERK the key? Trends Cancer. 2015;1:183–198. doi: 10.1016/j.trecan.2015.10.001. [DOI] [PMC free article] [PubMed] [Google Scholar]
- Saito TH, Uda S, Tsuchiya T, Ozaki Y, Kuroda S. Temporal decoding of MAP kinase and CREB phosphorylation by selective immediate early gene expression. PLoS One. 2013;8:e57037. doi: 10.1371/journal.pone.0057037. [DOI] [PMC free article] [PubMed] [Google Scholar]
- Shah M, Smolko CM, Kinicki S, Chapman ZD, Brautigan DL, Janes KA. Profiling Subcellular Protein Phosphatase Responses to Coxsackievirus B3 Infection of Cardiomyocytes. Mol Cell Proteomics. 2017;16:S244–S262. doi: 10.1074/mcp.O116.063487. [DOI] [PMC free article] [PubMed] [Google Scholar]
- Sparta B, Pargett M, Minguet M, Distor K, Bell G, Albeck JG. Receptor Level Mechanisms Are Required for Epidermal Growth Factor (EGF)-stimulated Extracellular Signal-regulated Kinase (ERK) Activity Pulses. J Biol Chem. 2015;290:24784–24792. doi: 10.1074/jbc.M115.662247. [DOI] [PMC free article] [PubMed] [Google Scholar]
- Sturm OE, Orton R, Grindlay J, Birtwistle M, Vyshemirsky V, Gilbert D, Calder M, Pitt A, Kholodenko B, Kolch W. The mammalian MAPK/ERK pathway exhibits properties of a negative feedback amplifier. Sci Signal. 2010;3:ra90. doi: 10.1126/scisignal.2001212. [DOI] [PubMed] [Google Scholar]
- Tam WL, Lu H, Buikhuisen J, Soh BS, Lim E, Reinhardt F, Wu ZJ, Krall JA, Bierie B, Guo W, et al. Protein kinase C alpha is a central signaling node and therapeutic target for breast cancer stem cells. Cancer Cell. 2013;24:347–364. doi: 10.1016/j.ccr.2013.08.005. [DOI] [PMC free article] [PubMed] [Google Scholar]
- Tay S, Hughey JJ, Lee TK, Lipniacki T, Quake SR, Covert MW. Single-cell NF-kappaB dynamics reveal digital activation and analogue information processing. Nature. 2010;466:267–271. doi: 10.1038/nature09145. [DOI] [PMC free article] [PubMed] [Google Scholar]
- Treisman R. Transient accumulation of c-fos RNA following serum stimulation requires a conserved 5′ element and c-fos 3′ sequences. Cell. 1985;42:889–902. doi: 10.1016/0092-8674(85)90285-5. [DOI] [PubMed] [Google Scholar]
- Uhlitz F, Sieber A, Wyler E, Fritsche-Guenther R, Meisig J, Landthaler M, Klinger B, Bluthgen N. An immediate-late gene expression module decodes ERK signal duration. Mol Syst Biol. 2017;13:928. doi: 10.15252/msb.20177554. [DOI] [PMC free article] [PubMed] [Google Scholar]
- Vial E, Sahai E, Marshall CJ. ERK-MAPK signaling coordinately regulates activity of Rac1 and RhoA for tumor cell motility. Cancer Cell. 2003;4:67–79. doi: 10.1016/s1535-6108(03)00162-4. [DOI] [PubMed] [Google Scholar]
- Wang L, Brugge JS, Janes KA. Intersection of FOXO- and RUNX1-mediated gene expression programs in single breast epithelial cells during morphogenesis and tumor progression. Proc Natl Acad Sci U S A. 2011;108:E803–812. doi: 10.1073/pnas.1103423108. [DOI] [PMC free article] [PubMed] [Google Scholar]
- Woods D, Parry D, Cherwinski H, Bosch E, Lees E, McMahon M. Raf-induced proliferation or cell cycle arrest is determined by the level of Raf activity with arrest mediated by p21Cip1. Mol Cell Biol. 1997;17:5598–5611. doi: 10.1128/mcb.17.9.5598. [DOI] [PMC free article] [PubMed] [Google Scholar]
- Zhong G, Chen X, Fang X, Wang D, Xie M, Chen Q. Fra-1 is upregulated in lung cancer tissues and inhibits the apoptosis of lung cancer cells by the P53 signaling pathway. Oncol Rep. 2016;35:447–453. doi: 10.3892/or.2015.4395. [DOI] [PubMed] [Google Scholar]
Associated Data
This section collects any data citations, data availability statements, or supplementary materials included in this article.