

Abstract
Understanding the genetic architecture (causal molecular variants, their effects and frequencies) of quantitative traits is important for precision agriculture and medicine and predicting adaptive evolution, but is challenging in most species. The Drosophila melanogaster Genetic Reference Panel (DGRP) is a collection of 205 inbred strains with whole genome sequences derived from a single wild population in Raleigh, North Carolina, USA. The large amount of quantitative genetic variation, lack of population structure and rapid local decay of linkage disequilibrium in the DGRP and outbred populations derived from DGRP lines present a favourable scenario for performing genome wide association (GWA) mapping analyses to identify candidate causal genes, polymorphisms and pathways affecting quantitative traits. The many GWA studies utilizing the DGRP have revealed substantial natural genetic variation for all reported traits, little evidence for variants with large effects but enrichment for variants with low P-values, and a tendency for lower frequency variants to have larger effects than more common variants. The variants detected in the GWA analyses rarely overlap those discovered using mutagenesis, and often are the first functional annotations of computationally predicted genes. Variants implicated in GWA analyses typically have sex-specific and genetic background-specific (epistatic) effects, as well as pleiotropic effects on other quantitative traits. Studies in the DGRP reveal substantial genetic control of environmental variation. Taking account of genetic architecture can greatly improve genomic prediction in the DGRP. These features of the genetic architecture of quantitative traits are likely to apply to other species, including humans.
Keywords: Genome-wide association, genetic architecture, quantitative trait, sex-specific effects, pleiotropy, epistasis
Graphical abstract
Caption: The Drosophila Genetic Reference Panel enables genome-wide analyses to identify molecular novel variants, genes and pathways affecting quantitative traits.
Introduction
One of the grand challenges of modern biology is to understand the relationship between molecular variation at the level of DNA sequence; transcript, protein and metabolite abundance; and epigenetic modifications and post-translational to population variation in quantitative traits. Quantitative traits refer to all aspects of morphology, physiology, and behavior that vary continuously in natural populations, such as height, weight, blood pressure, and disease susceptibility. We have known for 100 years that this phenotypic variation is due to the joint effects of segregation of multiple genes, the effects of which are too small to track in individual pedigrees (nature), and non-genetic or environmental effects (nurture)1–3.
Knowledge of the detailed genetic basis of variation for quantitative traits is important for animal and plant breeding, understanding adaptive evolution, and understanding the biological basis of common human diseases and disorders. Such knowledge would include a detailed parts list of not only what genes affect these traits, but the actual causal variants in each gene, their allele frequencies, the nature of their inferred molecular effects (regulatory or protein coding), and their individual and collective effects on organismal phenotypes. The basic principles of mapping quantitative trait loci (QTLs) by linkage to or association with Mendelian markers have been known since the early 20th century2,3, but efforts to apply them were stymied by the lack of abundant, polymorphic and neutral (with respect to fitness) markers, and the ability to genotype them rapidly and economically. The advent of cost-effective next generation sequencing and genotyping platforms have enabled large scale genome wide association (GWA) studies for quantitative traits in humans and other taxa that have served to highlight the complexity of the underlying genetic architecture of quantitative traits. However, there are very few quantitative traits for which the genetic architecture is understood at the level of effects, frequencies and molecular functions of individual segregating variants in any species.
Model organisms, such as Drosophila melanogaster, have many advantages for genetic analyses of quantitative traits. The genome of D. melanogaster is 10 times smaller than humans or mice; they have a short generation interval and can be both inbred and crossed in the laboratory; there are many publicly available mutations and systems for modulating gene expression in a tissue and developmental stage specific manner; and the range of quantitative trait phenotypes that can be measured is limited only by the ingenuity of the researcher4. D. melanogaster was among the first model organisms to be used for quantitative genetic analyses5,6, including interval mapping of QTLs7 and mapping QTLs by association with molecular markers8,9. Early analyses of the patterning of molecular variation in D. melanogaster populations10 revealed high levels of polymorphism, and, in contrast to human populations, little local linkage disequilibrium (LD). Thus, full genome sequences are required for association mapping in this species, which is expensive; however, the advantage is that mapping individual variants is feasible.
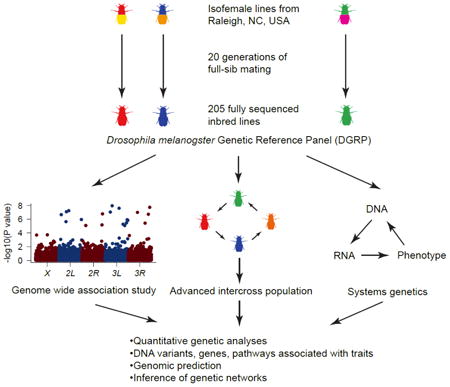
Here, we review studies of molecular and phenotypic variation in the D. melanogaster Genetic Reference Panel (DGRP), a community resource of inbred, sequenced lines that have been used by many laboratories to study a wide range of quantitative trait phenotypes, including molecular phenotypes. Inferences regarding the genetic architecture of quantitative traits from these studies are likely to be generally valid; and genes and pathways affecting quantitative traits in flies are likely to affect orthologous traits in other species.
Origin of the DGRP
The DGRP currently consists of 205 inbred lines that were derived by 20 generations of full sib inbreeding from the progeny of inseminated females collected from the Raleigh, NC USA Farmer's Market in 200311,12. A single population was chosen because one of the intended uses of this resource was for GWA mapping analyses, and these analyses can yield false positive associations in the presence of population structure13,14. The Raleigh Farmer's Market population has a long history of use for population and quantitative genetic studies15–17. However, this population does not represent the range of genetic diversity of the species, as would a population derived from East sub-Saharan Africa, the center of origin of D. melanogaster18. Unfortunately, the African populations have a very high frequency of polymorphic inversions and are notoriously difficult to inbreed19. Indeed, the Drosophila Population Genomic Project19, which compared sequences of African strains with those from a subset of DGRP lines for the purpose of population genomic analyses, either created living stocks by extracting single chromosomes from the African populations using balancers, or generated non-viable single haploid embryos from isofemale lines20,21. The DGRP lines also suffered losses during the inbreeding process, as inbreeding was initially attempted from over 1,500 isofemale lines. Thus, the DGRP has been purged of highly deleterious alleles that might have large effects on quantitative traits in nature, and there may have been selection for epistatic interactions between variants increasing fitness during inbreeding. Further, the possibility of adaptation to the laboratory environment and consequent change in frequency of alleles responsible for laboratory adaptation relative to their frequency in the natural population cannot be excluded. Otherwise, the DGRP represents a snapshot of genetic variation segregating in the population from which it was derived consistent with viability and fertility in the laboratory. All DGRP lines are publicly available from the Bloomington Drosophila Stock Center (http://fly.bio.indiana.edu).
DNA Sequence Variation in the DGRP
All DGRP lines were sequenced to an average of 27× on the Illumina short read next generation sequencing platform; a subset of lines were also sequenced using the 454 platform. Sequencing was performed at the Baylor College of Medicine Human Genome Sequencing Center11,12. The sequence reads were mapped to the reference D. melanogaster genome, and 3,976,011 high quality single/multiple nucleotide polymorphisms (SNPs/MNPs), 169,053 polymorphic insertions (relative to the reference genome), 293,363 polymorphic deletions and 125,788 polymorphic microsatellites were identified, for a total of 4,565,215 naturally occurring molecular variants. The distribution of allele frequencies was ‘L-shaped’, with variants that occur only once in the DGRP the most common class, and those at intermediate frequency the least common. SNP nucleotide diversity, whether quantified as π 22 or θ 23, is high across the whole genome: π = 0.0056 and θ = 0.0067. However, nucleotide diversity is not constant across the genome: polymorphism is reduced on the X chromosome relative to autosomes; reduced near the centromeres and telomeres of autosomes; and positively correlated with recombination rate (c) in regions where c < 2cM/Mb11.
It is possible – indeed likely, given the variation in genome size observed among the DGRP12 – that the DGRP lines contain sequences not present in the reference genome. However, identifying novel variants is exceedingly difficult with short read DNA sequences unless there is very high coverage; and a combination of high coverage short-insert, paired-end reads with lower coverage long-insert, mate pair sequences is used. Similarly, large structural variants will have been missed, and transposable element insertion sites are not comprehensively covered as their detection relies on reads that span the unique sequence flanking the insertion site and the transposon. Other categories of missing variation are small inversions and translocations with respect to the reference and variation in heterochromatic regions of the genome, to which reads do not map uniquely.
D. melanogaster populations segregate for many large polymorphic inversions24,25. Large inversions in the DGRP lines were mapped by cytogenetic analysis of banding patterns of salivary gland polytene chromosomes12 as well as from the sequence data for inversions with known molecular breakpoints26. Reduced recombination between the inverted and standard karyotypes means the inversions act as islands of genomic diversity relative to the rest of the genome. Many DGRP lines remain segregating for the inversion polymorphisms, suggesting that natural selection opposes fixation of one or the other karyotype by inbreeding; perhaps because individual variants in the inverted regions are truly overdominant for fitness, or because different deleterious alleles fixed in the two inverted karyotypes exhibit associative overdominance. Regions that remain segregating for inversions are the major cause of residual heterozygosity in the DGRP lines12.
Since whole flies were sequenced, the sequence data include the microbial communities hosted by the DGRP lines. One of the most abundant members of the fly microbiome is the maternally transmitted endosymbiotic bacterium, Wolbachia pipientis. Approximately half (53%) of the DGRP lines are infected with Wolbachia11,12.
Potential Functional Effects of DNA Variants in the DGRP
Functional annotation (Table 1) of segregating variants revealed that most were intronic (38.2%) or intergenic (25.2%), defined operationally as farther than 1 kb from a gene start or stop site. Many variants had potentially regulatory effects, located within 1 kb upstream or downstream of the gene, or in an exon of a non-coding gene. A total of 211,781 (3.6%) individual variants possibly affect polypeptide sequences, and of these, 6,637 are potentially damaging (Table 1). The potentially damaging variants affect a total of 3,868 genes in at least one DGRP line12. The minor allele frequencies of these potentially damaging variants is at the lower end of the allele frequency spectrum, as would be expected if they had deleterious fitness effects12. However, some of these deleterious variants were rescued by closely linked mutations, for example SNPs that rescued a pre-mature stop codon variant or indels in the same genes that compensate each other to avoid frame-shifts. There are 403 genes in the DGRP that contain such pairs of compensatory variants, and approximately 50 genes in each line are ‘rescued’ in this manner12. Consistent with the compensation of damage to protein sequences, these variants segregate at higher frequency than other potentially damaging variants. Taking into account all variants in single genes, 2,169 genes (∼15% of the Drosophila genome) are potentially damaged (start codon or stop codon lost; protein sequence changed by more than 10%). Each of the affected genes is damaged in on average 13 lines, and each line contains on average 136 potentially damaged genes. These genes tend to be in multigene families associated with chemosensation, detoxification of xenobiotics, immune and defense response and proteolysis, so it is possible that functional redundancy from other family members compensate for the damage. These naturally occurring mutations provide a new resource for future functional analyses.
Table 1. Functional annotation of segregating variants in the DGRP.
The annotation was performed using SnpEFF (version 3.1)80 on the basis of FlyBase gene models (release 5.49)81. Data are from Huang et al. 201412. Note that the total number of functional annotations exceeds the total number of variants because many variants have effects on more than one gene. Annotations in red font represent variants with potentially damaging individual effects on proteins.
| Functional Annotation | Number of Variants |
|---|---|
| Intron | 2,240,252 |
| Intergenic | 1,478,922 |
| Upstream | 646,329 |
| Downstream | 575,352 |
| Synonymous Coding | 351,255 |
| 3′ UTR | 204,693 |
| Non Synonymous Coding | 182,520 |
| 5′ UTR | 118,359 |
| Exon | 31,102 |
| Start Gained | 15,992 |
| Codon Deletion | 3,016 |
| Frame Shift | 2,967 |
| Codon Change Plus Codon Deletion | 1,758 |
| Stop Gained | 1,532 |
| Codon Change Plus Codon Insertion | 1,221 |
| Splice Site Donor | 910 |
| Splice Site Acceptor | 708 |
| Codon Insertion | 605 |
| Synonymous Stop | 433 |
| Stop Lost | 301 |
| Start Lost | 219 |
| Non Synonymous Start | 32 |
| 5′ UTR Deleted | 14 |
| Exon Deleted | 6 |
| 3′ UTR Deleted | 2 |
| Codon Change | 1 |
|
| |
| Total | 5,858,501 |
Population Structure
Since the DGRP lines were derived from a single randomly mating population, little population structure was expected. However, the distribution of genetic relatedness derived by determining the genetic relationship matrix between all pairs of DGRP lines was distinctly bimodal12,27. The vast majority of lines had nearly zero relatedness with each other and with the reference strain. However, some lines had relatedness greater than 0.05 and a small number of pairs were as related as full sibs or parents and offspring. It is likely that finding pairs of lines with high relatedness was due to sampling closely related individuals from the natural population from which the DGRP lines were derived, but the other group of related lines is puzzling. Since inversions act as islands of genomic divergence, one possibility is that lines carrying inversions are more related to each other in the regions spanned by the inversion than are lines that have the standard karyotype in these regions. Indeed, principal component (PC) analysis showed that this was in part the cause of the cryptic relatedness12.
Linkage Disequilibrium (LD)
Previous studies of variation in candidate genes have shown that LD, the association of alleles between polymorphic sites, decays rapidly with local physical distance in D. melanogaster16. The r2 metric28 was used to quantify pairwise LD in the DGRP both locally and genome wide12. As expected, local LD generally decays very rapidly with physical distance for variants spanning the range of minor allele frequencies (low to intermediate), except near the autosomal telomeres and centromeres, consistent with lower recombination rates in these regions11. The rate of local decay on the X chromosome, while still rapid, is lower than autosomes, consistent with the lower effective population size of the X chromosome. The rate of local decay of LD is also lower for variants within polymorphic inversions, since recombination is reduced in these regions29,30. However, variants with low (< 5%) minor allele frequencies (MAF) exhibit elevated ‘long range’ LD with other variants throughout the entire genome. This is strictly a consequence of the small size of the DGRP population (205 lines) and variants with low MAF12,31. To understand how this can happen intuitively, imagine a variant private to one DGRP line. This line will also have many other private variants, since this is the most common frequency class. The focal private variant will then be in perfect LD with all other private variants in this line, creating spurious long range LD. The same phenomenon occurs to a lesser extent as the minor allele frequency increases, disappearing to near background levels when the MAF reaches 5%12.
Analysis of Quantitative Traits in the DGRP
We know a priori that quantitative traits are continuously distributed in natural populations due to the segregation of multiple loci with alleles that have individually small effects on the trait (genetic variation) and to non-genetic variation (environmental variation)2. Thus, the first step in any quantitative genetic analysis is to assess the relative contributions of genetic and environmental variation to the observed variation in phenotypes for the trait of interest. A full discussion of methods for achieving this partitioning is outside the scope of this review2,3. Rather, we highlight the key differences between a randomly mating outbred population and a set of fully inbred lines such as the DGRP.
Alleles affecting quantitative traits may have additive and dominance effects at each locus and epistatic effects for pairs (or more) of loci. Additive effects are a function of the difference in the mean of the trait between individuals homozygous for the major and minor alleles, averaged over all other loci. Dominance effects represent the deviation of the difference between the mean of heterozygous individuals at the focal locus and the average of the two homozygous genotypes. Epistatic effects represent the deviation of the difference between the mean of individuals for a two (or more) locus genotype from that expected from the sum of the relevant effects for the constituent single locus genotypes1–3. It is these effects (gene action) that we wish to estimate using GWA analyses. In the absence of information on genetic polymorphisms but presence of pedigrees, we can partition the total genetic variance into the ‘additive genetic variance’ (VA) (the fraction of the genetic variance that is transmissible from one generation to the next), the ‘dominance variance’ (VD), and ‘interaction’ or ‘epistatic’ variance (VI) (non-additive genetic variation which is not transmissible from one generation to the next in an outbred population since alleles and multi-locus genotypes segregate). The interaction variance can be further partitioned into additive by additive (VAA), additive by dominance (VAD) and dominance by dominance (VDD) variance for two loci1–3. The variance components are in theory functions of effects and allele frequencies and do not map directly back to the effects in terms of gene action: both dominance and epistatic effects contribute to additive variance, for example1–3,32. However, variance components so defined have the very useful property that they determine the genetic covariance (covG) between any set of relatives33:
where r is the probability that relatives share alleles from a recent common ancestor and u is the probability that relatives have the same genotype from a recent common ancestor (Table 2).
Table 2.
Contribution of variance components to genetic covariance among common relatives for two biallelic loci in an outbred population and for a population of fully inbred lines.
| Relatives | VA | VD | VAA | VAD | VDD |
|---|---|---|---|---|---|
| Offspring-parent | 0.5 | 0 | 0.25 | 0 | 0 |
| Half-sibs | 0.25 | 0 | 0.0625 | 0 | 0 |
| Full sibs | 0.5 | 0.25 | 0.25 | 0.125 | 0.0625 |
| Twins | 1 | 1 | 1 | 1 | 1 |
| Inbred lines | 1 | 0 | 1 | 0 | 0 |
Inbreeding re-partitions genetic variation from that in the outbred population from which the inbred lines were derived. With each generation of inbreeding, heterozygotes are lost at each segregating locus and each line eventually becomes fixed for one or the other homozygous genotype. The fraction of lines fixed for the major allele is expected to be equal to the frequency of the major allele in the initial outbred population2. After 20 generations of full sib inbreeding each line is expected to be 98.6% homozygous2; indeed, 96% of the lines have 2% or fewer segregating X-linked variants, while on average 84% of the lines had 2% or fewer segregating autosomal variants12. As noted above, elevated heterozygosity in the exceptional lines is concentrated in regions where inversions remain segregating within a line. This has two implications for quantitative genetic analysis. First, we must assume that sites segregating within a line are missing data, since we do not know an individual's genotype at these sites. Thus for all fixed sites, there is no contribution of dominance variance or interactions involving dominance (Table 2). Second, the re-partitioning of genetic variance means that relative to the original outbred population, the variance between the inbred lines is34:
where F, the inbreeding coefficient, is the probability that both alleles at a locus are derived from the same common ancestor. For the DGRP we can assume that F = 1; therefore:
In the absence of epistasis, the genetic variation in the DGRP lines is twice that of the outbred Farmer's Market population. Furthermore, any two-locus and higher order additive by additive epistatic interaction variance is greatly amplified with respect to the outbred population. This re-partitioning of genetic variance thus increases the power to map variants with both additive and epistatic effects. Empirical quantitative genetic analyses in the DGRP begin with measuring the quantitative trait of interest for n individuals of each line. Analysis of variance of the phenotypic data will give estimates of the among-line ( ) and within-line ( ) variance components. The estimate of covG is . The broad sense heritability, H2, is the fraction of the total phenotypic variation of the trait that is attributable to all sources of genetic variation, and is estimated as .
GWA analyses in the DGRP are most conveniently performed using line means. The broad sense heritability estimated from lines means is , which approaches 1 as n increases. Thus, even traits with a low broad sense heritability based on individual level data can have high heritability when line means are considered, which is important, since GWA analyses cannot be performed if Ĥ2 is not significantly different from zero (Figure 1).
Figure 1. Power to detect QTLs in mapping populations of individual and replicated genotypes.
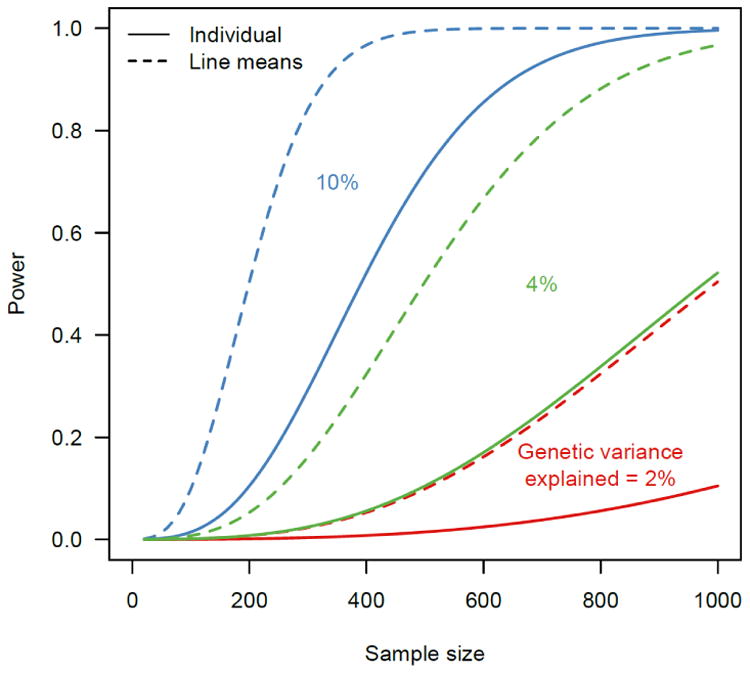
Power is calculated by assuming a 1-df test. Under the alternative hypothesis, for a DNA variant explaining a2 amount of genetic variation for a trait of heritability H2, the test statistic is distributed as a non-central with non-centrality parameter , where n is the number of lines and r is the number of replicate individuals of the same genotype. Using a P-value threshold of α = 10−5, the power for the association test is . Power to detect association at different effect sizes under two scenarios where H2 = 0.5 and r = 1 (individual) and 50 (line means) respectively is plotted.
GWA Analyses in the DGRP
GWA analyses can be performed one variant at a time, essentially grouping the DGRP lines by whether they are homozygous for the major or minor allele at the focal variant, and asking whether there is a significant difference in trait mean between the two genotypes. A complementary method is to perform gene-based association tests. The former can only be appropriately applied to common (MAF > 0.05) variants, while the latter can in principle capture the effects of common as well as rare (MAF < 0.05) variants. However, the gene based methods are sensitive to how the effects of variants in a gene are weighted, and can give different answers for different weightings35–39; therefore, we focus here on the individual variant tests. While these tests have the disadvantage that rare variants are not assessed, this is countered by the advantage that common variants are less prone to false discoveries.
The DGRP has many advantages for GWA analyses. Low local LD means that the precision of mapping is high – typically within a gene and often to the level of individual nucleotide. Although the small sample of 205 lines means only variants with moderate effects can be detected reliably, the power is greater than would be expected than if these were 205 individual genotypes due to the increase in genetic variation relative to that in an outbred population and the ability to quantify the phenotype precisely (Figure 1). The same DGRP lines can be examined for a range of molecular and organismal phenotypes, giving insight into the nature of pleiotropy; and in multiple environments, giving insight into the nature of genotype by environment interaction.
When one assesses whether there is a genotype-phenotype association, it is assumed that the variant either causes the difference in trait mean or is in local LD with the true causal variant. However, population structure and cryptic polygenic relatedness can give false positive associations40. Although the DGRP lines are largely unrelated, we have seen that the segregating inversions, variable polygenic relatedness, and Wolbachia infection status could all result in cryptic structure12. Thus, the best practice for GWA analysis in this population is to use a mixed linear model that estimates and accounts for cryptic polygenic relatedness among the lines after adjusting for inversions and Wolbachia infection. This procedure is implemented on the publicly and freely available DGRP website (http://dgrp2.gnets.ncsu.edu/). For some purposes, e.g., performing GWA analyses on all genetically variable transcripts in the DGRP or performing genome wide analyses of pair-wise epistasis, the mixed model is computationally too slow. An alternate approach to effectively account for cryptic structure is to adjust the phenotypic values using the top significant principal components of the DGRP genotypes41.
GWA in Populations Derived from DGRP Lines
The DGRP lines offer collections of naturally occurring mutations and can also be used as parental lines to construct outbred advanced intercross populations (AIPs) by maintaining the populations in large numbers (to minimize genetic drift and loss of variation in the parental lines) for many generations (to allow LD generated by the initial cross to dissipate). The AIPs enable us to go beyond the restrictive sample size of the DGRP, since as many genotypically distinct individuals can be generated as desired. Rather than sequencing each of the thousands of AIP individuals as done for conventional association mapping, we can take advantage of the fact that causal alleles will be enriched in the extreme ends of the phenotypic distribution. Thus, we can phenotype thousands of individuals, and collect individuals from the top and bottom p% of the distribution (or the top p% and a randomly sampled p%), pool the top and bottom (or random) individuals, and economically sequence only the pools (‘extreme QTL mapping’)42. We can then estimate the allele frequency of each segregating variant in the two pools; significant differences in allele frequency occur when the variant is causal or in LD with the true causal variant.
The AIP design is very flexible. The AIP can be from a cross of two (or more) DGRP lines at the extremes of the DGRP phenotypic distribution43,44, or from a random subset of DGRP lines45–47. AIPs derived from a small set of DGRP lines have the useful property that all variants in the parental lines will be at appreciable frequencies in the AIP; thus the effects of alleles at low frequency in the DGRP can be interrogated in these populations. The contribution of genetic variance components to quantitative trait phenotypes is different in the DGRP and AIPs. The AIP is outbred and hence will have less additive genetic and additive by additive genetic interaction variance than the DGRP lines from which it was derived, but the AIP will also have dominance variance and interaction variance terms including dominance.
Lessons Learned
The DGRP and populations derived from it have been used for GWA mapping of many different quantitative traits (Table 3). Here we summarize the main results of these studies and the lessons learned from them regarding the genetic architecture of Drosophila quantitative traits.
Table 3. GWA analyses using the DGRP.
H2: broad sense heritability. N.D. not determined. N.A. not available. All published GWA analyses listed in PubMed as of May 31, 2017 are listed.
| Trait | Number of DGRP lines | H2 | Number of significant variants/genes | Number of Candidate Genes Validated/Tested | Reference |
|---|---|---|---|---|---|
| α-amanitin resistance | 180 | N.D. | N.A./11 | N.D. | 82 |
| alcohol sensitivity | 205 | 0.38-0.42 | 947/535 | 16/16 | 46 |
| aggression | 200 | 0.69 | 74/39 | 23/27 | 44 |
| chill coma recovery | 159 | 0.36 | 235/149 | N.D. | 11 |
| courtship behavior | 166 | 0.03-0.09 | 48/24 | N.D. | 83 |
| courtship song | 168 | 0.46 | 142/42 | N.D. | 84 |
| cuticular hydrocarbon composition | 157-169 | 0.22-0.98 | 822/478 | 24/24 | 85 |
| death following traumatic brain injury | 179 | N.D. | 216/98 | 1/1 | 86 |
| developmental time | 43 | 0.89 | 46/27 | N.D. | 87 |
| electrical shock avoidance | 38 | N.D. | 607/169 | 6/14 | 88 |
| ER stress | 114 | N.D. | 106/46 | 17/25 | 89 |
| fecundity, mated life span | 135-189 | 0.15-0.36 | 1031/549 | 14/14 | 90 |
| genome size | 205 | N.D. | 90/55b | N.D. | 12 |
| food intake | 182 | 0.45 | 74/54 | 24/31 | 73 |
| insecticide resistance | 178 | N.D. | 59/5 | 1/1 | 91 |
| lead toxicity | 200 | 0.76-0.80 | 216/123 | 13/16 | 92 |
| leg patterning | 117 | N.D. | 56/68 | 6/26 | 93 |
| male genital size and shape | 155 | 0.25-0.62 | 44/N.A. | N.D. | 94 |
| methylmercury tolerance | 173 | 0.80 | 589/251 | 2/2 | 95 |
| microbiota composition and nutritional indices | 79 | N.D. | 7/6 | 4/6 | 96 |
| microbiota-dependent nutrition | 108 | 0.31-0.73 | N.A./436 | 9/16 | 97 |
| micro-environmental plasticity | 174-201 | 0.36-0.75 | 232/120 | N.D. | 71 |
| mitochondrial function | 40 | 0.15-0.20 | 69/77 | 1/1 | 98 |
| mushroom body size | 40 | 0.12-0.38 | 357/139 | 24/57 | 99 |
| nutritional indices | 172 | N.D. | 48/23 | N.D. | 100 |
| olfactory behavior | 157 | 0.02-0.14 | 1370/N.A. | 6/7 | 101 |
| olfactory behavior | 164 | 0.45 | 184/176 | 14/18 | 43 |
| olfactory behavior | 186 | 0.14-0.33 | 3540/2154 | 15/17 | 52 |
| oxidative stress resistance | 167 | 0.36-0.48 | 452/395 | 7/7 | 102 |
| phenotypic variability of locomotion | 159 | N.D. | 36/22 | 1/1 | 72 |
| phototaxis | 191 | 0.27-0.33 | 3319/1387 | 49/54 | 47 |
| pigmentation | 175 | 0.66-0.88 | 155/84 | 17/28 | 48 |
| radiation resistance | 154 | >0.80 | 32/24 | N.D. | 103 |
| recombination rate | 205 | 0.12-0.41 | 160-688/N.A. | 8/20 | 104 |
| resistance and tolerance to bacterial infection | 172 | N.D. | 118/94 | 5/10 | 105 |
| resistance to bacterial infection | 172 | N.D. | 37/27 | 9/13 | 106 |
| resistance to fungal infection | 188 | 0.23-0.47 | 161/120 | 12/13 | 107 |
| resistance to viral infection | 185 | 0.07-0.34 | N.A./3 | 1/1 | 108 |
| sensitivity to oxidative stress | 192 | 0.14-0.41 | 1230/898 | 14/16 | 109 |
| sleep | 168 | 0.19-0.54 | 2427/1551 | 9/9 | 70 |
| startle response | 167 | 0.44 | 90/39 | N.D. | 11 |
| starvation resistance | 166 | 0.54 | 203/80 | N.D. | 11 |
| starvation resistance, body mass, body composition | 171-181 | N.D. | 17/12 | 4/4 | 110 |
| sperm competition | 39 | N.D. | N.A./33 | 3/4 | 111 |
| susceptibility to enteric infection | 140 | 0.61 | 27/8 | 1/1 | 112 |
| virgin egg retention | 90 | 0.60 | 29/15 | 4/6 | 113 |
| virgin female life span | 197 | 0.41 | N.A. | N.D. | 114 |
| wing morphology | 143 | 0.71-0.78 | 439/157 | 33/65 | 115 |
There is significant quantitative genetic variation (non-zero H2) in the DGRP for all traits assessed and published to date, from molecular traits (e.g., gene expression levels) to fitness-related traits (Table 3). Even given obvious publication bias (one cannot do a mapping analysis in the absence of genetic variation), the range of phenotypic variation among the DGRP lines is impressive despite the fact that all of these lines are by definition ‘wild type’.
The genetic architecture of the vast majority of quantitative traits is highly polygenic. The DGRP is adequately powered to detect common variants with moderately large to large effects (Figure 1). Such variants would be significant following correction for multiple tests. With ∼2.5 million individual common variant (MAF > 0.05) tests, the Bonferroni-corrected P-value for association is ∼P < 2 × 10⁻⁸. While such variants have been detected for organismal quantitative traits in the DGRP48, the P-values for association of the majority of variants fall below the Bonferroni-corrected significance threshold. However, quantile-quantile plots that graphically depict the relationship between the expected P value distribution under the null hypothesis of no association and the observed P value distributions typically show inflation below P-values < 10-5, suggesting enrichment of true positive associations below this threshold. GWA analyses in AIP populations have greater power to detect associations than the DGRP, and indeed these studies find many variants associated with organismal quantitative traits that are significant following Bonferroni correction. In contrast to organismal quantitative traits, gene expression traits tend to have simpler genetic architectures with one or a few large-effect variants41,49,50.
The distribution of effects follows an ‘exponential’ model first proposed by Alan Robertson51: many variants have small effects, while fewer have large effects. The effect of a variant is formally defined as one-half the difference in mean phenotype between individuals homozygous for the major allele and those homozygous for the minor allele. Effects of different phenotypes can be compared directly by scaling them by the phenotypic standard deviation of the trait. There is generally an inverse relationship between the magnitude of the effect and the MAF, such that variants at the low end of the frequency spectrum have larger effects than common variants11.
The DGRP facilitates evaluation of the effects of the same variants on males and females, as indicated by the magnitude of the cross-sex genetic correlation (rMF). rMF is estimated as , where is the covariance of male and female line means and σ̂LF and σ̂LM are, respectively, the square roots of the estimates of the among line (genetic) variances of the trait for males and females. If r̂MF is not significantly different from unity, the effects of the variants are the same in both sexes. However, if r̂MF is significantly different from unity, then the effects of variants have different magnitudes and/or directions between the two sexes. In this case, we observe genetic variation in sexual dimorphism (the average difference in trait mean between males and females). Genetic variation for sex dimorphism is the norm rather than the exception for Drosophila quantitative traits, and especially for gene expression traits17,41,49.
The majority of natural variants associated with quantitative traits are located in intronic or intergenic regions and hence presumably have a regulatory function. Many genes affecting quantitative traits assessed in the DGRP have been identified previously by classical screens of collections of mutations or RNAi lines. Surprisingly, common variants in these genes are rarely associated with these traits in the DGRP. It is possible that the genes identified via mutagenesis or suppression of gene expression are essential and do not have functional segregating polymorphisms in nature, or polymorphisms that do segregate are rare and not detectable by single variant GWA analysis. However, the GWA analyses do identify novel associations between computationally predicted genes and quantitative traits, thus providing the first functional annotations of these genes. The GWA analyses also identify novel associations between genes whose functions have been annotated (e.g., nervous system development) and quantitative traits (e.g., alcohol sensitivity), thus giving new biological insight regarding the genetic basis of trait variation. It is also often possible to put the genes associated with quantitative traits in the context of known genetic and protein interaction networks43,46,47,52, again contributing to knowledge of the underlying trait biology. Thus, GWA analyses using the DGRP complement classical mutational analyses of quantitative traits. Analysis of variation in gene expression using RNA sequencing and tiling microarrays revealed many novel transcribed regions41 not detected by the modENCODE project53, emphasizing the importance of considering a diversity of wild type genotypes when performing functional annotation within a species.
The advantage of the Drosophila model is that we can readily test gene-level hypotheses by assessing the effects of candidate genes implicated by the DGRP GWA analyses by using RNAi-mediated knock down of gene expression in a common background54 or collections of mutations that have been induced in a common isogenic background55,56. The overall rate of validation using these approaches is 69.5% (Table 3); much greater than would be expected by randomly screening these resources to identify genes affecting the traits57–61.
-
Not all variants will exert their effects on quantitative traits by altering gene expression; many genes do not have induced mutations in an isogenic background with a corresponding control; mutations and RNAi knock down of gene expression are likely to have different effects than subtle naturally occurring variants; and many natural variants significantly associated with traits are in intergenic regions. These observations suggest a change of focus for functional validation from the gene to the variant. Indeed, this was the motivation for deriving AIP lines. The expectation was that the true positive variants among the variants with low P-values in the DGRP GWA analyses that were present in the AIP would be confirmed by extreme QTL mapping in the AIP. However, this expectation has not yet been realized43–47. To date, all variants identified in the extreme QTL GWA analyses that were significant after Bonferroni correction for multiple tests and that are common in the DGRP actually have no discernable effects in the DGRP, which is totally inconsistent with additive genetic architecture.
The only viable explanation for this phenomenon is that these variants interact epistatically with another variant. While additive effects of variants are constant regardless of the allele frequency of other loci affecting the trait, a peculiarity of epistatic interactions is that the effect of the focal variant changes depending on the frequency of variants at one or more interacting loci62. Allele frequencies will typically be dramatically different between all DGRP lines and the smaller subset of DGRP lines used to derive an AIP, setting the stage for detecting epistatic interactions by population specific associations in the two populations. Indeed, screens for pairwise epistatic interactions using the significant variants detected in both the DGRP and the AIP GWA analyses reveal trait-specific gene-gene interaction networks44,45. Genes identified in both the DGRP and AIP map to these networks, and are often either directly connected or connected via another gene in the network. Variants that have significant effects on the trait mean in the AIP population but not the DGRP have the interesting property that they affect the among line variance in the DGRP. That is, there is a difference in variance among the DGRP lines between the two homozygous genotypes44 so the variant is a ‘variance QTL’ (vQTL). Therefore, performing a GWA analyses for vQTL is an effective way to prioritize variants to include in an analysis of pairwise epistasis as it reduces the number of tests to be performed63. When applied to gene expression data, vQTLs were enriched for epistatic interactions with between cis and trans acting variants41.
The prevalence of epistatic interactions affecting Drosophila quantitative traits means that the DGRP can be used to screen for modifiers of induced mutations or transgenic constructs. One experimental design is to substitute entire isogenic chromosomes containing a single mutation or their co-isogenic wild type control into the homozygous genetic background of DGRP lines64,65. These studies showed that the DGRP lines harbor variants that tend to largely suppress the effects of new induced mutations. However, it is laborious and time consuming to create chromosome substitution lines. F1 screens are easier to implement and have been used to uncover substantial cryptic variation in the DGRP and perform GWA analyses to identify candidate variants affecting olfactory behaviour66 and adult eye phenotypes resulting from expression of a dominant mutation of human proinsulin67,68 or a Drosophila model of retinitis pigmentosa in larval eye imaginal discs69.
Although individuals of a DGRP line are nearly genetically identical, they do not have exactly the same phenotypes for quantitative traits. This within-line phenotypic variation is almost entirely due to small and uncontrollable differences in the developmental, physical and social environments to which the individuals are exposed. Most studies using the DGRP quantify the phenotype of interest for many individuals per line, thus enabling analysis of the extent to which environmental variance varies across the lines, and hence is itself under genetic control. Perhaps surprisingly, substantial genetic variation in environmental variance (“micro-environmental plasticity”) has been observed in the DGRP lines for sleep traits70, starvation resistance, time to recover from a chill-induced coma and startle response71, locomotor handedness72, food consumption73 and genome wide gene expression74. Heritabilities of micro-environmental plasticity are surprisingly high, of the same order as heritabilities of the trait means70,71,73, and GWA analyses have implicated genes associated with plasticity traits that have been subsequently confirmed72,73. These studies add to the growing body of evidence for genetic control of micro-environmental plasticity75 and give insights about the major features of this phenomenon. Correlations of micro-environmental plasticity with the mean trait value range from 0-1; the phenomenon is trait-specific; and the degree of micro-environmental plasticity is not correlated with residual segregating variation71. Understanding the genetic basis of variation in micro-environmental plasticity impacts evolutionary theory; applied animal and plant breeding; and human health, where genetic variation in micro-environmental plasticity could contribute to variable penetrance and expressivity of risk alleles for common diseases.
One of the most significant advantages of using inbred strains is that identical genotypes can be obtained for an unlimited number of individuals. In addition to increased statistical power for GWA analyses, this also allows for different laboratories to openly share phenotypes, and thus gain an unprecedented understanding of pleiotropic effects of DNA variants and genes on multiple quantitative traits. We consider a non-exhaustive set of 61 traits with phenotype data on at least 100 lines (Table 3). Many of the traits are significantly genetically correlated (Figure 2a), which can arise because of directional pleiotropy in which the same variants affect multiple traits in the same direction, or co-segregation of linked variants affecting multiple traits2. The latter is a less likely explanation due to the rapid decline of LD with physical distance in the DGRP. Note, however, that there can be extensive pleiotropy that is not directional and thus not captured by the genetic correlation. Using starvation resistance as an example, we estimated the effects of variants significantly associated starvation resistance on other traits. While traits that correlate with starvation resistance tend to be impacted more by variants associated with starvation resistance, there are also traits whose genetic correlation with starvation resistance is small but is still affected by the pleiotropic effects of starvation resistance associated variants (Figure 2b). To characterize the extent of pleiotropy, single marker genetic effects are estimated and pleiotropy at the variant level is measured as the average of squared marker effects across 26 arbitrarily selected traits (marked as red in Figure 2b). Interestingly, while variants of different annotations do not appear to differ in their pleiotropic effects (Figure 2c), rarer variants are appreciably more pleiotropic than more common variants (Fig. 2d). Finally, within genes, different variants may be associated with different traits, thus exhibiting a pattern of gene-level pleiotropy (Figure 2e). It should be noted that the pleiotropic effects we estimate are only informative for traits that enter the analysis.
In contrast to human GWA analyses, where the significant variants explain only a small fraction of the total heritability of the trait, a phenomenon called “missing heritability”76,77, all variants significant in the Drosophila GWA analyses at a nominal P-value < 10-5 explain the majority of the total heritability11. However, for most purposes we are not so much interested in how well we can explain variation in a particular sample, but rather how well we can use the information from the GWA analyses to predict the quantitative trait phenotype of individuals for which only genotype information is known. One of the most commonly used techniques for genomic prediction is Genomic Best Linear Unbiased Predictor (GBLUP)78. The GBLUP model assumes that all polymorphic genotypes in a mapping population contribute additively, equally and negligibly to genetic variation for the trait1. However, applying this model to the Drosophila data gives very poor predictive ability27,79. There are many reasons for the poor predictive ability, including the small DGRP sample size and departure of the GBLUP assumptions from the true genetic architecture (not all loci contribute to all traits equally and epistatic effects). Indeed, prediction models that estimate and account for the observed genetic architecture, including epistatic interactions, have much greater predictive ability than the GBLUP model27.
Figure 2. Genetic correlation and pleiotropy in the DGRP.
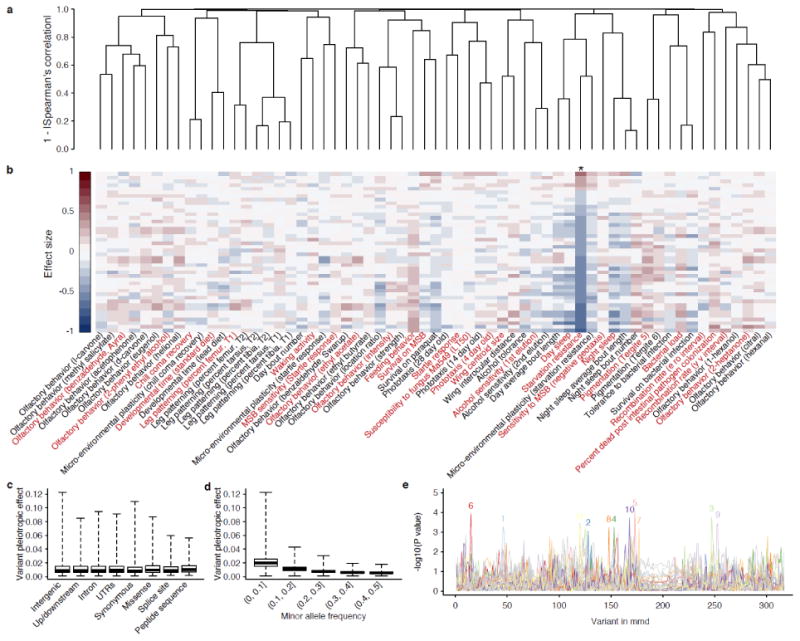
(a) Hierarchical clustering of line means across 61 published traits in females (Table 3). The distance between each pair of traits is measured as 1 - |Spearman's rank correlation|. Line means were normal quantile transformed and adjusted for Wolbachia and five major inversions before subsequent analyses. The names of the traits are annotated in (b). (b) Estimated allele effects of variants associated with starvation resistance on all traits. Each column on the heatmap represents a trait. The order of the traits follows (a) and is annotated only in (b). Starvation resistance is marked with an asterisk. (c) Box plots of pleiotropic effects of DNA variants across eight different annotation classes. The class “peptide sequence” indicates variants that create peptide sequence truncation or elongation by eliminating or introducing start and stop codons and frameshifts. When calculating pleiotropic effects, we arbitrarily select traits that are representative of a cluster from the same study. The selected traits are colored in red in (b). (d) Box plots of pleiotropic effects of DNA variants according to minor allele frequency. (e) Associations between 317 variants in the highly pleiotropic gene mmd are represented as –log10(P value) for each of the 61 traits. A total of 11 traits contained at least one variant with P < 0.001. For each of these traits, the strongest association is marked with a colored number on top of the peak, where 1=Olfactory behavior (benzaldehyde, Ref. 52), 2=Chill coma recovery, 3=Developmental time (standard diet), 4=Olfactory behavior (ethyl acetate), 5=Susceptibility to fungus Ma549 (LT50), 6=Phototaxis (4 day old), 7=Alcohol sensitivity (1st elution), 8=Night sleep, 9=Bacterial load, 10=Percent dead post intestinal pathogen colonization, 11=Recombination rate (y v interval).
Conclusion
Drosophila quantitative traits are highly polygenic, but do not conform to Fisher's additive, infinitesimal model of genetic variation for quantitative traits1. Drosophila quantitative traits clearly show heterogeneity of effect sizes, and variants at low frequency tend to have larger effects and exhibit a greater degree of pleiotropy. The vast majority of variants associated with Drosophila quantitative traits are in intergenic or intronic regions, suggesting that the small effects of single variants may be attributable to subtle regulatory variation. Although genes may be highly pleiotropic, affecting multiple quantitative traits, variants are less so, tending to be more trait-specific. Analysis of quantitative variation for many different traits in the DGRP has added novel functional annotations to both computationally predicted genes as well as genes that have been annotated with respect to other functions. Drosophila quantitative traits are highly context-dependent, and variants associated with variation in these traits have sex-, environment- and genetic background-dependent (epistatic) effects.
These features of the genetic architecture of quantitative traits are unlikely to be confined to Drosophila, but apply to other taxa, including humans. Indeed, epistasis for human complex traits could be one reason for the failure of GWA studies to replicate across populations62,116 and contribute to the missing heritability62,117. However, neither sex-specific nor epistatic effects are usually assessed in human GWA analyses, and strictly additive infinitesimal models are the norm for whole genome regression models used to explain the collective variance contributed by SNPs118,119
Pervasive epistasis for Drosophila quantitative traits impacts the annotation of effects of induced mutations and manipulation of gene expression in this species, since these analyses are either performed in a single genetic background, or the genetic background is ignored and unknown. Assessing effects of mutations or constructs affecting gene expression in the DGRP backgrounds is a valuable approach to determine what causes the background-specificity and to derive trait-specific genetic interaction networks. Further, analysis of pleiotropy in the DGRP reveals that many genes appear to be subdivided into functional domains, each of which affects different quantitative traits. Therefore, we need to think in terms of networks of interacting variants, rather than single variants or genes, as the relevant functional units affecting variation in quantitative traits.
In the future, the size of the DGRP needs to be increased by at least 10 fold. This will give increased power to detect main effects (Figure 1) and epistatic interactions; reduce the long-range LD caused by the small sample size; and enable the evaluation of effects of variants with frequencies between 1-5%, which seem to have larger effects than more common variants. Ideally, long read single molecule sequencing should be combined with short reads for de novo assembly to capture structural variants, sequences not present in the reference genome, transposons, and small inversions and translocations. CRISPR/Cas9 gene editing technology in Drosophila120 will play a critical role in future studies seeking to prove causality for additive effects of single variants detected by GWA analyses; assessing effects of possibly damaging low frequency variants segregating in the DGRP in multiple DGRP lines; and assessing causality of epistatic interactions. Gene editing technology will also enable the creation of designer genotypes via “molecular breeding”; combining multiple variants that either all increase or all decrease the trait value, giving insight about how far the trait value can be moved from the population mean and the fitness consequences of such extreme genotypes. Finally, the D. melanogaster modENCODE project gives unprecedented insight into functional genomic elements in this genetic model organism – for one strain53. There is no doubt that additional elements will be discovered by extending these analyses in the future to different DGRP backgrounds41.
Footnotes
No conflicts of Interest
Contributor Information
Trudy F.C. Mackay, Program in Genetics, W. M. Keck Center for Behavioral Biology and Department of Biological Sciences, North Carolina State University, Raleigh NC 27695-7614
Wen Huang, Program in Genetics, W. M. Keck Center for Behavioral Biology and Department of Biological Sciences, North Carolina State University, Raleigh NC 27695-7614.
References
- 1.Fisher RA. The correlation between relatives on the supposition of Mendelian inheritance. Trans R Soc Edinburgh. 1918;52:399–433. [Google Scholar]
- 2.Falconer DS, Mackay TFC. Introduction to Quantitative Genetics. Pearson Education Limited; 1996. [Google Scholar]
- 3.Lynch M, Walsh B. Genetics and Analysis of Quantitative Traits Genetics and Analysis of Quantitative Traits. 1998 [Google Scholar]
- 4.Greenspan RJ. Fly pushing: The Theory and Practice of Drosophila Genetics. Vol. 418. Cold Spring Harb Lab Press; 1997. [DOI] [Google Scholar]
- 5.Caligari PD, Mather K. Genotype-environment interaction. III. Interactions in Drosophila melanogaster. Proc R Soc London Ser B, Biol Sci. 1975;191:387–411. doi: 10.1098/rspb.1975.0135. [DOI] [PubMed] [Google Scholar]
- 6.Clayton GA, Knight GR, Morris JA, Robertson A. An experimental check on quantitative genetical theory. III. Correlated responses. J Genet. 1957;55:171–180. [Google Scholar]
- 7.Thoday JM. In: Quantitative Genetic Variation. Thompson JN, Thoday JM, editors. Academic Press; 1979. pp. 219–223. [Google Scholar]
- 8.Mackay TF, Langley CH. Molecular and phenotypic variation in the achaete-scute region of Drosophila melanogaster. Nature. 1990;348:64–66. doi: 10.1038/348064a0. [DOI] [PubMed] [Google Scholar]
- 9.Lai C, Lyman RF, Long AD, Langley CH, Mackay TF. Naturally occurring variation in bristle number and DNA polymorphisms at the scabrous locus of Drosophila melanogaster. Science. 1994;266:1697–1702. doi: 10.1126/science.7992053. [DOI] [PubMed] [Google Scholar]
- 10.Miyashita N, Langley CH. Molecular and phenotypic variation of the white locus region in Drosophila melanogaster. Genetics. 1988;120:199–212. doi: 10.1093/genetics/120.1.199. [DOI] [PMC free article] [PubMed] [Google Scholar]
- 11.Mackay TFC, Richards S, Stone EA, Barbadilla A, Ayroles JF, Zhu D, Casillas S, Han Y, Magwire MM, Cridland JM, et al. The Drosophila melanogaster Genetic Reference Panel. Nature. 2012;482:173–178. doi: 10.1038/nature10811. [DOI] [PMC free article] [PubMed] [Google Scholar]
- 12.Huang W, Massouras A, Inoue Y, Peiffer J, Ràmia M, Tarone AM, Turlapati L, Zichner T, Zhu D, Lyman RF, et al. Natural variation in genome architecture among 205 Drosophila melanogaster Genetic Reference Panel lines. Genome Res. 2014;24:1193–1208. doi: 10.1101/gr.171546.113. [DOI] [PMC free article] [PubMed] [Google Scholar]
- 13.Lander ES, Schork NJ. Genetic dissection of complex traits. Science. 1994;265:2037–2048. doi: 10.1126/science.8091226. [DOI] [PubMed] [Google Scholar]
- 14.Campbell CD, Ogburn EL, Lunetta KL, Lyon HN, Freedman ML, Groop LC, Altshuler D, Ardlie KG, Hirschhorn JN. Demonstrating stratification in a European American population. Nat Genet. 2005;37:868–872. doi: 10.1038/ng1607. [DOI] [PubMed] [Google Scholar]
- 15.Mukai T, Metteler LE, Chigusa SI. Linkage disquilibrium in a local population of Drosophila melanogaster. Proc Natl Acad Sci. 1971;65:1065–1069. doi: 10.1073/pnas.68.5.1065. [DOI] [PMC free article] [PubMed] [Google Scholar]
- 16.Langley CH, Ito K, Voelker RA. Linkage disequilibrium in natural populations of Drosophila melanogaster: seasonal variation. Genetics. 1977;86:447–454. [PMC free article] [PubMed] [Google Scholar]
- 17.Ayroles JF, Carbone MA, Stone EA, Jordan KW, Lyman RF, Magwire MM, Rollmann SM, Duncan LH, Lawrence F, Anholt RR, et al. Systems genetics of complex traits in Drosophila melanogaster. Nat Genet. 2009;41:299–307. doi: 10.1038/ng.332. [DOI] [PMC free article] [PubMed] [Google Scholar]
- 18.Pool JE, Aquadro CF. History and structure of sub-saharan populations of Drosophila melanogaster. Genetics. 2006;174:915–929. doi: 10.1534/genetics.106.058693. [DOI] [PMC free article] [PubMed] [Google Scholar]
- 19.Langley CH, Stevens K, Cardeno C, Lee YC, Schrider DR, Pool JE, Langley SA, Suarez C, Corbett-Detig RB, Kolaczkowski B, et al. Genomic variation in natural populations of Drosophila melanogaster. Genetics. 2012;192:533–598. doi: 10.1534/genetics.112.142018. [DOI] [PMC free article] [PubMed] [Google Scholar]
- 20.Langley CH, Crepeau M, Cardeno C, Corbett-Detig R, Stevens K. Circumventing heterozygosity: Sequencing the amplified genome of a single haploid Drosophila melanogaster embryo. Genetics. 2011;188:239–246. doi: 10.1534/genetics.111.127530. [DOI] [PMC free article] [PubMed] [Google Scholar]
- 21.Pool JE, Corbett-Detig RB, Sugino RP, Stevens KA, Cardeno CM, Crepeau MW, Duchen P, Emerson JJ, Saelao P, Begun DJ, et al. Population genomics of sub-Saharan Drosophila melanogaster: African diversity and non-African admixture. PLoS Genet. 2012;8:e1003080. doi: 10.1371/journal.pgen.1003080. [DOI] [PMC free article] [PubMed] [Google Scholar]
- 22.Nei M. Molecular Evolutionary Genetics. Vol. 17. Tempe AZ Arizona State University; 1987. [Google Scholar]
- 23.Watterson GA. On the number of segregating sites in genetical models without recombination. Theor Popul Biol. 1975;7:256–276. doi: 10.1016/0040-5809(75)90020-9. [DOI] [PubMed] [Google Scholar]
- 24.Stalker HD. Chromosome studies in wild populations of D. melanogaster. Genetics. 1976;82:323–347. doi: 10.1093/genetics/82.2.323. [DOI] [PMC free article] [PubMed] [Google Scholar]
- 25.Mettler LE, Voelker RA, Mukai T. Inversion clines in populations of Drosophila melanogaster. Genetics. 1977;87:169–176. doi: 10.1093/genetics/87.1.169. [DOI] [PMC free article] [PubMed] [Google Scholar]
- 26.Corbett-Detig RB, Hartl DL. Population genomics of inversion polymorphisms in Drosophila melanogaster. PLoS Genet. 2012;8:e1003056. doi: 10.1371/journal.pgen.1003056. [DOI] [PMC free article] [PubMed] [Google Scholar]
- 27.Ober U, Ayroles JF, Stone EA, Richards S, Zhu D, Gibbs RA, Stricker C, Gianola D, Schlather M, Mackay TFC, et al. Using whole-genome sequence data to predict quantitative trait phenotypes in Drosophila melanogaster. PLoS Genet. 2012;8:e1002685. doi: 10.1371/journal.pgen.1002685. [DOI] [PMC free article] [PubMed] [Google Scholar]
- 28.Hill WG, Robertson A. Linkage disequilibrium in finite populations. Theor Appl Genet. 1968;38:226–231. doi: 10.1007/BF01245622. [DOI] [PubMed] [Google Scholar]
- 29.Navarro A, Betrán E, Barbadilla A, Ruiz A. Recombination and gene flux caused by gene conversion and crossing over in inversion heterokaryotypes. Genetics. 1997;146:695–709. doi: 10.1093/genetics/146.2.695. [DOI] [PMC free article] [PubMed] [Google Scholar]
- 30.Andolfatto P, Depaulis F, Navarro A. Inversion polymorphisms and nucleotide variability in Drosophila. Genet Res. 2001;77:1–8. doi: 10.1017/s0016672301004955. [DOI] [PubMed] [Google Scholar]
- 31.Skelly DA, Magwene PM, Stone EA. Sporadic, global linkage disequilibrium between unlinked segregating sites. Genetics. 2016;202:427–437. doi: 10.1534/genetics.115.177816. [DOI] [PMC free article] [PubMed] [Google Scholar]
- 32.Huang W, Mackay TFC. The genetic architecture of quantitative traits cannot be inferred from variance component analysis. PLoS Genet. 2016;12:e1006421. doi: 10.1371/journal.pgen.1006421. [DOI] [PMC free article] [PubMed] [Google Scholar]
- 33.Kempthorne O. The theoretical values of correlations between relatives in random mating populations. Genetics. 1955;40:153–167. doi: 10.1093/genetics/40.2.153. [DOI] [PMC free article] [PubMed] [Google Scholar]
- 34.Bulmer MG. The Mathematical Theory of Quantitative Genetics. Claredon Press: 1985. [Google Scholar]
- 35.Madsen BE, Browning SR. A groupwise association test for rare mutations using a weighted sum statistic. PLoS Genet. 2009;5:e1000384. doi: 10.1371/journal.pgen.1000384. [DOI] [PMC free article] [PubMed] [Google Scholar]
- 36.Han F, Pan W. A data-adaptive sum test for disease association with multiple common or rare variants. Hum Hered. 2010;70:42–54. doi: 10.1159/000288704. [DOI] [PMC free article] [PubMed] [Google Scholar]
- 37.Neale BM, Rivas MA, Voight BF, Altshuler D, Devlin B, Orho-Melander M, Kathiresan S, Purcell SM, Roeder K, Daly MJ. Testing for an unusual distribution of rare variants. PLoS Genet. 2011;7:e1001322. doi: 10.1371/journal.pgen.1001322. [DOI] [PMC free article] [PubMed] [Google Scholar]
- 38.Li B, Leal SM. Discovery of rare variants via sequencing: Implications for the design of complex trait association studies. PLoS Genet. 2009;5:e1000481. doi: 10.1371/journal.pgen.1000481. [DOI] [PMC free article] [PubMed] [Google Scholar]
- 39.Wu MC, Kraft P, Epstein MP, Taylor DM, Chanock SJ, Hunter DJ, Lin X. Powerful SNP-set analysis for case-control genome-wide association studies. Am J Hum Genet. 2010;86:929–942. doi: 10.1016/j.ajhg.2010.05.002. [DOI] [PMC free article] [PubMed] [Google Scholar]
- 40.Price AL, Zaitlen NA, Reich D, Patterson N. New approaches to population stratification in genome-wide association studies. Nat Rev Genet. 2010;11:459–463. doi: 10.1038/nrg2813. [DOI] [PMC free article] [PubMed] [Google Scholar]
- 41.Huang W, Carbone MA, Magwire MM, Peiffer JA, Lyman RF, Stone EA, Anholt RR, Mackay TFC. Genetic basis of transcriptome diversity in Drosophila melanogaster. Proc Natl Acad Sci. 2015;112:E6010–E6019. doi: 10.1073/pnas.1519159112. [DOI] [PMC free article] [PubMed] [Google Scholar]
- 42.Ehrenreich IM, Torabi N, Jia Y, Kent J, Martis S, Shapiro JA, Gresham D, Caudy AA, Kruglyak L. Dissection of genetically complex traits with extremely large pools of yeast segregants. Nature. 2010;464:1039–1042. doi: 10.1038/nature08923. [DOI] [PMC free article] [PubMed] [Google Scholar]
- 43.Swarup S, Huang W, Mackay TFC, Anholt RRH. Analysis of natural variation reveals neurogenetic networks for Drosophila olfactory behavior. Proc Natl Acad Sci U S A. 2013;110:1017–1022. doi: 10.1073/pnas.1220168110. [DOI] [PMC free article] [PubMed] [Google Scholar]
- 44.Shorter J, Couch C, Huang W, Carbone MA, Peiffer J, Anholt RRH, Mackay TFC. Genetic architecture of natural variation in Drosophila melanogaster aggressive behavior. Proc Natl Acad Sci U S A. 2015;112:E3555–E3563. doi: 10.1073/pnas.1510104112. [DOI] [PMC free article] [PubMed] [Google Scholar]
- 45.Huang W, Richards S, Carbone MA, Zhu D, Anholt RRH, Ayroles JF, Duncan L, Jordan KW, Lawrence F, Magwire MM, et al. Epistasis dominates the genetic architecture of Drosophila quantitative traits. Proc Natl Acad Sci U S A. 2012;109:15553–15559. doi: 10.1073/pnas.1213423109. [DOI] [PMC free article] [PubMed] [Google Scholar]
- 46.Morozova TV, Huang W, Pray VA, Whitham T, Anholt RRH, Mackay TFC. Polymorphisms in early neurodevelopmental genes affect natural variation in alcohol sensitivity in adult drosophila. BMC Genomics. 2015;16:865. doi: 10.1186/s12864-015-2064-5. [DOI] [PMC free article] [PubMed] [Google Scholar]
- 47.Carbone MA, Yamamoto A, Huang W, Lyman RA, Meadors TB, Yamamoto R, Anholt RRH, Mackay TFC. Genetic architecture of natural variation in visual senescence in Drosophila. Proc Natl Acad Sci U S A. 2016;113:E6620–E6629. doi: 10.1073/pnas.1613833113. [DOI] [PMC free article] [PubMed] [Google Scholar]
- 48.Dembeck LM, Huang W, Magwire MM, Lawrence F, Lyman RF, Mackay TFC. Genetic architecture of abdominal pigmentation in Drosophila melanogaster. PLOS Genet. 2015;11:e1005163. doi: 10.1371/journal.pgen.1005163. [DOI] [PMC free article] [PubMed] [Google Scholar]
- 49.Massouras A, Waszak SM, Albarca-Aguilera M, Hens K, Holcombe W, Ayroles JF, Dermitzakis ET, Stone EA, Jensen JD, Mackay TFC, et al. Genomic variation and its impact on gene expression in Drosophila melanogaster. PLoS Genet. 2012;8:e1003055. doi: 10.1371/journal.pgen.1003055. [DOI] [PMC free article] [PubMed] [Google Scholar]
- 50.Cannavò E, Koelling N, Harnett D, Garfield D, Casale FP, Ciglar L, Gustafson HE, Viales RR, Marco-Ferreres R, Degner JF, et al. Genetic variants regulating expression levels and isoform diversity during embryogenesis. Nature. 2017;541:402–406. doi: 10.1038/nature20802. [DOI] [PubMed] [Google Scholar]
- 51.Robertson A. In: Heritage from Mendel. Brink A, editor. The University of Wisconsin Press; 1967. pp. 265–280. [Google Scholar]
- 52.Arya GH, Magwire MM, Huang W, Serrano-Negron YL, Mackay TFC, Anholt RRH. The genetic basis for variation in olfactory behavior in Drosophila melanogaster. Chem Senses. 2015;40:233–243. doi: 10.1093/chemse/bjv001. [DOI] [PMC free article] [PubMed] [Google Scholar]
- 53.Graveley BR, Brooks AN, Carlson JW, Duff MO, Landolin JM, Yang L, Artieri CG, van Baren MJ, Boley N, Booth BW, et al. The developmental transcriptome of Drosophila melanogaster. Nature. 2011;471:473–479. doi: 10.1038/nature09715. [DOI] [PMC free article] [PubMed] [Google Scholar]
- 54.Dietzl G, Chen D, Schnorrer F, Su KC, Barinova Y, Fellner M, Gasser B, Kinsey K, Oppel S, Scheiblauer S, et al. A genome-wide transgenic RNAi library for conditional gene inactivation in Drosophila. Nature. 2007;448:151–156. doi: 10.1038/nature05954. [DOI] [PubMed] [Google Scholar]
- 55.Ryder E, Blows F, Ashburner M, Bautista-Llacer R, Coulson D, Drummond J, Webster J, Gubb D, Gunton N, Johnson G, et al. The DrosDel collection: A set of P-element insertions for generating custom chromosomal aberrations in Drosophila melanogaster. Genetics. 2004;167:797–813. doi: 10.1534/genetics.104.026658. [DOI] [PMC free article] [PubMed] [Google Scholar]
- 56.Thibault ST, Singer MA, Miyazaki WY, Milash B, Dompe NA, Singh CM, Buchholz R, Demsky M, Fawcett R, Francis-Lang HL, et al. A complementary transposon tool kit for Drosophila melanogaster using P and piggyBac. Nat Genet. 2004;36:283–287. doi: 10.1038/ng1314. [DOI] [PubMed] [Google Scholar]
- 57.Anholt RRH, Lyman RF, Mackay TFC. Effects of single P-Element insertions on olfactory behavior in Drosophila melanogaster. Genetics. 1996;143:293–301. doi: 10.1093/genetics/143.1.293. [DOI] [PMC free article] [PubMed] [Google Scholar]
- 58.Lyman RF, Lawrence F, Nuzhdin SV, Mackay TFC. Effects of single P-element insertions on bristle number and viability in Drosophila melanogaster. Genetics. 1996;143:277–292. doi: 10.1093/genetics/143.1.277. [DOI] [PMC free article] [PubMed] [Google Scholar]
- 59.Norga KK, Gurganus MC, Dilda CL, Yamamoto A, Lyman RF, Patel PH, Rubin GM, Hoskins RA, Mackay TFC, Bellen HJ. Quantitative analysis of bristle number in Drosophila mutants identifies genes involved in neural development. Curr Biol. 2003;13:1388–1397. doi: 10.1016/s0960-9822(03)00546-3. [DOI] [PubMed] [Google Scholar]
- 60.Edwards AC, Zwarts L, Yamamoto A, Callaerts P, Mackay TFC. Mutations in many genes affect aggressive behavior in Drosophila melanogaster. BMC Biol. 2009;7:29. doi: 10.1186/1741-7007-7-29. [DOI] [PMC free article] [PubMed] [Google Scholar]
- 61.Magwire MM, Yamamoto A, Carbone MA, Roshina NV, Symonenko AV, Pasyukova EG, Morozova TV, Mackay TFC. Quantitative and molecular genetic analyses of mutations increasing Drosophila life span. PLoS Genet. 2010;6:e1001037. doi: 10.1371/journal.pgen.1001037. doi:0.1371/journal.pgen.1001037. [DOI] [PMC free article] [PubMed] [Google Scholar]
- 62.Mackay TFC. Epistasis and quantitative traits: using model organisms to study gene-gene interactions. Nat Rev Genet. 2014;15:22–33. doi: 10.1038/nrg3627. [DOI] [PMC free article] [PubMed] [Google Scholar]
- 63.Rönnegård L, Valdar W. Detecting major genetic loci controlling phenotypic variability in experimental crosses. Genetics. 2011;188:435–447. doi: 10.1534/genetics.111.127068. [DOI] [PMC free article] [PubMed] [Google Scholar]
- 64.Yamamoto A, Anholt RRH, Mackay TFC. Epistatic interactions attenuate mutations affecting startle behaviour in Drosophila melanogaster. Genet Res. 2009;91:373–382. doi: 10.1017/S0016672309990279. [DOI] [PubMed] [Google Scholar]
- 65.Swarup S, Harbison ST, Hahn LE, Morozova TV, Yamamoto A, Mackay TFC, Anholt RRH. Extensive epistasis for olfactory behaviour, sleep and waking activity in Drosophila melanogaster. Genet Res. 2012;94:9–20. doi: 10.1017/S001667231200002X. [DOI] [PMC free article] [PubMed] [Google Scholar]
- 66.He X, Zhou S, St Armour GE, Mackay TFC, Anholt RRH. Epistatic partners of neurogenic genes modulate Drosophila olfactory behavior. Genes, Brain Behav. 2016;15:280–290. doi: 10.1111/gbb.12279. [DOI] [PMC free article] [PubMed] [Google Scholar]
- 67.He BZ, Ludwig MZ, Dickerson DA, Barse L, Arun B, Vilhjálmsson BJ, Jiang P, Park SY, Tamarina NA, Selleck SB, et al. Effect of genetic variation in a Drosophila model of diabetes-associated misfolded human proinsulin. Genetics. 2014;196:557–567. doi: 10.1534/genetics.113.157800. [DOI] [PMC free article] [PubMed] [Google Scholar]
- 68.Park SY, Ludwig MZ, Tamarina NA, He BZ, Carl SH, Dickerson DA, Barse L, Arun B, Williams CL, Miles CM, et al. Genetic complexity in a Drosophila model of diabetes-associated misfolded human proinsulin. Genetics. 2014;196:539–555. doi: 10.1534/genetics.113.157602. [DOI] [PMC free article] [PubMed] [Google Scholar]
- 69.Chow CY, Kelsey KJP, Wolfner MF, Clark AG. Candidate genetic modifiers of retinitis pigmentosa identified by exploiting natural variation in Drosophila. Hum Mol Genet. 2016;25:651–659. doi: 10.1093/hmg/ddv502. [DOI] [PMC free article] [PubMed] [Google Scholar]
- 70.Harbison ST, McCoy LJ, Mackay TF. Genome-wide association study of sleep in Drosophila melanogaster. BMC Genomics. 2013;14:281. doi: 10.1186/1471-2164-14-281. [DOI] [PMC free article] [PubMed] [Google Scholar]
- 71.Morgante F, Sørensen P, Sorensen DA, Maltecca C, Mackay TFC. Genetic architecture of micro-environmental plasticity in Drosophila melanogaster. Sci Rep. 2015;5:9785. doi: 10.1038/srep09785. [DOI] [PMC free article] [PubMed] [Google Scholar]
- 72.Ayroles JF, Buchanan SM, O'Leary C, Skutt-Kakaria K, Grenier JK, Clark AG, Hartl DL, de Bivort BL. Behavioral idiosyncrasy reveals genetic control of phenotypic variability. Proc Natl Acad Sci U S A. 2015;112:201503830. doi: 10.1073/pnas.1503830112. [DOI] [PMC free article] [PubMed] [Google Scholar]
- 73.Garlapow ME, Huang W, Yarboro MT, Peterson KR, Mackay TFC. Quantitative genetics of food intake in Drosophila melanogaster. PLoS One. 2015;10:e0138129. doi: 10.1371/journal.pone.0138129. [DOI] [PMC free article] [PubMed] [Google Scholar]
- 74.Lin Y, Chen ZX, Oliver B, Harbison ST. Micro-environmental gene expression plasticity among individual Drosophila melanogaster. G3. 2016;6:4197–4210. doi: 10.1534/g3.116.035444. [DOI] [PMC free article] [PubMed] [Google Scholar]
- 75.Hill WG, Mulder H. Genetic analysis of environmental variation. Genet Res. 2010;92:381–395. doi: 10.1017/S0016672310000546. [DOI] [PubMed] [Google Scholar]
- 76.Manolio TA, Collins FS, Cox NJ, Goldstein DB, Hindorff LA, Hunter DJ, McCarthy MI, Ramos EM, Cardon LR, Chakravarti A, et al. Finding the missing heritability of complex diseases. Nature. 2009;461:747–753. doi: 10.1038/nature08494. [DOI] [PMC free article] [PubMed] [Google Scholar]
- 77.Lango Allen H, Estrada K, Lettre G, Berndt SI, Weedon MN, Rivadeneira F, Willer CJ, Jackson AU, Vedantam S, Raychaudhuri S, et al. Hundreds of variants clustered in genomic loci and biological pathways affect human height. Nature. 2010;467:832–838. doi: 10.1038/nature09410. [DOI] [PMC free article] [PubMed] [Google Scholar]
- 78.VanRaden PM. Efficient methods to compute genomic predictions. J Dairy Sci. 2008;91:4414–4423. doi: 10.3168/jds.2007-0980. [DOI] [PubMed] [Google Scholar]
- 79.Ober U, Huang W, Magwire MM, Schlather M, Simianer H, Mackay TFC. Accounting for genetic architecture improves sequence based genomic prediction for a Drosophila fitness trait. PLoS One. 2015;10:e0126880. doi: 10.1371/journal.pone.0126880. [DOI] [PMC free article] [PubMed] [Google Scholar]
- 80.Cingolani P, Platts A, Wang le L, Coon M, Nguyen T, Wang L, Land SJ, Lu X, Ruden DM. A program for annotating and predicting the effects of single nucleotide polymorphisms, SnpEff: SNPs in the genome of Drosophila melanogaster strain w1118; iso-2; iso-3. Fly. 2012;6:80–92. doi: 10.4161/fly.19695. [DOI] [PMC free article] [PubMed] [Google Scholar]
- 81.Marygold SJ, Leyland PC, Seal RL, Goodman JL, Thurmond J, Strelets VB, Wilson RJ, FlyBase consortium FlyBase: Improvements to the bibliography. Nucleic Acids Res. 2013;41:D751–D757. doi: 10.1093/nar/gks1024. [DOI] [PMC free article] [PubMed] [Google Scholar]
- 82.Mitchell CL, Latuszek CE, Vogel KR, Greenlund IM, Hobmeier RE, Ingram OK, Dufek SR, Pecore JL, Nip FR, Johnson ZJ, et al. α-amanitin resistance in Drosophila melanogaster: A genome-wide association approach. PLoS One. 2017;12:e0173162. doi: 10.1371/journal.pone.0173162. [DOI] [PMC free article] [PubMed] [Google Scholar]
- 83.Gaertner BE, Ruedi EA, McCoy LJ, Moore JM, Wolfner MF, Mackay TFC. Heritable variation in courtship patterns in Drosophila melanogaster. G3. 2015;5:531–539. doi: 10.1534/g3.114.014811. [DOI] [PMC free article] [PubMed] [Google Scholar]
- 84.Turner TL, Miller PM, Cochrane VA. Combining genome-wide methods to investigate the genetic complexity of courtship song variation in drosophila melanogaster. Mol Biol Evol. 2013;30:2113–2120. doi: 10.1093/molbev/mst111. [DOI] [PMC free article] [PubMed] [Google Scholar]
- 85.Dembeck LM, Böröczky K, Huang W, Schal C, Anholt RRH, Mackay TFC. Genetic architecture of natural variation in cuticular hydrocarbon composition in Drosophila melanogaster. Elife. 2015;4:e09861. doi: 10.7554/eLife.09861. [DOI] [PMC free article] [PubMed] [Google Scholar]
- 86.Katzenberger RJ, Chtarbanova S, Rimkus SA, Fischer JA, Kaur G, Seppala JM, Swanson LC, Zajac JE, Ganetzky B, Wassarman DA. Death following traumatic brain injury in Drosophila is associated with intestinal barrier dysfunction. Elife. 2015;4 doi: 10.7554/eLife.04790. [DOI] [PMC free article] [PubMed] [Google Scholar]
- 87.Horváth B, Betancourt AJ, Kalinka AT. A novel method for quantifying the rate of embryogenesis uncovers considerable genetic variation for the duration of embryonic development in Drosophila melanogaster. BMC Evol Biol. 2016;16:200. doi: 10.1186/s12862-016-0776-z. [DOI] [PMC free article] [PubMed] [Google Scholar]
- 88.Appel M, Scholz CJ, Müller T, Dittrich M, König C, Bockstaller M, Oguz T, Khalili A, Antwi-Adjei E, Schauer T, et al. Genome-wide association analyses point to candidate genes for electric shock avoidance in Drosophila melanogaster. PLoS One. 2015;10:e0126986. doi: 10.1371/journal.pone.0126986. [DOI] [PMC free article] [PubMed] [Google Scholar]
- 89.Chow CY, Wolfner MF, Clark AG. Using natural variation in Drosophila to discover previously unknown endoplasmic reticulum stress genes. Proc Natl Acad Sci U S A. 2013;110:9013–9018. doi: 10.1073/pnas.1307125110. [DOI] [PMC free article] [PubMed] [Google Scholar]
- 90.Durham MF, Magwire MM, Stone EA, Leips J. Genome-wide analysis in Drosophila reveals age-specific effects of SNPs on fitness traits. Nat Commun. 2014;5:1–8. doi: 10.1038/ncomms5338. [DOI] [PubMed] [Google Scholar]
- 91.Battlay P, Schmidt JM, Fournier-Level A, Robin C. Genomic and transcriptomic associations identify a new insecticide resistance phenotype for the selective sweep at the Cyp6g1 locus of Drosophila melanogaster. G3. 2016;6:2573–2581. doi: 10.1534/g3.116.031054. [DOI] [PMC free article] [PubMed] [Google Scholar]
- 92.Zhou S, Morozova TV, Hussain YN, Luoma SE, McCoy L, Yamamoto A, Mackay TFC, Anholt RRH. The genetic basis for variation in sensitivity to lead toxicity in Drosophila melanogaster. Environ Health Perspect. 2016;124:1062–1070. doi: 10.1289/ehp.1510513. [DOI] [PMC free article] [PubMed] [Google Scholar]
- 93.Grubbs N, Leach M, Su X, Petrisko T, Rosario JB, Mahaffey JW. New components of Drosophila leg development identified through genome wide association studies. PLoS One. 2013;8:e60261. doi: 10.1371/journal.pone.0060261. [DOI] [PMC free article] [PubMed] [Google Scholar]
- 94.Takahara B, Takahashi KH. Genome-wide association study on male genital shape and size in Drosophila melanogaster. PLoS One. 2015;10:e0132846. doi: 10.1371/journal.pone.0132846. [DOI] [PMC free article] [PubMed] [Google Scholar]
- 95.Montgomery SL, Vorojeikina D, Huang W, Mackay TFC, Anholt RRH, Rand MD. Genome-wide association analysis of tolerance to methylmercury toxicity in Drosophila implicates myogenic and neuromuscular developmental pathways. PLoS One. 2014;9:e110375. doi: 10.1371/journal.pone.0110375. [DOI] [PMC free article] [PubMed] [Google Scholar]
- 96.Chaston JM, Dobson AJ, Newell PD, Douglas AE. Host genetic control of the microbiota mediates the Drosophila nutritional phenotype. Appl Environ Microbiol. 2016;82:671–679. doi: 10.1128/AEM.03301-15. [DOI] [PMC free article] [PubMed] [Google Scholar]
- 97.Dobson AJ, Chaston JM, Newell PD, Donahue L, Hermann SL, Sannino DR, Westmiller S, Wong AC, Clark AG, Lazzaro BP, et al. Host genetic determinants of microbiota-dependent nutrition revealed by genome-wide analysis of Drosophila melanogaster. Nat Commun. 2015;6:6312. doi: 10.1038/ncomms7312. [DOI] [PMC free article] [PubMed] [Google Scholar]
- 98.Jumbo-Lucioni P, Bu S, Harbison ST, Slaughter JC, Mackay TFC, Moellering DR, De Luca M. Nuclear genomic control of naturally occurring variation in mitochondrial function in Drosophila melanogaster. BMC Genomics. 2012;13:659. doi: 10.1186/1471-2164-13-659. [DOI] [PMC free article] [PubMed] [Google Scholar]
- 99.Zwarts L, Vanden Broeck L, Cappuyns E, Ayroles JF, Magwire MM, Vulsteke V, Clements J, Mackay TFC, Callaerts P. The genetic basis of natural variation in mushroom body size in Drosophila melanogaster. Nat Commun. 2015;6:10115. doi: 10.1038/ncomms10115. [DOI] [PMC free article] [PubMed] [Google Scholar]
- 100.Unckless RL, Rottschaefer SM, Lazzaro BP. A genome-wide association study for nutritional indices in Drosophila. G3. 2015;5:417–425. doi: 10.1534/g3.114.016477. [DOI] [PMC free article] [PubMed] [Google Scholar]
- 101.Brown EB, Layne JE, Zhu C, Jegga AG, Rollmann SM. Genome-wide association mapping of natural variation in odour-guided behaviour in Drosophila. Genes, Brain Behav. 2013;12:503–515. doi: 10.1111/gbb.12048. [DOI] [PubMed] [Google Scholar]
- 102.Weber AL, Khan GF, Magwire MM, Tabor CL, Mackay TFC, Anholt RRH. Genome-wide association analysis of oxidative stress resistance in Drosophila melanogaster. PLoS One. 2012;7:e34745. doi: 10.1371/journal.pone.0034745. [DOI] [PMC free article] [PubMed] [Google Scholar]
- 103.Vaisnav M, Xing C, Ku HC, Hwang D, Stojadinovic S, Pertsemlidis A, Abrams JM. Genome-wide association analysis of radiation resistance in Drosophila melanogaster. PLoS One. 2014;9:e104858. doi: 10.1371/journal.pone.0104858. [DOI] [PMC free article] [PubMed] [Google Scholar]
- 104.Hunter CM, Huang W, Mackay TFC, Singh ND. The genetic architecture of natural variation in recombination rate in Drosophila melanogaster. PLoS Genet. 2016;12:e1005951. doi: 10.1371/journal.pgen.1005951. [DOI] [PMC free article] [PubMed] [Google Scholar]
- 105.Howick VM, Lazzaro BP. The genetic architecture of defence as resistance to and tolerance of bacterial infection in Drosophila melanogaster. Mol Ecol. 2017;26:1533–1546. doi: 10.1111/mec.14017. [DOI] [PubMed] [Google Scholar]
- 106.Unckless RL, Rottschaefer SM, Lazzaro BP. The complex contributions of genetics and nutrition to immunity in Drosophila melanogaster. PLoS Genet. 2015;11:e1005030. doi: 10.1371/journal.pgen.1005030. [DOI] [PMC free article] [PubMed] [Google Scholar]
- 107.Wang JB, Lu HL, St Leger RJ. The genetic basis for variation in resistance to infection in the Drosophila melanogaster Genetic Reference Panel. PLoS Pathog. 2017;13:e1006260. doi: 10.1371/journal.ppat.1006260. [DOI] [PMC free article] [PubMed] [Google Scholar]
- 108.Magwire MM, Fabian DK, Schweyen H, Cao C, Longdon B, Bayer F, Jiggins FM. Genome-wide association studies reveal a simple genetic basis of resistance to naturally coevolving viruses in Drosophila melanogaster. PLoS Genet. 2012;8:e1003057. doi: 10.1371/journal.pgen.1003057. [DOI] [PMC free article] [PubMed] [Google Scholar]
- 109.Jordan KW, Craver KL, Magwire MM, Cubilla CE, Mackay TFC, Anholt RRH. Genome-wide association for sensitivity to chronic oxidative stress in Drosophila melanogaster. PLoS One. 2012;7:e38722. doi: 10.1371/journal.pone.0038722. [DOI] [PMC free article] [PubMed] [Google Scholar]
- 110.Nelson CS, Beck JN, Wilson KA, Pilcher ER, Kapahi P, Brem RB. Cross-phenotype association tests uncover genes mediating nutrient response in Drosophila. BMC Genomics. 2016;17:867. doi: 10.1186/s12864-016-3137-9. [DOI] [PMC free article] [PubMed] [Google Scholar]
- 111.Chow CY, Wolfner MF, Clark AG. Large neurological component to genetic differences underlying biased sperm use in Drosophila. Genetics. 2013;193:177–185. doi: 10.1534/genetics.112.146357. [DOI] [PMC free article] [PubMed] [Google Scholar]
- 112.Bou Sleiman MS, Osman D, Massouras A, Hoffmann AA, Lemaitre B, Deplancke B. Genetic, molecular and physiological basis of variation in Drosophila gut immunocompetence. Nat Commun. 2015;6:7829. doi: 10.1038/ncomms8829. [DOI] [PMC free article] [PubMed] [Google Scholar]
- 113.Akhund-Zade J, Bergland AO, Crowe SO, Unckless RL. The genetic basis of natural variation in Drosophila (Diptera: Drosophilidae) virgin egg retention. J Insect Sci. 2017;17:5. doi: 10.1093/jisesa/iew094. [DOI] [PMC free article] [PubMed] [Google Scholar]
- 114.Ivanov DK, Escott-Price V, Ziehm M, Magwire MM, Mackay TFC, Partridge L, Thornton JM. Longevity GWAS using the Drosophila Genetic Reference Panel. J Gerontol - Ser A Biol Sci Med Sci. 2015;70:1470–1478. doi: 10.1093/gerona/glv047. [DOI] [PMC free article] [PubMed] [Google Scholar]
- 115.Vonesch SC, Lamparter D, Mackay TFC, Bergmann S, Hafen E. Genome-wide analysis reveals novel regulators of growth in Drosophila melanogaster. PLoS Genet. 2016;12:e1005616. doi: 10.1371/journal.pgen.1005616. [DOI] [PMC free article] [PubMed] [Google Scholar]
- 116.Greene CS, Penrod NM, Williams SM, Moore JH. Failure to replicate a genetic association may provide important clues about genetic architecture. PLoS One. 2009;4:e5639. doi: 10.1371/journal.pone.0005639. [DOI] [PMC free article] [PubMed] [Google Scholar]
- 117.Zuk O, Hechter E, Sunyaev SR, Lander ES. The mystery of missing heritability: Genetic interactions create phantom heritability. Proc Natl Acad Sci U S A. 2012;109:1193–1198. doi: 10.1073/pnas.1119675109. [DOI] [PMC free article] [PubMed] [Google Scholar]
- 118.Yang J, Benyamin B, McEvoy BP, Gordon S, Henders AK, Nyholt DR, Madden PA, Heath AC, Martin NG, Montgomery GW, et al. Common SNPs explain a large proportion of the heritability for human height. Nat Gen. 2010;42:565–569. doi: 10.1038/ng.608. [DOI] [PMC free article] [PubMed] [Google Scholar]
- 119.Yang J, Lee SH, Goddard ME, Visscher PM. GCTA: A tool for genome-wide complex trait analysis. Am J Hum Genet. 2011;88:76–82. doi: 10.1016/j.ajhg.2010.11.011. [DOI] [PMC free article] [PubMed] [Google Scholar]
- 120.Bassett AR, Liu JL. CRISPR/Cas9 and genome editing in Drosophila. J Genet Genomics. 2014;41:7–19. doi: 10.1016/j.jgg.2013.12.004. [DOI] [PubMed] [Google Scholar]