

Abstract
Objective
Cholesterol metabolism is a dynamic process involving intracellular trafficking, cholesterol esterification, and cholesterol ester hydrolysis. Our objective was to identify genes that regulate macrophage cholesterol metabolism.
Approaches and Results
We performed quantitative trait loci mapping of free and esterified cholesterol levels, and the ratio of esterified to free cholesterol in acetylated LDL loaded bone marrow-derived macrophages from an AKR x DBA/2 strain intercross. Ten distinct cholesterol modifier loci were identified, and bioinformatics was utilized to prioritize candidate genes. The strongest locus was located on distal chromosome 1, which we named macrophage cholesterol metabolism modifier 1 (Mcmm1). This locus harbors the Sterol O-acyltransferase 1 (Soat1) gene, encoding Acyl-Coenzyme A: cholesterol acyltransferase 1 (ACAT1), which esterifies free cholesterol. The parental AKR strain has an exon 2 deletion in Soat1, which leads to a 33 amino acid N-terminal truncation in ACAT1. CRISPR/Cas9 editing of DBA/2 embryonic stem cells was performed to replicate the AKR strain Soat1 exon 2 deletion, while leaving the remainder of the genome unaltered. DBA/2 stem cells, and stem cells heterozygous and homozygous for the Soat1 exon 2 deletion were differentiated into macrophages and loaded with acetylated LDL. DBA/2 stem cell-derived macrophages accumulated less free cholesterol and more esterified cholesterol relative to cells heterozygous and homozygous for the Soat1 exon 2 deletion.
Conclusions
A Soat1 deletion present in AKR mice, and resultant N-terminal ACAT1 truncation, was confirmed to be a significant modifier of macrophage cholesterol metabolism. Other Mcmm loci candidate genes were prioritized via bioinformatics.
Keywords: cholesterol, cholesterol homeostasis, foam cells, macrophage, genetic association
Subject codes: Lipids and Cholesterol, Genetic, Association Studies, Functional Genomics, Information Technology, Genetics
The pathobiology of atherosclerosis is complex, but macrophage foam cells are recognized as central players.1 Foam cells are cholesterol-laden macrophages that accumulate in the arterial intima during atherosclerosis pathology where they increase plaque burden and drive local inflammation. Foam cells store excess cholesterol as cholesterol esters (CE) in cytosolic lipid droplets, which must be hydrolyzed to unesterified, or free cholesterol (FC) in order to be effluxed from the cell.2 In an athero-protective process known as reverse cholesterol transport, FC is effluxed to apoA1 or HDL and trafficked to the liver for processing. In the context of atherosclerosis, this process can be thought of as “macrophage reverse cholesterol transport”, as macrophages harbor the bulk of cholesterol in early lesions.3 Foam cell CE hydrolysis is thought to be the rate-limiting step in macrophage reverse cholesterol transport.4
Macrophages can uptake modified forms of LDL via scavenger receptors, which are trafficked to the lysosome for degradation. After LDL degradation, FC is released from the lysosome and enters the CE cycle, with esterified cholesterol stored in LDs, which can undergo re-hydrolysis back to FC.5 CE synthesis is catalyzed by acyl-coenzyme A:cholesterol acyltransferase (ACAT) enzymes, of which there are two isoenzymes: ACAT1 and ACAT2, encoded by the Soat1 and Soat2 (sterol O-acyltransferase) genes, respectively. ACAT1 is the major isoenzyme expressed in macrophages, and importantly, ACAT1 is robustly expressed in foam cells present in atherosclerotic plaque.6 Until relatively recently, it was thought that multiple cytosolic neutral cholesterol hydrolases were responsible for CE hydrolysis, however recent studies have identified an acid hydrolase, lysosomal acid lipase, as a significant contributor to CE hydrolysis in multiple cell types including macrophages.7 Autophagy mediates the lysosomal acid lipase-driven hydrolysis of lipid droplet CE. Work in our laboratory confirmed the role of lysosomal acid lipase and autophagy in macrophage CE hydrolysis, and further, we demonstrated that macrophage autophagic flux is impaired in athero-sensitive DBA/2 mice.8
Here, we employ quantitative trait locus (QTL) mapping to identify candidate genes that regulate cholesterol metabolism in bone marrow-derived macrophages (BMDMs) derived from an AKR x DBA/2 F4 strain intercross. AKR and DBA/2 mice differ substantially in their susceptibility to atherosclerosis, where DBA/2 apoE−/− mice develop ~ ten times larger aortic root lesions than AKR apoE−/− mice, and cultured BMDMs from DBA/2 vs. AKR mice accumulate much more CE after cholesterol loading with acetylated LDL (acLDL).9 Our aim was to discover genes that play causal roles in macrophage cholesterol metabolism, which could become future targets for cardiovascular disease therapeutics. We discovered numerous macrophage cholesterol metabolism modifier (Mcmm) QTLs, most notably a highly significant QTL at the distal end of chromosome 1 (Mcmm1) that modulates macrophage levels of FC, CE, and the CE/FC ratio after acLDL loading. Mcmm1 harbors the Soat1 gene. This gene has previously been shown to have a deletion in the AKR strain, leading to an N-terminal truncated ACAT1 protein, but the truncation did not alter ACAT1 activity.10 Here we used CRISPR/Cas9 to create this Soat1 deletion in DBA/2 embryonic stem (ES) cells. AcLDL loading studies performed on macrophages differentiated from these ES cells validated Soat1 as the causal cholesterol metabolism modifier gene at the Mcmm1 locus. Additionally, candidate genes at other QTLs were prioritized utilizing a combination of bioinformatics and prior BMDM cis-expression QTL (cis-eQTL) data from AKR x DBA/2 F2 crosses. Genes involved in autophagy or lysosome function were among some of the top candidates, most notably Vps39 (vacuolar protein sorting 39), which is implicated in autophagosome-lysosome fusion.
Methods
A detailed Materials and Methods section is available in an online-only Data Supplement.
Results
A highly significant QTL for cholesterol metabolism phenotypes maps to chromosome 1
Our prior study revealed DBA/2 macrophages accumulate ~ twice as much CE as AKR cells, while AKR macrophages accumulate ~ twice as much FC after acLDL loading, amounting to an ~ 3 to 4-fold strain difference in CE/FC ratio.8 We acLDL loaded BMDMs from 122 AKR x DBA/2 F4 mice and measured their FC and CE levels normalized to cell protein, as well as their CE/FC ratio. There was no significant effect of sex on these phenotypes, so we combined data from the male and female BMDMs. There was a broad range of FC and CE values for the F4 mice which were normally distributed (Figure 1A,B). The CE/FC ratios were not normally distributed, so a square root transformation was performed to achieve normal distribution of the data (Figure 1C). After genotyping using a high density SNP microarray (Figure I in the online-only Data Supplement), we performed QTL mapping of these BMDM cholesterol phenotypes (Figure 2).
Figure 1.
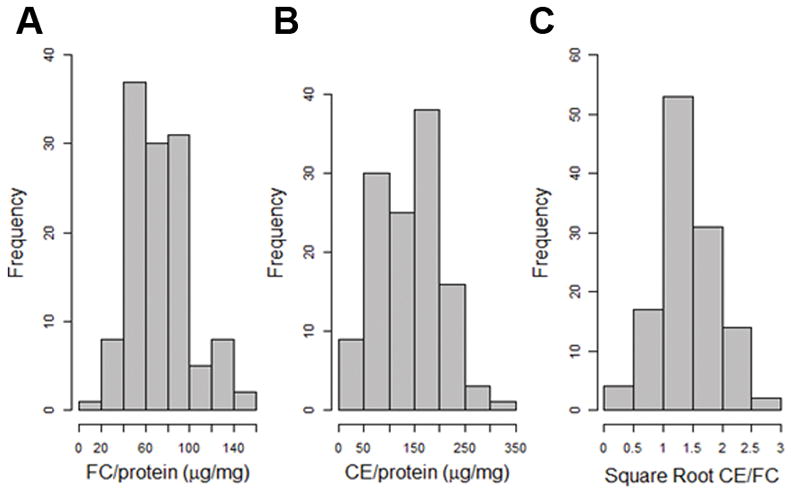
Frequency histograms of cholesterol phenotypes for BMDMs derived from 122 F4 mice after loading with 50μg/mL acLDL. A, FC normalized to cellular protein. B, CE normalized to cellular protein. C, CE/FC data was not normally distributed, so a square root transformation was performed to achieve a normal distribution.
Figure 2.

LOD plots for cholesterol phenotypes. A, FC; B, CE; and C, Square root transformed CE/FC. Dashed lines represent genome-wide significance thresholds (α = 0.05) determined by permutation analysis.
Ten distinct macrophage cholesterol metabolism QTLs were identified, and they were named Mcmm1–Mcmm10 (macrophage cholesterol metabolism modifier) scanning left to right across the genome in accordance with Mouse Genome Informatics nomenclature conventions (Table 1). The strongest QTL was Mcmm1 on chromosome 1, which had the highest logarithm of the odds (LOD) scores for FC levels (LOD=10.64, peak position=155.51 Mb, mouse genome build 37), CE levels (10.76, 156.34 Mb), and CE/FC ratio (12.46, 156.35 Mb). The Bayesian credible interval (probability > 0.99 for the causal gene to reside in this interval) for CE levels at Mcmm1 was determined to be 156.01–159.39 Mb, which was very similar to the Bayesian intervals for FC levels and CE/FC ratio. The Mcmm1 interval replicated perfectly in an independent mapping experiment, where GC-MS was utilized to quantitate cholesterol levels, with a LOD score of 25.4 for CE/FC ratio (Figure II in the online-only Data Supplement), however it should be noted that cholesterol loading was markedly lower than usual for that experiment due to the inadvertent use of a lower concentration of acLDL. Since Mcmm1 had the highest LOD scores for the measured BMDM cholesterol phenotypes, Mcmm2–Mcmm10 for CE levels were determined after correcting for Mcmm1 genotype as an additive covariate (Figure 3).
Table 1.
Macrophage cholesterol metabolism modifier QTLs
| QTL name | Trait | Chromosome | Interval in Mb (peak) | Max LOD score | p-value |
|---|---|---|---|---|---|
| Mcmm1 | FC | 1 | 155.35–159.40 (155.51) | 10.6 | < 0.0001 |
| Mcmm1 | CE | 1 | 156.01–159.39 (156.34) | 10.8 | < 0.0001 |
| Mcmm1 | CE/FC | 1 | 155.99–159.34 (156.35) | 12.5 | < 0.0001 |
| Mcmm2* | CE | 1 | 184.65–184.89 (184.65) | 5.6 | < 0.01 |
| Mcmm2* | CE/FC | 1 | 184.65–184.89 (184.65) | 6.1 | < 0.01 |
| Mcmm3* | CE | 2 | 76.28–180.10 (118.97) | 4.7 | < 0.05 |
| Mcmm3* | CE/FC | 2 | 74.98–180.10 (126.97) | 3.5 | < 0.20 |
| Mcmm4* | CE | 5 | 68.02–107.43 (105.44) | 5.7 | < 0.01 |
| Mcmm4* | CE/FC | 5 | 68.02–107.39 (105.44) | 4.6 | < 0.05 |
| Mcmm5* | CE | 6 | 118.95–122.59 (120.13) | 5.3 | < 0.01 |
| Mcmm5* | CE/FC | 6 | 5.50–149.04 (120.13) | 2.4 | > 0.63 |
| Mcmm6* | CE | 9 | 3.58–34.82 (31.70) | 5.3 | < 0.01 |
| Mcmm6* | CE/FC | 9 | 3.58–34.82 (31.19) | 3.6 | = 0.15 |
| Mcmm7* | CE | 10 | 6.41–129.61 (127.52) | 4.6 | < 0.05 |
| Mcmm7* | CE/FC | 10 | 3.21–129.61 (17.54) | 3.9 | < 0.10 |
| Mcmm8* | CE | 11 | 4.03–36.44 (7.27) | 6.0 | < 0.01 |
| Mcmm8* | CE/FC | 11 | 4.03–58.93 (4.03) | 3.8 | < 0.10 |
| Mcmm9* | CE | 12 | 79.09–95.60 (95.60) | 5.7 | < 0.01 |
| Mcmm9* | CE/FC | 12 | 45.53–103.96 (80.45) | 4.8 | < 0.05 |
| Mcmm10* | CE | 17 | 68.68–89.29 (88.56) | 5.3 | < 0.01 |
| Mcmm10* | CE/FC | 17 | 13.63–89.29 (77.30) | 3.8 | < 0.15 |
, Values determined after correcting for Mcmm1 as an additive covariate
Figure 3.

LOD plot for CE after correcting for the Mcmm1 peak marker as an additive covariate. The dashed line represents the genome-wide significance threshold (α = 0.05) determined by permutation analysis.
There was a strong gene dosage effect of Mcmm1 on FC, CE, and CE/FC ratio, with the DBA/2 allele at this locus associated with lower FC (Figure 4A), and higher CE and CE/FC ratio (Figure 4B,C). Linear regression R2 values from these plots indicate that Mcmm1 is associated with 30% of the variance in FC, 33% of the variance in CE, and 31% of the variance in CE/FC. Additional studies were performed to identify the Mcmm1 causal gene.
Figure 4.

Gene dose response plots for Mcmm1 cholesterol phenotypes. A, FC for three groups separated by genotype at Mcmm1 (R2 = 0.30, β = −23.4 μg FC/mg cellular protein). B, CE (R2 = 0.33, β = 62.9 μg CE/mg cellular protein). C, CE/FC (R2 = 0.31, β = 1.37). *, p<0.05; **, p<0.01; ***, p<0.001 by non-parametric Kruskal-Wallis ANOVA posttest. Circles represent individual F4 mice, lines represent the mean phenotype value for the specified genotype.
N-terminal truncation of ACAT1 protein alters macrophage cholesterol metabolism and is causal for the Mcmm1 QTL
Mcmm1 harbors 34 genes (Table I in the online-only Data Supplement), most notably Soat1, which maps to 158.36 Mb. Soat1 codes for the ACAT1 protein, an endoplasmic reticulum integral membrane protein that catalyzes esterification of FC to CE. AKR mice are known to harbor a 33 amino acid N-terminal truncation in ACAT1.10 The Wellcome Trust Sanger Institute database documents a 6818 bp deletion (chr1:158394619–158401436) in the Soat1 gene that extends from a site in the first intron to a site in the second intron, leading to the deletion of exon 2, which is responsible for a 118 bp mRNA deletion (Figure 5A, Figure III in the online-only Data Supplement).11 Our prior AKR x DBA/2 strain intercross demonstrated that Soat1 has a strong BMDM expression QTL controlled in cis (cis-eQTL) with a LOD score of 23.2, with the DBA/2 strain expressing more Soat1 mRNA than the AKR strain.12 We performed follow up studies on Soat1, the strongest Mcmm1 candidate gene.
Figure 5.

A, AKR Soat1 genomic deletion and ACAT1 N-terminal truncation. AKR mice have a 6.8kb genomic deletion that spans exon 2, leading to a 33 amino acid ACAT1 N-terminal truncation. Green boxes, exonic 5′-UTR; red boxes, exonic coding sequence. B, Pictorial representation of Soat1 CRISPR/Cas9 deletion strategy for DBA/2 ES cells. C, Genomic DNA PCR confirming the Soat1 deletion in AKR BMDMs, and showing the expected bands for DBA/DBA, DBA/Δ, and Δ/Δ ES cells.
We first confirmed the 118 bp deletion in AKR Soat1 mRNA. cDNA was prepared from AKR and DBA/2 BMDMs, and 3 overlapping PCR fragments were sequenced spanning the complete coding region of the C57BL/6 consensus Soat1 mRNA sequence. The 118 bp deletion in the AKR Soat1 cDNA was confirmed, which corresponds to exon 2 (chr1:158396812–158396929) and there were no other sequence changes in the coding region. Since exon 2 contains the translation initiation codon, the AKR ACAT1 protein translation starts at exon 3, yielding an N-terminal truncated protein missing the first 33 amino acid residues (Figure 5A).
To determine if the Soat1 deletion is responsible for the Mcmm1 QTL for macrophage FC, CE, and CE/FC ratio, we utilized CRISPR/Cas9 in the DBA/2 ES cell line AC173 to generate a gene deletion almost identical to the AKR Soat1 genomic deletion. Cas9 expressing stably transfected AC173 cells were generated (Figure IV in the online-only Data Supplement) and co-transfected with two guide RNAs to generate double strand DNA breaks flanking the deletion endpoints (Figure 5B). We screened 48 clonally derived cell lines using a PCR primer set specific for the deleted allele, and a primer set specific for the DBA/2 allele. After guide RNA transfection, a pooled culture detected both the DBA/2 and deleted alleles (Figure 5C). 33 clonal lines were homozygous for the DBA/2 allele (DBA/DBA), 14 clonal cell lines were heterozygous for the DBA/2 and deleted alleles (DBA/Δ), and 1 clonal line was homozygous for the deleted allele (Δ/Δ) (Figure 5C). We sequenced a genomic PCR product from the Δ/Δ cell line that demonstrated both alleles contained the same 6619 bp deletion spanning chr1:158394732- chr1:158401350 (Figure V in the online-only Data Supplement).
We differentiated the DBA/DBA, DBA/Δ, and Δ/Δ ES cell lines into macrophages, and ES derived macrophage (ESDM) differentiation was confirmed by uptake of DiI labeled-acLDL (Figure VI in the online-only Data Supplement). ESDMs became fully differentiated at about 13 days (Table II in the online-only Data Supplement). Soat1 cDNA-PCR analysis demonstrated the expected 432 bp DBA allele and 314 bp Δ allele bands in DBA/DBA, DBA/Δ, and Δ/Δ ESDM cells, confirming exon 2 deletion in the edited cell lines (Figure 6A). We determined that the levels of Soat1 mRNA were similar in the DBA/DBA and D/D ESDMs by qPCR (Figure VII in the online-only Data Supplement). We tested five commercially available ACAT1 antibodies on western blots of lysates from BMDM and ESDM, but none was specific enough to observe ACAT1 bands and show the protein truncation.
Figure 6.

A, cDNA-PCR from DBA/DBA, DBA/Δ, and Δ/Δ ESDMs using primers in exons 1 and 4 showing expected Soat1 mRNA bands. B–D, Comparison of cholesterol phenotypes between the three ESDM genotypes after loading with 50μg/mL acLDL. *, p<0.05; **, p<0.01; ***, p<0.001 by Newman-Keuls Multiple Comparison Test; n=3 ± S.D. Figure is representative of 3 independent experiments. E–G, ESDMs were loaded with 50μg/mL acLDL. More CE accumulation was observed per DBA/2 allele. Blue, DAPI-stained nuclei, red, Nile Red-stained neutral lipids, 40× magnification (white bar = 20μm).
DBA/DBA, DBA/Δ, and Δ/Δ ESDMs were loaded with 50 μg/mL acLDL. Three independent cholesterol mass assay experiments revealed that the engineered 6.6 kb Soat1 deletion significantly altered FC, CE, and CE/FC ratio. Highly significant differences were seen for FC and CE levels, where DBA/DBA ESDM accumulated significantly less FC and significantly more CE than Δ/Δ ESDM (Figure 6B,C). The DBA/DBA ESDMs had a CE/FC ratio of >2, while Δ/Δ ESDMs had a CE/FC ratio of ~ 1. The DBA/Δ ESDMs had an intermediate phenotype of ~ 1.5 (Figure 6D). The CE/FC differences for DBA/DBA vs. Δ/Δ ESDMs and DBA/Δ vs. Δ/Δ were highly significant (p < 0.001), as was DBA/DBA vs. DBA/Δ (p < 0.01). Fluorescent imaging of lipid droplets (CE) provided confirmatory evidence that the ACAT 1 N-terminal truncation decreased intracellular CE (Figure 6E–G). These data confirm that the AKR Soat1 deletion of exon 2 is causal in manifesting the strain divergent cholesterol phenotypes at the Mcmm1 QTL.
Candidate genes for Mcmm2 – Mcmm10
In order to prioritize candidate genes for Mcmm2–Mcmm10, we filtered the top candidates among all genes in these intervals (Table III in the online-only Data Supplement) for the presence of a BMDM cis-eQTL in our prior AKR x DBA/2 intercross, and/or at least one non-synonymous SNP determined to be “deleterious” by PROVEAN analysis (Table IV in the online-only Data Supplement). This left us with a group of 174 candidate genes over these 9 QTLs, some of which were associated with cholesterol, autophagy, lysosome, and atherosclerosis in PubMed queries. We cross-referenced the top 174 candidate genes for Mcmm2 – Mcmm10 plus the 34 genes in the Mcmm1 QTL to the human genome wide association catalog for atherosclerosis relevant traits such as cholesterol, lipoproteins, and coronary artery disease. We found genome wide association study matches for the human genes CACNA1E, CST3, DSTN, LRP4, MACROD2, SNX5, MEPE, APOBEC1, STAB2, UTP20, CAMK2B, EHBP1, NPC1L1, PELI1, and DYNC2LI1 (Table V in the online-only Data Supplement).
Mcmm3 is located on chromosome 2 and has a very large Bayesian credible interval of 76.28–180.09 Mb that harbors 2,223 genes. While this locus is quite large, it is very interesting because it may harbor distinct proximal (near 120 Mb) and distal (near 158 Mb) loci (Figure 3). It contains many plausible candidate genes, and it partially overlaps Ath28, an atherosclerosis modifier locus we discovered in prior AKR x DBA/2 intercrosses.12 Vps39 and Mertk are our top candidates for the proximal region. Lbp and Bpi are our top candidates for the distal region. The remaining Mcmm QTL candidate genes are discussed in the online-only Data Supplement.
Discussion
Ten macrophage cholesterol metabolism QTLs were discovered from our AKR x DBA/2 strain intercross. The Mcmm1 QTL on distal chromosome 1 had the highest LOD scores for FC, CE, and CE/FC ratio and it replicated in an independent experiment. Of the 34 genes in this interval, Soat1, encoding ACAT1, was our top causal candidate gene, which we confirmed as the causal gene by CRISPR/Cas9 gene editing in DBA/2 ES cells. As with any QTL, this does not rule out the possibility that other genes in Mcmm1 may also contribute to these phenotypes. ACAT1 is expressed in many tissues, including macrophages, whereas its isoenzyme, ACAT2 (coded for by the Soat2 gene), is expressed almost exclusively in intestinal epithelial cells and hepatocytes. Our prior transcriptomic study showed high expression of Soat1 and low expression of Soat2 in BMDMs from these strains.13 ACAT1 and ACAT2 share sequence homology near the C-terminus, however they differ significantly near the N-terminus in both mouse and human.14 AKR mice are known to harbor a 33 amino acid N-terminal truncation in ACAT1 due to a 6.8kb genomic deletion in Soat1. The ACAT1 protein truncation in AKR mice was first discovered by Farese and colleagues, but they demonstrated that the truncated ACAT1 protein did not have diminished esterification activity.10 Similarly, our prior study of BMDMs from AKR and DBA/2 mice did not demonstrate a difference in ACAT activity.8 However, based on our current findings, the ACAT activity assay may not be reflective of cellular cholesterol esterification. Two in-vivo phenotypes have been ascribed to the ACAT1 truncation in AKR mice; adrenocortical lipid depletion (ald), and hair interior defect (hid). The ald phenotype results in a loss of cholesterol esters in the adrenal cortex of post-pubescent AKR mice, which is much more pronounced in males than females.10 The hair interior defect results in the absence of ACAT1 expression in the premedulla, sebaceous glands, and hair interior of hair follicles.11
Inhibition of ACAT enzymes has long been recognized as an attractive therapeutic target for cardiovascular disease, and ACAT inhibitors have shown efficacy in reducing atherosclerosis in mouse models.15, 16 However, Soat1−/− mice did not show a reduction in atherosclerosis on either apoE−/− or Ldlr−/− backgrounds, and these mice had massive xanthomatosis.17 Furthermore, Ldlr−/− mice with macrophage specific deletion of Soat1 had an unanticipated increase in atherosclerosis.18 It is worth noting that AKR mice on the apoE−/− background do not have xanthomas, and thus the AKR Soat1 allele with its N-terminal ACAT1 protein truncation is not a phenocopy of the knockout allele. Theoretically, non-specific ACAT inhibitors could have dual athero-protective effects, where inhibition of ACAT1 would decrease foam cell formation, and inhibition of ACAT2 would decrease cholesterol uptake and LDL production. Unfortunately, ACAT inhibitor trials in humans have not shown efficacy in reducing plaque burden or attenuating adverse cardiac events in three independent phase 3 clinical trials, with macrophage FC toxicity posited as a primary reason for the disappointing results.19–21 In these trials the ACAT inhibitors acted on both ACAT1 and ACAT2. Additionally, in all three studies there was an unanticipated rise in LDL-C in treatment groups, and a positive correlation between LDL-C levels and treatment dosage. Therefore, potential anti-atherogenic effects of ACAT inhibitors may be partly offset by the rise in LDL-C levels. Still, these trials cast significant doubt on the prospects of targeting ACAT enzymes as a cardiovascular disease therapeutic.
In 2007, the first selective ACAT1 inhibitor (K-604) was developed, which showed over 200-fold affinity for ACAT1 vs. ACAT2, and decreased atherosclerosis in hamster models.22 K-604 was also shown to favorably alter atherosclerotic plaque phenotypes in apoE−/− mice.23 Additionally, this compound was shown to be effective in ameliorating symptoms of Alzheimer’s disease in mouse models, where K-604 treatment was shown to increase autophagic flux and transcription factor EB -mediated lysosome biogenesis in cultured microglia cells.24 This raises the interesting prospect that the rise in intracellular FC caused by the ACAT1 truncation in AKR macrophages may also result in the induction of autophagy and/or autophagosome-lysosome fusion, as cholesterol-enriched autophagosomes may have enhanced ability to fuse with lysosomes.25 Our results suggest that small molecules that interact with the N-terminus of ACAT1 may decrease CE accumulation and might be worth pursuing as a cardiovascular disease therapeutic.
Our lab has previously demonstrated that DBA/2 BMDM foam cells have diminished autophagic flux vs. AKR BMDM foam cells, which may contribute to the decreased CE turnover and increased CE storage in the DBA/2 strain.8 We specifically observed decreased autophagosome fusion with lysosomes in the DBA/2 cells.8 Based on these data, genes involved in autophagy and lysosome function were expected to appear in our QTL intervals. Vps39 (vacuolar protein sorting 39) maps very close to the Mcmm3 peak LOD marker on chromosome 2 and is one of our top candidate genes at this locus (Supplemental Table III in the online-only Data Supplement). Vps39 has a strong BMDM cis-eQTL with a LOD score of 12.9, and its expression is higher in AKR BMDMs than DBA/2. This protein is part of the homotypic fusion and protein-sorting complex that has been shown to mediate autophagosome-lysosome fusion in cultured cells, and siRNA knockdown of Vps39 blocked autophagic flux.26 Thus, its lower expression in DBA/2 BMDM coincides with decreased autophagic flux.
Prior studies in our laboratory revealed atherosclerosis modifier loci on chromosomes 2 (Ath28), 15 (Ath22), and 17 (Ath26) for an AKR x DBA/2 strain intercross.12 Given the centrality of foam cells to atherosclerosis pathology, we anticipated that the Mcmm QTLs might overlap our Ath QTLs and aid in prioritizing Ath candidate genes. Mcmm3 on chromosome 2 (76.28–180.09 Mb) partially overlaps Ath28 (165.1–179.3 Mb), and thus determination of the causal gene for Mcmm3 could suggest the causal gene for Ath28. A recent study identified a chromosome 2 atherosclerosis QTL (Aath4, 123–148 Mb) in a 129S6 x DBA/2 backcross that contains the Mertk gene, which is another of our top candidates for the Mcmm3 QTL (Supplemental Table III in the online-only Data Supplement). The study demonstrated that reduced Mertk expression in DBA/2 macrophages led to decreased efferocytosis, which is a plausible mechanism that could contribute to increased atherosclerosis in DBA/2 mice.27 Prior studies in apoE−/− and Ldlr−/− mice have demonstrated that Mertk loss of function mutations increased lesion necrotic core area with increased apoptotic cells, and led to larger lesions in the Ldlr−/− background.28 Mertk had a strong BMDM cis-eQTL in our AKR x DBA/2 intercross.12 However, the Ath28 QTL does not contain the Mertk gene, so if this proves to be a causal modifier gene for Mcmm3, it would not explain the Ath28 QTL. Two Mcmm3 top candidates genes are found within the Ath28 interval, Zfp663 and Cstf1 (Supplemental Table III in the online-only Data Supplement).
At the more distal end of chromosome 2, Lbp (lipopolysaccharide binding protein) is an interesting Mcmm3 candidate. Lbp had a BMDM cis-eQTL in our prior study, with higher expression in DBA/2 vs. AKR BMDMs. Additionally, Lbp harbors 3 non-synonymous SNPs between the strains, one of which (Y284H) is predicted to be deleterious by PROVEAN software. Distal chromosome 2 displayed a robust QTL (Ath45, 157–165 Mb) for aortic root lesion size in an F2 cross of DBA/2 x 129S6 apoE−/− mice29, partially overlapping the Ath28 QTL. The investigators cite Lbp as a top candidate for Ath45, noting that the Y285H SNP (which occurs in the 129S6 strain) is located in a conserved lipid binding site, whose alteration may affect protein function. Lbp was recently shown to increase macrophage LXR activity and promote macrophage survival and atherosclerosis in Ldlr−/− mice30 Another interesting aspect of the LBP protein is that is shares structural similarity to cholesterol ester transfer protein (CETP) and phospholipid transfer protein (PLTP), raising the distinct possibility that LBP may bind more lipid species than just LPS, e.g. phospholipids.31 Additionally, LBP was recently identified as a novel, plaque derived biomarker of atheroma released rapidly after plaque disruption.32 The gene encoding bactericidal permeability increasing protein (Bpi) maps just distal to Lbp, and also shares structural similarity with CETP, PLTP, and LBP. Bpi has 4 non-synonymous SNPs between AKR and DBA/2, one of which was predicted to be deleterious by PROVEAN. It is of interest that a top candidate for Mcmm2 QTL is the Tlr5 gene, which along with Lpb and Bpi is another gene related to pathogen-associated molecular pattern (PAMP) function, suggesting that there may be an interaction between PAMP signaling and cholesterol metabolism that remains to be elucidated.
Our study demonstrated that the 33 amino acid N-terminal ACAT1 truncation in AKR mice plays a significant causal role in macrophage cholesterol metabolism. How this truncation affects cholesterol metabolism remains unknown, but altered protein-protein and/or protein-lipid interactions is a plausible mechanism. Since we did not detect an effect of the ACAT1 truncation on Soat1 mRNA levels in our engineered ESDMs, additional genetic differences between the AKR and DBA/2 Soat1 locus must be responsible for the Soat1 eQTL that we previously reported.13 Bioinformatic analysis of other Mcmm loci suggest that Vps39, Lbp, and other candidate genes are worthy of follow up study to interrogate their potential role in macrophage cholesterol metabolism.
Supplementary Material
Highlights.
Ten distinct macrophage cholesterol metabolism modifier (Mcmm) loci were identified in our AKR x DBA/2 F4 intercross association mapping study.
A Soat1 exon 2 deletion, and the resultant ACAT1 N-terminal truncation, was unequivocally verified as a significant modulator of macrophage cholesterol metabolism via QTL mapping and CRISPR/Cas9 gene editing.
Bioinformatic analyses of the Mcmm loci prioritized candidate genes and highlighted several genes worthy of follow up study such as Vps39 and Lbp.
Acknowledgments
We thank Joshua N. Phelps for technical assistance with the embryonic stem cell-derived macrophages.
Sources of Funding: This study was supported by NIH grant P01HL029582. Q.H. was supported by the China Scholarship Council.
Nonstandard Abbreviations
- ACAT
acyl-coenzyme A:cholesterol acyltransferase
- AcLDL
acetylated low density lipoprotein
- BMDM
bone marrow-derived macrophage
- CE
cholesterol ester
- eQTL
expression quantitative trait locus
- ES
embryonic stem
- ESDM
embryonic stem cell-derived macrophage
- FC
free cholesterol
- LOD
logarithm of the odds
- MCMM
macrophage cholesterol metabolism modifier
- QTL
quantitative trait locus
- SOAT
sterol O-acyltransferase
Footnotes
Disclosures: None.
Reference List
- 1.Moore KJ, Tabas I. Macrophages in the pathogenesis of atherosclerosis. Cell. 2011;145:341–55. doi: 10.1016/j.cell.2011.04.005. [DOI] [PMC free article] [PubMed] [Google Scholar]
- 2.Libby P, Ridker PM, Hansson GK. Progress and challenges in translating the biology of atherosclerosis. Nature. 2011;473:317–25. doi: 10.1038/nature10146. [DOI] [PubMed] [Google Scholar]
- 3.Cuchel M, Rader DJ. Macrophage reverse cholesterol transport: key to the regression of atherosclerosis? Circulation. 2006;113:2548–55. doi: 10.1161/CIRCULATIONAHA.104.475715. [DOI] [PubMed] [Google Scholar]
- 4.Sakai K, Igarashi M, Yamamuro D, Ohshiro T, Nagashima S, Takahashi M, Enkhtuvshin B, Sekiya M, Okazaki H, Osuga J, Ishibashi S. Critical role of neutral cholesteryl ester hydrolase 1 in cholesteryl ester hydrolysis in murine macrophages. J Lipid Res. 2014;55:2033–40. doi: 10.1194/jlr.M047787. [DOI] [PMC free article] [PubMed] [Google Scholar]
- 5.Brown MS, Ho YK, Goldstein JL. The cholesteryl ester cycle in macrophage foam cells. Continual hydrolysis and re-esterification of cytoplasmic cholesteryl esters. J Biol Chem. 1980;255:9344–52. [PubMed] [Google Scholar]
- 6.Miyazaki A, Sakashita N, Lee O, Takahashi K, Horiuchi S, Hakamata H, Morganelli PM, Chang CC, Chang TY. Expression of ACAT-1 protein in human atherosclerotic lesions and cultured human monocytes-macrophages. Arterioscler Thromb Vasc Biol. 1998;18:1568–74. doi: 10.1161/01.atv.18.10.1568. [DOI] [PubMed] [Google Scholar]
- 7.Ouimet M, Franklin V, Mak E, Liao X, Tabas I, Marcel YL. Autophagy regulates cholesterol efflux from macrophage foam cells via lysosomal acid lipase. Cell Metab. 2011;13:655–67. doi: 10.1016/j.cmet.2011.03.023. [DOI] [PMC free article] [PubMed] [Google Scholar]
- 8.Robinet P, Ritchey B, Smith JD. Physiological difference in autophagic flux in macrophages from 2 mouse strains regulates cholesterol ester metabolism. Arterioscler Thromb Vasc Biol. 2013;33:903–10. doi: 10.1161/ATVBAHA.112.301041. [DOI] [PMC free article] [PubMed] [Google Scholar]
- 9.Smith JD, Bhasin JM, Baglione J, Settle M, Xu Y, Barnard J. Atherosclerosis susceptibility loci identified from a strain intercross of apolipoprotein E-deficient mice via a high-density genome scan. Arterioscler Thromb Vasc Biol. 2006;26:597–603. doi: 10.1161/01.ATV.0000201044.33220.5c. [DOI] [PubMed] [Google Scholar]
- 10.Meiner VL, Welch CL, Cases S, Myers HM, Sande E, Lusis AJ, Farese RV., Jr Adrenocortical lipid depletion gene (ald) in AKR mice is associated with an acyl-CoA:cholesterol acyltransferase (ACAT) mutation. J Biol Chem. 1998;273:1064–9. doi: 10.1074/jbc.273.2.1064. [DOI] [PubMed] [Google Scholar]
- 11.Wu B, Potter CS, Silva KA, Liang Y, Reinholdt LG, Alley LM, Rowe LB, Roopenian DC, Awgulewitsch A, Sundberg JP. Mutations in sterol O-acyltransferase 1 (Soat1) result in hair interior defects in AKR/J mice. J Invest Dermatol. 2010;130:2666–8. doi: 10.1038/jid.2010.168. [DOI] [PMC free article] [PubMed] [Google Scholar]
- 12.Hsu J, Smith JD. Genetic-genomic replication to identify candidate mouse atherosclerosis modifier genes. J Am Heart Assoc. 2013;2:e005421. doi: 10.1161/JAHA.112.005421. [DOI] [PMC free article] [PubMed] [Google Scholar]
- 13.Berisha SZ, Hsu J, Robinet P, Smith JD. Transcriptome analysis of genes regulated by cholesterol loading in two strains of mouse macrophages associates lysosome pathway and ER stress response with atherosclerosis susceptibility. PLoS One. 2013;8:e65003. doi: 10.1371/journal.pone.0065003. [DOI] [PMC free article] [PubMed] [Google Scholar]
- 14.Chang TY, Li BL, Chang CC, Urano Y. Acyl-coenzyme A:cholesterol acyltransferases. Am J Physiol Endocrinol Metab. 2009;297:E1–E9. doi: 10.1152/ajpendo.90926.2008. [DOI] [PMC free article] [PubMed] [Google Scholar]
- 15.Kusunoki J, Hansoty DK, Aragane K, Fallon JT, Badimon JJ, Fisher EA. Acyl-CoA:cholesterol acyltransferase inhibition reduces atherosclerosis in apolipoprotein E-deficient mice. Circulation. 2001;103:2604–9. doi: 10.1161/01.cir.103.21.2604. [DOI] [PubMed] [Google Scholar]
- 16.Rong JX, Blachford C, Feig JE, et al. ACAT inhibition reduces the progression of preexisting, advanced atherosclerotic mouse lesions without plaque or systemic toxicity. Arterioscler Thromb Vasc Biol. 2013;33:4–12. doi: 10.1161/ATVBAHA.112.252056. [DOI] [PMC free article] [PubMed] [Google Scholar]
- 17.Accad M, Smith SJ, Newland DL, Sanan DA, King LE, Jr, Linton MF, Fazio S, Farese RV., Jr Massive xanthomatosis and altered composition of atherosclerotic lesions in hyperlipidemic mice lacking acyl CoA:cholesterol acyltransferase 1. J Clin Invest. 2000;105:711–9. doi: 10.1172/JCI9021. [DOI] [PMC free article] [PubMed] [Google Scholar]
- 18.Fazio S, Major AS, Swift LL, Gleaves LA, Accad M, Linton MF, Farese RV., Jr Increased atherosclerosis in LDL receptor-null mice lacking ACAT1 in macrophages. J Clin Invest. 2001;107:163–71. doi: 10.1172/JCI10310. [DOI] [PMC free article] [PubMed] [Google Scholar]
- 19.Tardif JC, Gregoire J, L’Allier PL, et al. Effects of the acyl coenzyme A:cholesterol acyltransferase inhibitor avasimibe on human atherosclerotic lesions. Circulation. 2004;110:3372–7. doi: 10.1161/01.CIR.0000147777.12010.EF. [DOI] [PubMed] [Google Scholar]
- 20.Nissen SE, Tuzcu EM, Brewer HB, Sipahi I, Nicholls SJ, Ganz P, Schoenhagen P, Waters DD, Pepine CJ, Crowe TD, Davidson MH, Deanfield JE, Wisniewski LM, Hanyok JJ, Kassalow LM. Effect of ACAT inhibition on the progression of coronary atherosclerosis. N Engl J Med. 2006;354:1253–63. doi: 10.1056/NEJMoa054699. [DOI] [PubMed] [Google Scholar]
- 21.Meuwese MC, de GE, Duivenvoorden R, Trip MD, Ose L, Maritz FJ, Basart DC, Kastelein JJ, Habib R, Davidson MH, Zwinderman AH, Schwocho LR, Stein EA. ACAT inhibition and progression of carotid atherosclerosis in patients with familial hypercholesterolemia: the CAPTIVATE randomized trial. JAMA. 2009;301:1131–9. doi: 10.1001/jama.301.11.1131. [DOI] [PubMed] [Google Scholar]
- 22.Ikenoya M, Yoshinaka Y, Kobayashi H, Kawamine K, Shibuya K, Sato F, Sawanobori K, Watanabe T, Miyazaki A. A selective ACAT-1 inhibitor, K-604, suppresses fatty streak lesions in fat-fed hamsters without affecting plasma cholesterol levels. Atherosclerosis. 2007;191:290–7. doi: 10.1016/j.atherosclerosis.2006.05.048. [DOI] [PubMed] [Google Scholar]
- 23.Yoshinaka Y, Shibata H, Kobayashi H, Kuriyama H, Shibuya K, Tanabe S, Watanabe T, Miyazaki A. A selective ACAT-1 inhibitor, K-604, stimulates collagen production in cultured smooth muscle cells and alters plaque phenotype in apolipoprotein E-knockout mice. Atherosclerosis. 2010;213:85–91. doi: 10.1016/j.atherosclerosis.2010.08.048. [DOI] [PubMed] [Google Scholar]
- 24.Shibuya Y, Niu Z, Bryleva EY, Harris BT, Murphy SR, Kheirollah A, Bowen ZD, Chang CC, Chang TY. Acyl-coenzyme A:cholesterol acyltransferase 1 blockage enhances autophagy in the neurons of triple transgenic Alzheimer’s disease mouse and reduces human P301L-tau content at the presymptomatic stage. Neurobiol Aging. 2015;36:2248–59. doi: 10.1016/j.neurobiolaging.2015.04.002. [DOI] [PMC free article] [PubMed] [Google Scholar]
- 25.Shibuya Y, Chang CC, Chang TY. ACAT1/SOAT1 as a therapeutic target for Alzheimer’s disease. Future Med Chem. 2015;7:2451–67. doi: 10.4155/fmc.15.161. [DOI] [PMC free article] [PubMed] [Google Scholar]
- 26.Jiang P, Nishimura T, Sakamaki Y, Itakura E, Hatta T, Natsume T, Mizushima N. The HOPS complex mediates autophagosome-lysosome fusion through interaction with syntaxin 17. Mol Biol Cell. 2014;25:1327–37. doi: 10.1091/mbc.E13-08-0447. [DOI] [PMC free article] [PubMed] [Google Scholar]
- 27.Kayashima Y, Makhanova N, Maeda N. DBA/2J Haplotype on Distal Chromosome 2 Reduces Mertk Expression, Restricts Efferocytosis, and Increases Susceptibility to Atherosclerosis. Arterioscler Thromb Vasc Biol. 2017;37:e82–e91. doi: 10.1161/ATVBAHA.117.309522. [DOI] [PMC free article] [PubMed] [Google Scholar]
- 28.Kayashima Y, Makhanova NA, Matsuki K, Tomita H, Bennett BJ, Maeda N. Identification of aortic arch-specific quantitative trait loci for atherosclerosis by an intercross of DBA/2J and 129S6 apolipoprotein E-deficient mice. PLoS One. 2015;10:e0117478. doi: 10.1371/journal.pone.0117478. [DOI] [PMC free article] [PubMed] [Google Scholar]
- 29.Kayashima Y, Tomita H, Zhilicheva S, Kim S, Kim HS, Bennett BJ, Maeda N. Quantitative trait loci affecting atherosclerosis at the aortic root identified in an intercross between DBA2J and 129S6 apolipoprotein E-null mice. PLoS One. 2014;9:e88274. doi: 10.1371/journal.pone.0088274. [DOI] [PMC free article] [PubMed] [Google Scholar]
- 30.Sallam T, Ito A, Rong X, Kim J, van SC, Chamberlain BT, Jung ME, Chao LC, Jones M, Gilliland T, Wu X, Su GL, Tangirala RK, Tontonoz P, Hong C. The macrophage LBP gene is an LXR target that promotes macrophage survival and atherosclerosis. J Lipid Res. 2014;55:1120–30. doi: 10.1194/jlr.M047548. [DOI] [PMC free article] [PubMed] [Google Scholar]
- 31.Alva V, Lupas AN. The TULIP superfamily of eukaryotic lipid-binding proteins as a mediator of lipid sensing and transport. Biochim Biophys Acta. 2016;1861:913–23. doi: 10.1016/j.bbalip.2016.01.016. [DOI] [PubMed] [Google Scholar]
- 32.Lee R, Fischer R, Charles PD, Adlam D, Valli A, Di GK, Kharbanda RK, Choudhury RP, Antoniades C, Kessler BM, Channon KM. A novel workflow combining plaque imaging, plaque and plasma proteomics identifies biomarkers of human coronary atherosclerotic plaque disruption. Clin Proteomics. 2017;14:22. doi: 10.1186/s12014-017-9157-x. [DOI] [PMC free article] [PubMed] [Google Scholar]
Associated Data
This section collects any data citations, data availability statements, or supplementary materials included in this article.