

Summary
MYC proteins bind globally to active promoters and promote transcriptional elongation by RNA polymerase II (Pol II). To identify effector proteins that mediate this function, we performed mass spectrometry on N-MYC complexes in neuroblastoma cells. The analysis shows that N-MYC forms complexes with TFIIIC, TOP2A, and RAD21, a subunit of cohesin. N-MYC and TFIIIC bind to overlapping sites in thousands of Pol II promoters and intergenic regions. TFIIIC promotes association of RAD21 with N-MYC target sites and is required for N-MYC-dependent promoter escape and pause release of Pol II. Aurora-A competes with binding of TFIIIC and RAD21 to N-MYC in vitro and antagonizes association of TOP2A, TFIIIC, and RAD21 with N-MYC during S phase, blocking N-MYC-dependent release of Pol II from the promoter. Inhibition of Aurora-A in S phase restores RAD21 and TFIIIC binding to chromatin and partially restores N-MYC-dependent transcriptional elongation. We propose that complex formation with Aurora-A controls N-MYC function during the cell cycle.
Keywords: N-MYC, MYC, Aurora-A, TFIIIC, RAD21, pause release, neuroblastoma
Graphical Abstract
Highlights
-
•
N-MYC forms complexes with TFIIIC, RAD21, and TOP2A
-
•
TFIIIC recruits RAD21 and is required for N-MYC-dependent pause release of Pol II
-
•
Aurora-A displaces TFIIIC, TOP2A, and RAD21 from N-MYC during S phase
-
•
Aurora-A inhibits pause release of Pol II during S phase
Büchel et al. demonstrate that N-MYC forms complexes with TFIIIC, TOP2A, and RAD21. Aurora-A competes with TFIIIC and RAD21 for binding to N-MYC, and Aurora-A displaces the three proteins from N-MYC during S phase. As consequence, N-MYC-dependent pause release is inhibited during S phase, preventing activation of the ATR checkpoint kinase.
Introduction
The MYC family of transcription factors (MYC, N-MYC, and L-MYC) has been causally implicated in the development of multiple human tumors (Dang, 2012). MYC proteins bind to virtually all promoters with an open chromatin structure as well as to thousands of enhancers (Walz et al., 2014, Sabò et al., 2014, Lin et al., 2012, Nie et al., 2012). They stimulate transcription of large groups of genes encoding, among others, proteins involved in protein translation, cell cycle progression, and intermediary metabolism and repress transcription of genes encoding cell cycle inhibitory proteins as well as proteins involved in cell adhesion and differentiation (Dang, 2012). In some settings, MYC proteins act as “general amplifiers” that enhance transcription of all actively transcribed protein-coding genes (Nie et al., 2012, Lin et al., 2012).
During early transcription, RNA polymerase II (Pol II) goes through a series of intermediate states that begin with the formation of a closed promoter complex and end with the release of Pol II from a promoter-proximal pause position into productive elongation (Michel and Cramer, 2013). To enhance transcription, MYC proteins promote both recruitment of Pol II to the promoter and its subsequent release into elongation (Rahl et al., 2010, Jaenicke et al., 2016, Walz et al., 2014). Escape from the promoter and pause release of Pol II are controlled by sequential phosphorylation of Ser5 and Ser2 in the C-terminal domain of Pol II and activation of MYC promotes phosphorylation at both sites (Jonkers and Lis, 2015, Rahl et al., 2010, Walz et al., 2014, Cowling and Cole, 2007). Known protein-protein interactions of MYC include the association with MAX, which is required for binding to DNA (Blackwell et al., 1993), the NuA4 histone acetylase complex (McMahon et al., 1998), the p400 and BPTF chromatin-remodeling complexes (Richart et al., 2016, Fuchs et al., 2001), and the PAF1C elongation complex (Jaenicke et al., 2016). How MYC engages its different cofactors to promote elongation and how this process is regulated is largely unknown.
Deregulated expression of N-MYC is characteristic for subentities of pediatric neuroblastoma and medulloblastoma as well as for adult neuroendocrine and some hematopoietic malignancies (Beltran, 2014). Like all MYC proteins, N-MYC is rapidly turned over via the ubiquitin/proteasome system (Sjostrom et al., 2005). The SCFFBXW7 ubiquitin ligase recognizes a phosphodegron that is part of a conserved domain called MYCBoxI (Welcker et al., 2004). Replacing two phosphoresidues, T58 and S62, with alanine stabilizes N-MYC (Otto et al., 2009). S62 is phosphorylated by cyclin-dependent kinases and primes phosphorylation of T58 by GSK3, resulting in cell cycle- and growth factor-dependent proteasomal turnover of N-MYC (Chesler et al., 2006, Sjostrom et al., 2005).
In multiple tumor entities, N-MYC is stabilized by complex formation with Aurora-A (Otto et al., 2009, Dardenne et al., 2016). Aurora-A is a serine/threonine kinase that is best known for its role in centrosome function and mitosis (Marumoto et al., 2005). Aurora-A binds to N-MYC directly via two domains that flank the SCFFBXW7 phosphodegron and antagonizes degradation of N-MYC by SCFFBXW7 (Otto et al., 2009, Richards et al., 2016). Although stabilization of N-MYC does not require Aurora-A catalytic activity, Aurora-A inhibitors that distort the kinase domain dissociate the N-MYC/Aurora-A complex and destabilize N-MYC (Richards et al., 2016). These inhibitors show therapeutic efficacy in N-MYC-driven tumor models and are being tested in human patients (DuBois et al., 2016). We have now analyzed protein complexes of N-MYC to understand how N-MYC controls Pol II function and how association with Aurora-A impacts N-MYC function.
Results
Complexes of N-MYC with TFIIIC, TOP2A, and RAD21
To identify protein complexes of N-MYC in neuroblastoma cells, we used SH-EP cells, which do not express endogenous N-MYC. Using retroviral infection, we stably expressed HA-tagged wild-type (WT) N-MYC (N-MYCwt) or N-MYCT58AS62A (N-MYCmut) (Figure 1A). Immunoblots showed that levels of N-MYC in infected cells were comparable with those found in a MYCN-amplified neuroblastoma cell line, IMR-32 (Figure 1A). We then performed mass spectrometry of complexes recovered after immunoprecipitation with α-hemagglutinin (α-HA) antibodies and elution with a HA peptide using label-free quantification (Figure 1B; Table S1). The analysis confirmed multiple well-validated interactions of N-MYC or MYC proteins, including interactions with TRRAP, p400, BPTF, MAX, Aurora-A, and CDC73 (Figure S1A). In addition, the analysis identified interactions with 5 of 6 subunits of the TFIIIC complex and topoisomerases IIA and IIB (TOP2A and TOP2B). TFIIIC is both a general transcription factor of RNA polymerase III and an architectural protein that is localized at the border of topological domains (Crepaldi et al., 2013, Van Bortle et al., 2014). TOP2A has been implicated in relieving transcription-induced supercoiling at highly active promoters (Kouzine et al., 2013). We speculated, therefore, that these interactions may identify effector functions of N-MYC.
Figure 1.

Complexes of N-MYC with TFIIIC, TOP2A, RAD21, and Aurora-A
(A) Immunoblot documenting levels of ectopically expressed (exo) N-MYCwt and N-MYCmut proteins in stably infected SH-EP neuroblastoma cells relative to endogenous N-MYC (endo) of IMR-32 MYCN-amplified neuroblastoma cells. Where indicated, ectopically expressed proteins carry an N-terminal HA tag (NT HA); hence, their molecular weight is slightly larger than that of the endogenous protein (n = 2).
(B) Results of mass spectrometry of α-HA immunoprecipitates of N-MYCwt and N-MYCmut complexes. The axes show the normalized ratio of peptides recovered in an α-HA immunoprecipitation from cells expressing N-MYCwt or N-MYCmut relative to an α-HA immunoprecipitation (IP) from control cells. Dot size represents the MaxQuant protein scores, which indicates the reliability of protein identification (Cox and Mann, 2008).
(C) Immunoblots of α-N-MYC (left) and α-TFIIIC5 (right) immunoprecipitates from IMR-32 cells. The input corresponds to 1% of the amount used for the precipitation. Where indicated, ethidium bromide (EtBr) was added to a final concentration of 1 μg ml−1 to disrupt DNA-dependent interactions. Non-specific immunoglobulin G (IgG) was used for control immunoprecipitations (n = 3).
(D) Pull-down assays from cell lysates documenting binding of TFIIIC5 and RAD21 to FLAG-tagged peptides spanning the indicated amino acids of the N-MYC N terminus. The input corresponds to 0.6% of the amount used for the precipitation (n = 2). The graph at the bottom visualizes the binding of the different N-MYC peptides. I/II indicate N-MYC sequences that mediate binding.
(E) Immunoblots of α-N-MYC (left) and α-Aurora-A (right) immunoprecipitates from MYCN-amplified IMR-5 cells. The input corresponds to 1% of the amount used for the precipitation. Non-specific IgG was used for control immunoprecipitates (n = 4).
(F) Pull-down assays from cell lysates documenting binding of TFIIIC5 and RAD21 to FLAG-tagged N-MYC peptides spanning amino acids 1–137 upon competition with Aurora-A. Recombinant Aurora-A protein was added in a concentration-dependent manner from 0.25 to 5 molar equivalents (Aurora-A/N-MYC peptide). 5 molar equivalents of glutathione-S-transferase (GST) were used as a control (n = 3).
See also Figure S1 and Table S1. n indicates the number of independent biological replicas for each experiment.
Immunoprecipitations using α-HA antibodies confirmed that TFIIIC and TOP2A were present in immunoprecipitates from cells expressing N-MYC but not in control immunoprecipitates from cells not expressing HA-tagged N-MYC (Figure S1B). Parallel mass spectrometry demonstrated the presence of 5 of 6 subunits of TFIIIC and TOP2A in α-N-MYC immunoprecipitates but not in control immunoprecipitates from MYCN-amplified neuroblastoma cells (Figure S1C). Multiple subunits of TFIIIC and TOP2A were also detected in α-HA precipitates from U2OS cells expressing HA-tagged MYC but not control immunoprecipitates, arguing that MYC, like N-MYC, associates with these proteins (Figure S1D); this is consistent with a previous mass spectrometric analysis (Koch et al., 2007). Using an antibody that recognizes TFIIIC5, we confirmed that TFIIIC associates with endogenous N-MYC and, albeit more weakly, with TOP2A as well as TOP2B in MYCN-amplified neuroblastoma cells (Figure 1C; Figure S1E). Notably, interactions of N-MYC with TFIIIC5 and TOP2A were also observed in the presence of ethidium bromide (EtBr), which disrupts DNA-dependent interactions (Figure 1C). This observation precludes the possibility that the interactions are indirectly mediated by DNA.
To identify domains of N-MYC that interact with TFIIIC and TOP2A, we performed pull-down assays from cell lysates incubated with recombinant FLAG-tagged peptides covering fragments of the N-MYC N terminus (Figure 1D). These assays showed that residues 1–137 are sufficient for binding to TFIIIC and suggested that two regions of N-MYC that flank MYCBoxI, but not MYCBoxI itself (peptides 46–89), mediate binding to TFIIIC. Controls established that an equimolar amount of an unrelated FLAG-tagged protein (heterogeneous nuclear ribonucleoprotein [hnRNP], amino acids 330–463) does not bind TFIIIC5 (E.L., unpublished data). In parallel assays, we were unable to demonstrate that residues 1–137 of N-MYC are sufficient for binding to TOP2A (E.L., unpublished data). Previous work has demonstrated that TFIIIC co-localizes and associates with cohesin and condensin complexes in different organisms (Van Bortle et al., 2014, D’Ambrosio et al., 2008), prompting us to search for the presence of these complexes in N-MYC immunoprecipitates. Indeed, peptides of the kleisin component of the cohesin complex, RAD21, were found in the mass spectrometry analysis (Table S1), and we confirmed that both N-MYC expressed in SH-EP cells and endogenous N-MYC in MYCN-amplified IMR-5 cells associates with RAD21 (Figure 1E; Figure S1B). Mapping of the interaction to the N-MYC N terminus showed the same binding pattern as TFIIIC, suggesting that they co-exist with N-MYC in the same complex (Figure 1D).
Like TFIIIC and RAD21, Aurora-A interacts with N-MYC via two domains flanking MYCBoxI (Richards et al., 2016), raising the possibility that Aurora-A competes with TFIIIC or RAD21 for binding to N-MYC. Indeed, Aurora-A competed with both TFIIIC and RAD21 for binding to the N-MYC N terminus (1–137) in pull-down assays using FLAG-tagged peptides, whereas an equimolar amount of an unrelated protein, glutathione-S-transferase, did not compete (Figure 1F). Immunoprecipitations from MYCN-amplified neuroblastoma cells showed that TFIIIC, RAD21, and Aurora-A were present in α-N-MYC immunoprecipitates (Figure 1E). In parallel assays, both N-MYC and, weakly, TFIIIC, but not RAD21, were detectable in α-Aurora-A immunoprecipitates (Figure 1E). We concluded that Aurora-A and RAD21 form alternate complexes with N-MYC in cells, whereas Aurora-A can remain associated with N-MYC and TFIIIC via interactions that are outside of residues N-MYC 1–137 in vivo. To identify these domains in N-MYC, we used overlapping peptide libraries in microarray format of N-MYC and probed them with recombinant Aurora-A. Consistent with these and previously published data (Richards et al., 2016), peptides spanning amino acids 17–43 of N-MYC (9–43 in MYC) had the highest affinity for Aurora-A. The arrays also revealed an additional binding site with lower binding affinity for Aurora-A in the C terminus of N-MYC, which spans amino acids 313–339 (overlapping MYCBoxIV) and is conserved in MYC (amino acids 306–331) (Figure S1F).
The interaction of Aurora-A with N-MYC is impaired by mutations of T58 and S62 in N-MYC to alanine (Otto et al., 2009), and immunoprecipitations from infected SH-EP cells confirmed this observation (Figure S1B). Comparison of precipitates recovered from cells expressing N-MYCwt with those from cells expressing N-MYCmut suggested that phosphorylation of MYCBoxI may affect the interaction with TFIIIC (Figure 1B), but immunoprecipitations from SH-EP cells did not reveal significant differences in the interactions of N-MYCwt and N-MYCmut with RAD21, TFIIIC5, and TOP2A (Figure S1B).
Joint N-MYC/TFIIIC Chromatin Binding Sites
TFIIIC binds to promoters transcribed by RNA polymerase III and is an architectural protein complex that binds to thousands of ETC (extra TFIIIC) sites throughout the genome that are independent of RNA polymerase III (Moqtaderi et al., 2010, Oler et al., 2010). To understand whether N-MYC and TFIIIC bind to overlapping sites on chromatin, we performed chromatin immunoprecipitation (ChIP) coupled with high-throughput sequencing (ChIP sequencing) using antibodies directed against N-MYC and TFIIIC5. Inspection of individual genes revealed the presence of both proteins in close vicinity to each other at multiple transcription start sites (Figure 2A; Figure S2A). Global analyses identified a total of 2,053 sites with overlapping peaks, and statistical analyses showed that this overlap is highly significant (Figure 2B) (p < 10−6, calculated using a permutation test with 1.0 × 10⁶ iterations). The median distance between peak summits at all joint sites was 39 bp (Figure S2B). Of these sites, 151 were found at tRNA genes; this is expected because MYC proteins bind to tRNA genes (Gomez-Roman et al., 2003). In addition, overlapping N-MYC/TFIIIC binding sites were found at 1,165 promoters transcribed by Pol II and at 737 intra- and intergenic sites. At core promoters transcribed by Pol II, N-MYC binding peaked at transcription start sites, and TFIIIC binding peaked with a slightly larger median distance of 80 bp 5′ of N-MYC binding sites, suggesting that joint sites may have a defined orientation (Figure S2C).
Figure 2.

Chromatin Binding of N-MYC/TFIIIC Complexes
(A) Genome browser tracks at the NME1 locus illustrating chromatin association of the indicated proteins. The positions of B- and E-boxes and of CTCF motifs are indicated by vertical lines. The upper input is for ChIP sequencing of N-MYC and TFIIIC5; the lower input is for RAD21 and CTCF.
(B) Top: Venn diagram documenting genome-wide overlap of N-MYC and TFIIIC5 binding sites in IMR-5 neuroblastoma cells. The p value was calculated using a permutation test. Bottom: diagram showing the location of N-MYC/TFIIIC5 sites in the genome.
(C) De novo motif search in N-MYC- and/or TFIIIC5-bound regions. In overlapping sites, both peak regions were analyzed. The numbers indicate the percentage of sites in which the indicated motif was found. E values for enrichment of the respective motif are shown in Figure S2D. Motifs are only shown if the enrichment was significant.
(D) Central enrichment of E-box, CTCF, and AP2a (as a negative control) motifs in the N-MYC peak of N-MYC/TFIIIC5 joint sites in Pol II promoters. The E value is calculated by a binominal test and adjusted for the number of motifs tested.
(E) Heatmap showing occupancy of N-MYC, TFIIIC5, RAD21, and CTCF on overlapping N-MYC/TFIIIC sites in IMR-5 cells. Samples are normalized to the same number of mapped reads, and peaks are sorted according to N-MYC binding.
(F) Boxplot documenting occupancy of the indicated proteins at joint N-MYC/TFIIIC5 binding sites (n = 1,630) and at N-MYC binding sites lacking TFIIIC5 (n = 2,406) located in promoters of Pol II genes. The number of reads was counted in a region of ± 100 bp around the N-MYC peak summit.
See also Figure S2. n indicates the number of independent biological replicas for each experiment.
MYC proteins bind to E-box sequences (CAC(A/G)TG) as part of a heterodimeric complex with MAX (Blackwell et al., 1993). Consistently, a de novo motif search identified E-boxes as a predominant motif enriched in N-MYC binding sites in Pol II promoters and at N-MYC/TFIIIC joint intergenic sites (Figure 2C; Figure S2D). TFIIIC promotes binding to a sequence termed A-box at tRNA promoters that are not present at ETC sites (Figure 2C; Figure S2D; Moqtaderi et al., 2010). In addition, TFIIIC binds to a sequence termed B-box that is present in tRNA promoters and in ETC sites and the de novo motif search confirmed these observations (Figure 2C; Figure S2D; Moqtaderi et al., 2010). B-boxes were also found in overlapping N-MYC/TFIIIC sites in core promoters.
In addition to TFIIIC, ETC sites are also bound by the CTCF transcription factor (Moqtaderi et al., 2010, Oler et al., 2010, Carrière et al., 2012, Vietri Rudan and Hadjur, 2015). Indeed, a de novo motif search analysis identified a centrally enriched consensus motif for CTCF at joint N-MYC/TFIIIC binding sites (Figures 2C and 2D; Figures S2D–S2F). ChIP sequencing confirmed the presence of CTCF at 936 of 2,053 joint N-MYC/TFIIIC binding sites and showed a much lower occupancy at N-MYC sites that do not bind TFIIIC (Figures 2E and 2F; Figure S2G). We concluded that N-MYC is present at previously characterized TFIIIC binding sites both in RNA polymerase III promoters and at ETC sites.
N-MYC and TFIIIC Promote Chromatin Association of RAD21 at Joint Binding Sites
CTCF binding sites define contact points for RAD21/cohesin-mediated chromosomal interactions (Ghirlando and Felsenfeld, 2016). Consistent with this notion, ChIP sequencing showed that RAD21 was present at virtually all (22,642 of 23,479) CTCF-bound sites and at 1,328 of 2,053 joint N-MYC/TFIIIC sites (Figures 2E and 3A). RAD21 occupancy was much lower at N-MYC sites that do not bind TFIIIC (Figure 2F). We also observed that endogenous TFIIIC5 robustly co-immunoprecipitated endogenous RAD21 (Figure 3B). Because RAD21/cohesin complexes do not bind DNA directly, these observations raised the question of whether TFIIIC or N-MYC affects chromatin association of each other and of RAD21. We therefore performed ChIP experiments in cells stably expressing doxycycline-inducible short hairpin RNAs (shRNAs) targeting either TFIIIC or N-MYC. Depletion of TFIIIC5 had little effect on steady-state levels of N-MYC, RAD21, Aurora-A, and the DNA binding subunit TFIIIC2 but led to a small reduction in TFIIIC1 levels (Figure 3C; Figure S3A; Shen et al., 1996). As expected, we observed reduced binding of TFIIIC5 at multiple N-MYC-bound loci (Figure 3D). Depletion of TFIIIC5 had no effect on binding of N-MYC but reduced binding of RAD21 at almost all tested joint binding sites, demonstrating that TFIIIC5 promotes binding of RAD21 (Figure 3D). In contrast, depletion of TFIIIC5 had no effect on RAD21 association with sites that were not bound by TFIIIC and N-MYC (Figure S3B). Notably, shRNA-mediated depletion of TFIIIC5 strongly reduced TFIIIC5 occupancy at sites transcribed by Pol II, but TFIIIC5 binding to tRNA sites was more stable (Figure S3C). Although RAD21 is not detected at tRNA genes (Oler et al., 2010, Moqtaderi et al., 2010), the stable binding of TFIIIC5 to tRNA encoding genes precluded an unequivocal determination of whether TFIIIC5 promotes binding of N-MYC to tRNA genes. We also depleted TFIIIC2 and found that this has no effect on either N-MYC or RAD21 binding to joint sites, arguing that not all subunits of TFIIIC are limiting for chromatin association of RAD21 (Figures S3A and S3D). Depletion of N-MYC using a doxycycline-inducible shRNA reduced binding of N-MYC to most joint sites and significantly reduced binding of both TFIIIC5 and of RAD21 to some sites, although the extent of reduction was more variable than observed after TFIIIC5 depletion (Figures 3E and 3F). In contrast, depletion of N-MYC did not decrease RAD21 association with sites that were not bound by TFIIIC and N-MYC (Figure S3E). Taken together, the results suggest a hierarchy of chromatin binding in which N-MYC contributes to recruitment of both TFIIIC5 and RAD21 and TFIIIC5 is required for association of RAD21 with joint binding sites.
Figure 3.

Assembly of N-MYC/TFIIIC and RAD21 Complexes on Chromatin
(A) Venn diagram documenting genome-wide overlap of N-MYC/TFIIIC5 joint binding sites with RAD21 binding sites. The p value was calculated using a permutation test with 100,000 iterations.
(B) Immunoblots of α-TFIIIC5 immunoprecipitates from IMR-5 cells. The input corresponds to 1% of the amount used for the precipitation. Non-specific IgG was used for control immunoprecipitates. Where indicated, CD532 (1 μM) was added to cells 4 hr prior to immunoprecipitation (n = 3).
(C) Immunoblot showing levels of the indicated proteins in response to depletion of TFIIIC5. IMR-5 cells expressing an inducible shRNA directed against TFIIIC5 were treated with doxycycline (Dox) for 48 hr or with ethanol (EtOH) as a control (n = 3).
(D) ChIP experiments documenting binding of TFIIIC5, N-MYC, and RAD21 to the indicated loci upon depletion of TFIIIC5. Error bars show SD of technical triplicates from one experiment (n = 2).
(E) Immunoblot showing levels of the indicated proteins in response to depletion of N-MYC. IMR-5 cells expressing an inducible shRNA directed against N-MYC were treated with Dox for 48 hr or with EtOH as a control (n = 3).
(F) ChIP experiments documenting binding of TFIIIC5, N-MYC, and RAD21 to the indicated loci upon depletion of N-MYC. Error bars show SD of technical triplicates from one experiment (n = 2).
See also Figure S3. n indicates the number of independent biological replicas for each experiment.
Transcriptional Regulation by N-MYC and TFIIIC/RAD21
To determine whether TFIIIC5 and RAD21 are required for the transcription of N-MYC target genes, we depleted either protein in IMR-5 cells using specific siRNAs. Control immunoblots are shown in Figure 4A. RNA sequencing of two independent samples for each protein showed a significant overlap of genes regulated in response to depletion of either protein (Figure 4B). Gene set enrichment analysis (GSEA) (Subramanian et al., 2005) showed that multiple well-characterized sets of MYC-activated target genes were significantly downregulated upon depletion of TFIIIC5 or RAD21; in contrast, only few gene sets were significantly upregulated upon depletion of TFIIIC5 or RAD21 (Figures 4C and 4D). GSEA showed that the most consistently downregulated gene sets encoded proteins involved in cell cycle progression, DNA replication, nucleotide metabolism, and telomere biology (Figure 4D). Comparison with expression profiles obtained after shRNA-mediated depletion of N-MYC in neuroblastoma cells (Valentijn et al., 2012) confirmed that expression of these genes is sensitive to depletion of N-MYC (Figures 4C and 4E). Furthermore, expression of gene sets that are sensitive to depletion of TFIIIC, RAD21, and N-MYC strongly correlated with MYCN amplification and advanced tumor stage in neuroblastoma, both of which are characteristic features of aggressive tumors with a poor prognosis (Figure 4F; Molenaar et al., 2012). We concluded that TFIIIC and RAD21 are required for expression of a subset of N-MYC target genes that are characteristic for MYCN-amplified neuroblastoma tumors. Consistent with these effects on gene expression, shRNA-mediated depletion of TFIIIC5 protein suppressed the growth of neuroblastoma cells (Figure S4A), although it had little effect on the expression of two tRNA genes we tested (Figure S4B). Notably, growth suppression by depletion of TFIIIC5 was independent of MYCN amplification (Figure S4A), arguing that TFIIIC5 also has essential functions in non MYCN-amplified cells. Most likely, the residual growth of IMR-5 cells after shRNA-mediated depletion of TFIIIC5 was due to incomplete removal of TFIIIC5 because multiple sgRNAs targeting TFIIIC5 eliminated cell growth (Figure S4C). This is consistent with the demonstration that subunits 1–5 of TFIIIC, RAD21, and TOP2A have been identified as essential proteins in genome-wide CRISPR-based loss-of-function screens (Hart et al., 2015). Depletion of TFIIIC5 caused little apoptosis and, like depletion of N-MYC (Otto et al., 2009), delayed progression through all phases of the cell cycle; hence, fluorescence-activated cell sorting (FACS) analyses did not detect a major shift in cell cycle distribution (Figure S4D).
Figure 4.

Gene Regulation by N-MYC, TFIIIC, and RAD21
(A) Immunoblots documenting levels of the indicated proteins 48 hr after transfection of specific siRNAs. Duplicate samples are shown, both of which were used for RNA sequencing. All lanes are from the same exposure of a single immunoblot.
(B) Venn diagrams documenting the overlap of upregulated (top) and downregulated (bottom) genes after depletion of TFIIIC5 or RAD21 in IMR-5 neuroblastoma cells. The p values were calculated using a Monte Carlo simulation with 100,000 permutations and all expressed genes (n = 17,450) as the basis.
(C) Correlation of gene sets that change in expression upon depletion of N-MYC with the aggregate of changes in response to siRNA-mediated depletion of RAD21 and TFIIIC5. Each dot reflects a gene set. A light gray color indicates that the expression change of a gene set was not statistically significant. Published sets of MYC target genes are colored.
(D) Examples of gene sets that are downregulated in response to depletion of both RAD21 and TFIIIC5. NES is the normalized enrichment score, indicating direction and extent of regulation.
(E) Boxplots documenting changes in expression of selected gene sets upon depletion of N-MYC using a Dox-inducible shRNA in IMR-32 neuroblastoma cells.
(F) Heatmap illustrating stage-specific expression of N-MYC/TFIIIC/RAD21-regulated genes sets in human neuroblastoma cells. The black bars in the first row indicate MYCN amplification status.
See also Figure S4. n indicates the number of independent biological replicas for each experiment.
Cell Cycle-Dependent Regulation of N-MYC Binding and Chromatin Association
Aurora-A has been implicated in cell cycle progression, prompting us to analyze complex formation between N-MYC and Aurora-A throughout the cell cycle in a semiquantitative manner using proximity ligation assays (PLAs) (Söderberg et al., 2006). In PLAs, a rolling circle amplification using oligonucleotides bound to secondary antibodies generates a signal that appears as a fluorescent dot when two antigens are in proximity of each other. Controls using a N-MYC antibody in SH-EP cells that do not express N-MYC (Figure S5A) or using no primary antibody (Figure S5B) established that the signals observed in these assays are specific. We used either a release from a double thymidine block (Figure S5C) or re-stimulation of serum-starved cells (Figure S5D) to synchronize cells. In both experimental settings, Aurora-A predominantly associated with N-MYC during the S phase of the cell cycle, and complex formation was regulated independently of changes in overall N-MYC and Aurora-A protein levels (Figures 5A, 5B, and 5E; Figures S5E and S5F). We next tested whether association of N-MYC with cofactors changes throughout the cell cycle. Neither the association of N-MYC with p400 and TRRAP, which is mediated by MYCBoxII (amino acids 128–143), nor the interactions with the PAF1 components CTR9 and CDC73, for which the interaction domains are unknown, varied throughout the cell cycle (Figure S5G). In contrast, association of RAD21 with N-MYC was essentially absent during S phase (Figures 5C–5E). Similarly, associations of N-MYC with TOP2A and TFIIIC5 changed during cell cycle progression and were significantly lower in S phase (Figures 5C–5E; Figure S5H). ChIP experiments from cells harvested in G1 and S phase showed that association of N-MYC with joint binding sites was essentially equal in both cell cycle phases, whereas chromatin association of RAD21 was strongly reduced in S relative to G1 phase (Figure 5F). Chromatin association of TFIIIC was also reduced in S phase, but the extent of decrease was more variable between different gene loci. We concluded that complex formation of N-MYC with RAD21, TFIIIC, and TOP2A and chromatin binding of RAD21 and TFIIIC are reduced during S phase.
Figure 5.

Regulation of N-MYC Transcription Complexes during the Cell Cycle
(A) Representative pictures from proximity ligation assays (PLAs) documenting complex formation between N-MYC and Aurora-A in IMR-5 cells after release from a double thymidine block. Non-synchronized cells are shown as a control (Ctr). Nuclei were stained using Hoechst. Red dots show PLA signals resulting from N-MYC/Aurora-A interactions (n = 3).
(B) Quantification of the PLA shown in (A). The percentage of cells in S phase is indicated in parallel. Error bars show SD of technical triplicates from one representative experiment (n = 3).
(C) Representative FACS profiles of propidium iodide (PI)-stained cells documenting cell cycle distribution at the indicated times after release from a double thymidine block.
(D) Representative pictures from PLAs documenting complex formation between N-MYC and RAD21 and TOP2A and TFIIIC5 in IMR-5 cells at the indicated times after release from a double thymidine block. Nuclei were stained using Hoechst. Red dots show PLA signals (n = 3).
(E) Quantification of PLAs shown in (A) and (D). Bars show mean + SD of technical triplicates from one representative experiment (n = 3). ∗∗p < 0.01, ∗∗∗p < 0.001.
(F) ChIP of IMR-5 cells documenting chromatin association of N-MYC, RAD21, and TFIIIC5 at the indicated gene loci at the indicated times after release from a double thymidine block. Error bars show SD of technical triplicates from one representative experiment (n = 3).
See also Figure S5. n indicates the number of independent biological replicas for each experiment.
Aurora-A Antagonizes N-MYC/RAD21 Complex Formation in S Phase
We showed previously that association with N-MYC activates the catalytic activity of Aurora-A (Richards et al., 2016), and large-scale proteomic analyses show that multiple proteins associated with N-MYC, including TFIIIC2 and TOP2A, are phosphorylated in an Aurora-A-dependent manner in vivo (Kettenbach et al., 2011). These findings, and the observation that Aurora-A competes with association of RAD21 with N-MYC, led us to hypothesize that Aurora-A may antagonize complex formation of N-MYC with RAD21, TOP2A, and, potentially, TFIIIC during S phase. To test this, we used three structurally well-characterized Aurora-A inhibitors to acutely antagonize Aurora-A (Figure 6A; Richards et al., 2016). Of the inhibitors used, MK-5108 is a purely catalytic Aurora-A inhibitor that does not alter the conformation of Aurora-A and does not affect complex formation with N-MYC. MLN8237 inhibits both the catalytic activity of Aurora-A and moderately distorts the N-MYC/Aurora-A complex, enhancing degradation of N-MYC by FBXW7 in mitosis. CD532 strongly distorts the Aurora-A structure, dissociates the N-MYC/Aurora-A complex, and induces subsequent degradation of Aurora-A and N-MYC (Richards et al., 2016). We confirmed that CD532 causes a proteasome-dependent decrease in N-MYC and Aurora-A levels (Figures S6A and S6B). In contrast, CD532 had no effect on complex formation of TFIIIC5 with RAD21 (Figure 3B).
Figure 6.

Role of Aurora-A in Dynamics of N-MYC Complexes during the Cell Cycle
(A) Immunoblot documenting levels of the indicated proteins and of Aurora-A, which is autophosphorylated at T288 (indicating catalytically active Aurora-A), in IMR-5 MYCN-amplified neuroblastoma cells after 4 hr (left) or 24 hr (right) exposure to 1 μM of the indicated Aurora-A inhibitors (n = 4).
(B) Representative pictures from PLAs documenting complex formation between N-MYC and RAD21 and TOP2A or TFIIIC5 in IMR-5 cells released for 4 hr from a double thymidine block in the presence of the indicated Aurora-A inhibitors (1 μM) or DMSO as a control. Nuclei were stained using Hoechst. Red dots show signals arising from interaction of N-MYC with the indicated proteins.
(C) Quantification of PLAs shown in (B). Data are normalized to DMSO-treated cells. Bars show mean + SD of technical triplicates from one experiment (n = 4). ∗∗p < 0.01, ∗∗∗p < 0.001.
(D) Genome browser tracks at the PPRC1 locus, illustrating chromatin association of the indicated proteins. The positions of B- and E-boxes and of CTCF motifs are indicated by vertical lines. The upper input is for ChIP sequencing of N-MYC and TFIIIC5, the lower input is for ChIP-sequencing of RAD21 and CTCF.
(E) ChIP of IMR-5 cells documenting chromatin association of N-MYC, TFIIIC5, and RAD21 at the indicated loci after treatment (1 μM) with MK-5108 (24 hr), MLN8237 (24 hr), CD532 (4 hr), or DMSO as a control. Error bars show SEM of three independent experiments. Data are normalized to DMSO-treated cells.
See also Figure S6. n indicates the number of independent biological replicas for each experiment.
PLA assays from cells released for 4 hr from a double thymidine block into S phase showed that MK-5108 and MLN8237 enhanced interactions of N-MYC with TFIIIC5, TOP2A, and, albeit more weakly, RAD21 (Figures 6B and 6C). In these assays, MK-5108 had the strongest effect. CD532 and MLN8237 had smaller and more variable effects in PLAs with TOP2A, RAD21, and TFIIIC5, most likely because the observed signals reflect a combination of the decrease in N-MYC levels and an increase in interaction (Figures 6A–6C). The data argue that Aurora-A-dependent phosphorylation antagonizes interactions of N-MYC with all three proteins.
ChIP and ChIP sequencing showed that chromatin association of N-MYC decreased in response to CD532, consistent with the effects on protein levels (Figures 6D and 6E; Figure S6C). In contrast, CD532 globally increased TFIIIC binding to chromatin (Figure 6D; Figure S6D), and the number of joint N-MYC/TFIIIC binding sites increased to 7,994 in the presence of CD532 (Figure S6E; note that N-MYC binding to chromatin remains detectable at virtually all sites after 4 hr of CD532 treatment). ChIP assays confirmed that CD532 enhanced stable chromatin binding of TFIIIC and RAD21 at joint binding sites, whereas the effects of MLN8237 and MK-5108 were weak for most sites (Figure 6E). We concluded that a decrease in Aurora-A levels or dissociation of N-MYC/Aurora-A complexes promotes stable association of TFIIIC and RAD21 with N-MYC-bound loci in S phase; it is also possible that inhibition of Aurora-A-dependent TFIIIC2 phosphorylation contributes to the increase. Notably, chromatin association of TFIIIC also increased in response to CD532 on sites where no N-MYC peak was detected in ChIP sequencing (Figure S6E). It is possible, therefore, that Aurora-A inhibits TFIIIC binding to chromatin also when complexed by other transcription factors. However, removing the inherent threshold in peak-calling algorithms revealed the presence of N-MYC at the majority (26,165 of 36,736) of all TFIIIC sites detectable after CD532 treatment (Figure S6F). Most likely, therefore, N-MYC is associated with the majority of all TFIIIC sites.
Cell Cycle-Dependent Regulation of Pause Release by Aurora-A
To understand the role of TFIIIC in N-MYC-dependent pause release of Pol II, we analyzed SH-EP neuroblastoma cells, which express an N-MYCER chimeric protein that can be activated by addition of 4-Hydroxytamoxifen (4-OHT). We engineered these cells to express a doxycycline-inducible shRNA targeting TFIIIC5 (Figure 7A) and performed ChIP sequencing with antibodies directed against total Pol II before and 5 hr after addition of 4-OHT. Inspection of individual genes (ODC1 and NPM1) (Figure S7A) and global analyses (Figures 7B and 7C; Figure S7B) showed that activation of N-MYC led to a strong decrease in Pol II occupancy at the transcription start site and a corresponding decrease in the Pol II “traveling ratio,” which is defined as the ratio of Pol II occupancy at the promoter to occupancy in the gene body (Rahl et al., 2010). Depletion of TFIIIC5 by itself caused a moderate increase in Pol II promoter occupancy and Pol II traveling ratio (Figures 7B and 7C; Figures S7A and S7B). Intriguingly, depletion of TFIIIC5 abrogated the effect of N-MYCER on Pol II (Figures 7B and 7C; Figures S7A and S7B).
Figure 7.

Aurora-A Suppresses N-MYC-Dependent Pause Release of Pol II in S phase
(A) Immunoblot showing levels of TFIIIC5 in SH-EP-N-MYCER cells expressing a Dox-inducible shRNA targeting TFIIIC5 (n = 3). Dox (1 μg ml−1) was added for 30 hr; EtOH was used as a control.
(B) Metagene plot of all expressed genes (n = 14,650) illustrating distribution of Pol II within transcribed regions before and 5 hr after activation of N-MYCER in cells expressing Dox-inducible shTFIIIC5.
(C) 2D kernel density plot showing the ratio of Pol II occupancy at the promoter to occupancy in the gene body (traveling ratio) in cells treated as above for all expressed genes (n = 14,650) before and after 5 hr of N-MYCER-activation.
(D). ChIP of SH-EP N-MYCER cells documenting chromatin association of hypo-phosphorylated Pol II and Pol II phosphorylated at Ser5 (pSer5) or Ser2 (pSer2) at the indicated gene loci before and 5 hr after activation of N-MYCER. Occupancy at the transcription start site (TSS) was analyzed for hypo-phosphorylated Pol II and pSer5Pol II. Occupancy at the transcription end site (TES) was analyzed for pSer2Pol II. Dox (1 μg ml−1) was added for 30 hr; EtOH was used as a control. Error bars show SD of technical triplicates from one representative experiment (n = 3).
(E) Genome browser tracks illustrating chromatin association of Pol II and Pol II pSer2 at the ODC1 locus. ChIP sequencing was performed on cells synchronized in S phase by double thymidine blockade and treated for 2 hr with CD532 where indicated (1 μM).
(F) 2D kernel density plot showing the Pol II traveling ratio in response to N-MYCER activation in SH-EP cells that were synchronized in S phase by double thymidine block for all expressed genes (n = 14,650) before and after 4 hr of N-MYCER activation.
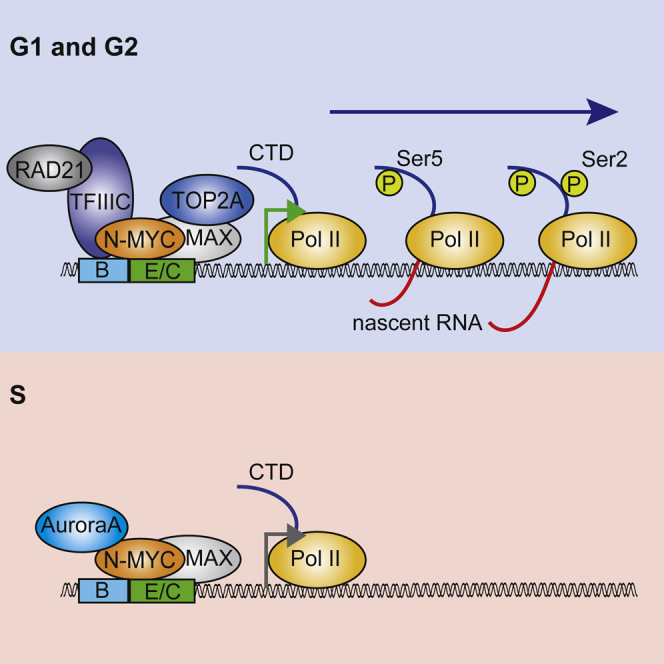
(G) Model summarizing our findings. We propose that the multiple protein-protein interactions of N-MYC promote sequential phosphorylation events of Pol II and both promotor escape and pause release. The dashed line indicates that effects on pause release and Ser2 phosphorylation could be secondary to changes in Ser5 phosphorylation. E/C indicates that the complex associates with sites on chromatin that contain either an E-box or a CTCF motif.
See also Figure S7. n indicates the number of independent biological replicas for each experiment.
To understand which of N-MYC’s effects on Pol II depend on TFIIIC, we performed ChIPs using antibodies that specifically recognize hypo-phosphorylated Pol II (8WG16) (Stock et al., 2007) or Pol II phosphorylated at Ser5, which occurs during escape of Pol II from the promoter, or at Ser2, which is a hallmark of pause release of Pol II, respectively. Intriguingly, ChIP sequencing showed that activation of N-MYC had no significant effect on chromatin association of hypo-phosphorylated Pol II (Figure S7C). To pinpoint the effect of N-MYC on Pol II function, we analyzed the association of Pol II with several MYC target genes for which Pol II does not decrease strongly at the promoter after N-MYC activation. Consistent with the ChIP sequencing data, neither activation of N-MYC nor depletion of TFIIIC5 had a significant effect on the association of hypo-phosphorylated Pol II with the transcription start site of several N-MYC target genes (Figure 7D). In contrast, depletion of TFIIIC5 abrogated both an N-MYC-dependent increase of Pol II that is phosphorylated at Ser5 at the transcription start site and of Pol II phosphorylated at Ser2 at the transcription end site (Figure 7D). Collectively, the data argue that TFIIIC5 is required for N-MYC-dependent escape of Pol II from the promoter and the subsequent pause release of Pol II.
To understand whether N-MYC-dependent pause release is cell cycle-regulated and whether Aurora-A affects this process, we activated N-MYCER in cells synchronized in S phase by a double thymidine block (Figures 7E and 7F). Under these circumstances, activation of N-MYC did not promote pause release of Pol II; rather, activation of N-MYC caused a slight global increase in Pol II occupancy at core promoters, consistent with observations that MYC proteins can enhance promoter association of Pol II (Jaenicke et al., 2016). To test whether Aurora-A is required to block N-MYC-dependent pause release in S phase, we added CD532 to synchronized cells and performed ChIP sequencing both in the presence and absence of 4-OHT. Addition of CD532 to cells with activated N-MYC globally enhanced association of Pol II with the body of transcribed genes (Figure 7E; Figure S7D). In contrast, CD532 had little effect on Pol II function in cells with inactive N-MYCER, arguing that the effects on Pol II are mediated via N-MYC (Figure 7E; Figure S7D). CD532 also enhanced association of Pol II with the promoter in a N-MYC-dependent manner and, as consequence, did not alter the overall traveling ratio (Figure S7E). Furthermore, CD532 increased chromatin association of pSer2-Pol II in the gene body and at the transcription end site, and the effect was stronger in the presence of active N-MYC (Figure 7E). We concluded that association with Aurora-A antagonizes N-MYC-dependent promoter binding of Pol II and transcriptional elongation during S phase.
Finally, we explored a possible effect of enhanced transcriptional elongation on DNA replication and monitored phosphorylation of the single-strand DNA binding protein RPA32 at S33, which is phosphorylated by the ATR kinase in response to replication stress (Figure S7F; Liu et al., 2012). Inhibition of Aurora-A during the release of IMR-5 cells from a double thymidine block markedly enhanced phosphorylation of this site. In contrast, we did not observe phosphorylation of RPA32 at S4 and S8, target sites of DNA-dependent protein kinase (DNA-PK), and no activation of CHK1 and stabilization of p53 (Figure S7F). Consistently, inhibition of Aurora-A perturbed S phase progression, but did not prevent S phase entry or induce apoptosis (Figure S7G; Discussion). A model summarizing our findings is shown in Figure 7G.
Discussion
We performed a proteomic analysis of N-MYC complexes in neuroblastoma cells and confirmed previously identified interactions of MYC and N-MYC proteins with MAX, the NuA4 complex, BPTF, p400, and the PAF1 complex. We also validated TFIIIC, RAD21, and TOP2A as interaction partners of N-MYC, arguing that N-MYC uses multiple effector proteins to regulate transcription. Previous proteomic analyses demonstrated the presence of TFIIIC and TOP2A in MYC complexes, suggesting that these interactions are conserved with MYC proteins (Koch et al., 2007).
Our data provide insights into how MYC accelerates several transitions of Pol II from one intermediate promoter state to the next. TFIIIC is both a general transcription factor of RNA polymerase III and an architectural protein (Van Bortle et al., 2014) and has been linked to the function of both cohesin and condensin complexes. In yeast, TFIIIC is required for loading condensin complexes onto tRNA genes (D’Ambrosio et al., 2008). In Drosophila, TFIIIC co-localizes with RAD21/cohesin at ETC sites (Van Bortle et al., 2014). Our ChIP sequencing data showed that N-MYC co-localizes with TFIIIC at multiple promoters and intergenic sites. TFIIIC is essential for transcription by RNA polymerase III, but the precise function of TFIIIC at ETC sites is unknown. We found that TFIIIC5 promotes association of RAD21 with N-MYC-bound promoters and is required for N-MYC-dependent phosphorylation of Pol II at Ser5 and Ser2 at several target genes, arguing that it promotes both promoter escape and pause release of Pol II. ChIP experiments suggest a hierarchy in which N-MYC promotes binding of TFIIIC, and TFIIIC, in turn, recruits RAD21. Because RAD21 and cohesin can promote pause release of Pol II (Schaaf et al., 2013), we suggest that N-MYC-dependent recruitment of RAD21 via TFIIIC facilitates promoter escape and pause release of Pol II in an enhancer-dependent manner. The model is consistent with the recent observation that depletion of RAD21 represses expression of N-MYC and MYC target genes (Rohban et al., 2017). Because the identity of active enhancers is characteristic for each cell, a model in which N-MYC facilitates the function of pre-existing enhancers could explain how N-MYC can “amplify” a pre-existing gene expression program.
Topoisomerase I is activated at core promoters via direct association with Pol II and promotes pause release because it relieves the torsional stress that builds up during early stages of transcription (Baranello et al., 2016). Because TOP2A associates with promoters of highly transcribed genes (Kouzine et al., 2013), it is likely that the association with N-MYC similarly relieves torsional stress during early stages of transcription, suggesting that multiple protein-protein interactions enable MYC proteins to facilitate consecutive steps of transcription (Figure 7G).
Unexpectedly, complexes of N-MYC are highly dynamic during the cell cycle. In vitro, Aurora-A competes with binding of TFIIIC and RAD21 to the amino-terminus of N-MYC. A secondary binding site for Aurora-A overlaps with MYCBoxIV, which binds to HCF1, and it is possible, therefore, that Aurora-A also competes with HCF1 for binding to N-MYC (Thomas et al., 2016). In vivo, Aurora-A inhibits chromatin binding of TFIIIC and RAD21 and interactions of N-MYC with RAD21, TOP2A, and TFIIIC in S phase (Figure 7G). N-MYC-dependent pause release is inhibited in S phase, and inhibition of Aurora-A using CD532 partially restores elongation. Why might this regulation be important? Inhibition of Aurora-A during S phase activates the ATR kinase, which monitors replication stress (Hamperl and Cimprich, 2016). Phosphorylation of RPA32 at S33 with no CHK1 phosphorylation, as observed here, has been linked to recovery of collapsed replication forks rather than CHK1-mediated cell cycle arrest and DNA repair (Shiotani et al., 2013). We hypothesize, therefore, that MYC-dependent transcriptional elongation has an inherent potential to cause conflicts with DNA replication and that complex formation of N-MYC with Aurora-A is one of several co-transcriptional mechanisms that prevent such conflicts (Hamperl and Cimprich, 2016). Notably, TFIIIC binding was detected at many sites on chromatin at which we did not detect N-MYC, and TFIIIC binding was regulated by Aurora-A also at such sites. It is possible, therefore, that Aurora-A also regulates TFIIIC chromatin association independently of N-MYC. However, removing the inherent threshold in peak calling revealed the presence of N-MYC at the majority of all TFIIIC sites.
Inhibition of Aurora-A shows therapeutic efficacy in multiple MYC- and N-MYC-driven tumor models (Dardenne et al., 2016, Dauch et al., 2016). Similarly, deregulated expression of MYC and N-MYC activates ATR, and inhibition of ATR or CHK1 are being explored as possible therapeutic strategies for MYC- and N-MYC-driven tumors (Cole et al., 2011, Murga et al., 2011). Our findings suggest that MYC-driven tumors are particularly dependent on Aurora-A to avoid transcription/replication conflicts and open the possibility for rational development of therapies targeting these tumors.
Experimental Procedures
Further details and an outline of the resources used in this work can be found in the Supplemental Experimental Procedures.
Cell Culture and Cell Cycle Synchronization
Neuroblastoma cell lines (IMR-5, IMR-32, and SH-EP) were grown in RPMI-1640 supplemented with 10% fetal calf serum and penicillin/streptomycin. For synchronization in S phase, cells were treated for 16 hr with 2 mM thymidine, released for 8 hr into normal medium, and then blocked again (2 mM, 16 hr). For release, cells were washed with PBS before fresh medium was added.
High-Throughput Sequencing
ChIP and ChIP sequencing were performed as described previously (Walz et al., 2014). RNA sequencing was performed as described previously (Jaenicke et al., 2016) using an Illumina NextSeq 500. Preparations of samples, data quality assessment, filtering, and mapping are described in the Supplemental Experimental Procedures.
In Situ PLA
The PLA was performed using the Duolink In Situ Kit (Sigma-Aldrich) according to the manufacturer’s protocol. Pictures were taken with a confocal microscope (Nikon Ti-Eclipse) at 60× magnification. For quantification, the dots in not less than 300 cells were counted using ImageJ (Wayne Rasband, NIH). Antibodies are listed in the resource table in the Supplemental Experimental Procedures.
Statistical Methods
Statistical significance between experimental groups was determined by Student’s t test or, when means of three or more groups were compared, by one-way ANOVA. Data analysis was performed with Prism5.0 software (GraphPad). p < 0.05 was considered statistically significant.
Acknowledgments
We acknowledge the technology platform of the Rudolf Virchow Center (Würzburg) for mass spectrometry analyses. This work was funded by grants from the European Research Council (AuroMYC to M.E. and R.B.), Deutsche Krebshilfe Grant 111300 (to M.E.), Cancer Research UK Grant C24461/A12772 (to R.B.), and a Prostate Cancer Foundation Challenge Award (to M.E. and D.S.R.).
Author Contributions
G.B., A.C., K.-Y.M., I.R., E.L., O.S., J.H., S.H., J.K., E.P., C.K., and H.M.M. performed the experiments. A.B. and S.W. analyzed the high-throughput data. G.B., L.C., D.S.R., E.W., R.B., and M.E. devised and supervised the experiments; M.E. wrote the paper.
Declaration of Interests
The authors declare no competing interests.
Published: December 19, 2017
Footnotes
Supplemental Information includes Supplemental Experimental Procedures, seven figures, and one table and can be found with this article online at https://doi.org/10.1016/j.celrep.2017.11.090.
Data and Software Availability
The accession number for the RNA and ChIP sequencing data reported in this paper is GEO: GSE78957.
Supplemental Information
References
- Baranello L., Wojtowicz D., Cui K., Devaiah B.N., Chung H.J., Chan-Salis K.Y., Guha R., Wilson K., Zhang X., Zhang H. RNA polymerase II regulates topoisomerase 1 activity to favor efficient transcription. Cell. 2016;165:357–371. doi: 10.1016/j.cell.2016.02.036. [DOI] [PMC free article] [PubMed] [Google Scholar]
- Beltran H. The N-MYC oncogene: maximizing its targets, regulation, and therapeutic potential. Mol. Cancer Res. 2014;12:815–822. doi: 10.1158/1541-7786.MCR-13-0536. [DOI] [PubMed] [Google Scholar]
- Blackwell T.K., Huang J., Ma A., Kretzner L., Alt F.W., Eisenman R.N., Weintraub H. Binding of MYC proteins to canonical and noncanonical DNA sequences. Mol. Cell. Biol. 1993;13:5216–5224. doi: 10.1128/mcb.13.9.5216. [DOI] [PMC free article] [PubMed] [Google Scholar]
- Carrière L., Graziani S., Alibert O., Ghavi-Helm Y., Boussouar F., Humbertclaude H., Jounier S., Aude J.C., Keime C., Murvai J. Genomic binding of Pol III transcription machinery and relationship with TFIIS transcription factor distribution in mouse embryonic stem cells. Nucleic Acids Res. 2012;40:270–283. doi: 10.1093/nar/gkr737. [DOI] [PMC free article] [PubMed] [Google Scholar]
- Chesler L., Schlieve C., Goldenberg D.D., Kenney A., Kim G., McMillan A., Matthay K.K., Rowitch D., Weiss W.A. Inhibition of phosphatidylinositol 3-kinase destabilizes MYCN protein and blocks malignant progression in neuroblastoma. Cancer Res. 2006;66:8139–8146. doi: 10.1158/0008-5472.CAN-05-2769. [DOI] [PMC free article] [PubMed] [Google Scholar]
- Cole K.A., Huggins J., Laquaglia M., Hulderman C.E., Russell M.R., Bosse K., Diskin S.J., Attiyeh E.F., Sennett R., Norris G. RNAi screen of the protein kinome identifies checkpoint kinase 1 (CHK1) as a therapeutic target in neuroblastoma. Proc. Natl. Acad. Sci. USA. 2011;108:3336–3341. doi: 10.1073/pnas.1012351108. [DOI] [PMC free article] [PubMed] [Google Scholar]
- Cowling V.H., Cole M.D. The MYC transactivation domain promotes global phosphorylation of the RNA polymerase II carboxy-terminal domain independently of direct DNA binding. Mol. Cell. Biol. 2007;27:2059–2073. doi: 10.1128/MCB.01828-06. [DOI] [PMC free article] [PubMed] [Google Scholar]
- Cox J., Mann M. MaxQuant enables high peptide identification rates, individualized P.P.B.-range mass accuracies and proteome-wide protein quantification. Nat. Biotechnol. 2008;26:1367–1372. doi: 10.1038/nbt.1511. [DOI] [PubMed] [Google Scholar]
- Crepaldi L., Policarpi C., Coatti A., Sherlock W.T., Jongbloets B.C., Down T.A., Riccio A. Binding of TFIIIC to sine elements controls the relocation of activity-dependent neuronal genes to transcription factories. PLoS Genet. 2013;9:e1003699. doi: 10.1371/journal.pgen.1003699. [DOI] [PMC free article] [PubMed] [Google Scholar]
- D’Ambrosio C., Schmidt C.K., Katou Y., Kelly G., Itoh T., Shirahige K., Uhlmann F. Identification of cis-acting sites for condensin loading onto budding yeast chromosomes. Genes Dev. 2008;22:2215–2227. doi: 10.1101/gad.1675708. [DOI] [PMC free article] [PubMed] [Google Scholar]
- Dang C.V. MYC on the path to cancer. Cell. 2012;149:22–35. doi: 10.1016/j.cell.2012.03.003. [DOI] [PMC free article] [PubMed] [Google Scholar]
- Dardenne E., Beltran H., Benelli M., Gayvert K., Berger A., Puca L., Cyrta J., Sboner A., Noorzad Z., MacDonald T. N-MYC induces an EZH2-mediated transcriptional program driving neuroendocrine prostate cancer. Cancer Cell. 2016;30:563–577. doi: 10.1016/j.ccell.2016.09.005. [DOI] [PMC free article] [PubMed] [Google Scholar]
- Dauch D., Rudalska R., Cossa G., Nault J.C., Kang T.W., Wuestefeld T., Hohmeyer A., Imbeaud S., Yevsa T., Hoenicke L. A MYC-aurora kinase A protein complex represents an actionable drug target in p53-altered liver cancer. Nat. Med. 2016;22:744–753. doi: 10.1038/nm.4107. [DOI] [PubMed] [Google Scholar]
- DuBois S.G., Marachelian A., Fox E., Kudgus R.A., Reid J.M., Groshen S., Malvar J., Bagatell R., Wagner L., Maris J.M. Phase I study of the Aurora A kinase inhibitor alisertib in combination with irinotecan and temozolomide for patients with relapsed or refractory neuroblastoma: a NANT (new approaches to neuroblastoma therapy) trial. J. Clin. Oncol. 2016;34:1368–1375. doi: 10.1200/JCO.2015.65.4889. [DOI] [PMC free article] [PubMed] [Google Scholar]
- Fuchs M., Gerber J., Drapkin R., Sif S., Ikura T., Ogryzko V., Lane W.S., Nakatani Y., Livingston D.M. The p400 complex is an essential E1A transformation target. Cell. 2001;106:297–307. doi: 10.1016/s0092-8674(01)00450-0. [DOI] [PubMed] [Google Scholar]
- Ghirlando R., Felsenfeld G. CTCF: making the right connections. Genes Dev. 2016;30:881–891. doi: 10.1101/gad.277863.116. [DOI] [PMC free article] [PubMed] [Google Scholar]
- Gomez-Roman N., Grandori C., Eisenman R.N., White R.J. Direct activation of RNA polymerase III transcription by c-MYC. Nature. 2003;421:290–294. doi: 10.1038/nature01327. [DOI] [PubMed] [Google Scholar]
- Hamperl S., Cimprich K.A. Conflict resolution in the genome: how transcription and replication make it work. Cell. 2016;167:1455–1467. doi: 10.1016/j.cell.2016.09.053. [DOI] [PMC free article] [PubMed] [Google Scholar]
- Hart T., Chandrashekhar M., Aregger M., Steinhart Z., Brown K.R., MacLeod G., Mis M., Zimmermann M., Fradet-Turcotte A., Sun S. High-resolution CRISPR screens reveal fitness genes and genotype-specific cancer liabilities. Cell. 2015;163:1515–1526. doi: 10.1016/j.cell.2015.11.015. [DOI] [PubMed] [Google Scholar]
- Jaenicke L.A., von Eyss B., Carstensen A., Wolf E., Xu W., Greifenberg A.K., Geyer M., Eilers M., Popov N. Ubiquitin-dependent turnover of MYC antagonizes MYC/PAF1C complex accumulation to drive transcriptional elongation. Mol. Cell. 2016;61:54–67. doi: 10.1016/j.molcel.2015.11.007. [DOI] [PubMed] [Google Scholar]
- Jonkers I., Lis J.T. Getting up to speed with transcription elongation by RNA polymerase II. Nat. Rev. Mol. Cell Biol. 2015;16:167–177. doi: 10.1038/nrm3953. [DOI] [PMC free article] [PubMed] [Google Scholar]
- Kettenbach A.N., Schweppe D.K., Faherty B.K., Pechenick D., Pletnev A.A., Gerber S.A. Quantitative phosphoproteomics identifies substrates and functional modules of Aurora and Polo-like kinase activities in mitotic cells. Sci. Signal. 2011;4:rs5. doi: 10.1126/scisignal.2001497. [DOI] [PMC free article] [PubMed] [Google Scholar]
- Koch H.B., Zhang R., Verdoodt B., Bailey A., Zhang C.D., Yates J.R., 3rd, Menssen A., Hermeking H. Large-scale identification of c-MYC-associated proteins using a combined TAP/MudPIT approach. Cell Cycle. 2007;6:205–217. doi: 10.4161/cc.6.2.3742. [DOI] [PubMed] [Google Scholar]
- Kouzine F., Gupta A., Baranello L., Wojtowicz D., Ben-Aissa K., Liu J., Przytycka T.M., Levens D. Transcription-dependent dynamic supercoiling is a short-range genomic force. Nat. Struct. Mol. Biol. 2013;20:396–403. doi: 10.1038/nsmb.2517. [DOI] [PMC free article] [PubMed] [Google Scholar]
- Lin C.Y., Lovén J., Rahl P.B., Paranal R.M., Burge C.B., Bradner J.E., Lee T.I., Young R.A. Transcriptional amplification in tumor cells with elevated c-MYC. Cell. 2012;151:56–67. doi: 10.1016/j.cell.2012.08.026. [DOI] [PMC free article] [PubMed] [Google Scholar]
- Liu S., Opiyo S.O., Manthey K., Glanzer J.G., Ashley A.K., Amerin C., Troksa K., Shrivastav M., Nickoloff J.A., Oakley G.G. Distinct roles for DNA-PK, ATM and ATR in RPA phosphorylation and checkpoint activation in response to replication stress. Nucleic Acids Res. 2012;40:10780–10794. doi: 10.1093/nar/gks849. [DOI] [PMC free article] [PubMed] [Google Scholar]
- Marumoto T., Zhang D., Saya H. Aurora-A - a guardian of poles. Nat. Rev. Cancer. 2005;5:42–50. doi: 10.1038/nrc1526. [DOI] [PubMed] [Google Scholar]
- McMahon S.B., Van Buskirk H.A., Dugan K.A., Copeland T.D., Cole M.D. The novel ATM-related protein TRRAP is an essential cofactor for the c-MYC and E2F oncoproteins. Cell. 1998;94:363–374. doi: 10.1016/s0092-8674(00)81479-8. [DOI] [PubMed] [Google Scholar]
- Michel M., Cramer P. Transitions for regulating early transcription. Cell. 2013;153:943–944. doi: 10.1016/j.cell.2013.04.050. [DOI] [PubMed] [Google Scholar]
- Molenaar J.J., Koster J., Zwijnenburg D.A., van Sluis P., Valentijn L.J., van der Ploeg I., Hamdi M., van Nes J., Westerman B.A., van Arkel J. Sequencing of neuroblastoma identifies chromothripsis and defects in neuritogenesis genes. Nature. 2012;483:589–593. doi: 10.1038/nature10910. [DOI] [PubMed] [Google Scholar]
- Moqtaderi Z., Wang J., Raha D., White R.J., Snyder M., Weng Z., Struhl K. Genomic binding profiles of functionally distinct RNA polymerase III transcription complexes in human cells. Nat. Struct. Mol. Biol. 2010;17:635–640. doi: 10.1038/nsmb.1794. [DOI] [PMC free article] [PubMed] [Google Scholar]
- Murga M., Campaner S., Lopez-Contreras A.J., Toledo L.I., Soria R., Montaña M.F., Artista L., Schleker T., Guerra C., Garcia E. Exploiting oncogene-induced replicative stress for the selective killing of Myc-driven tumors. Nat. Struct. Mol. Biol. 2011;18:1331–1335. doi: 10.1038/nsmb.2189. [DOI] [PMC free article] [PubMed] [Google Scholar]
- Nie Z., Hu G., Wei G., Cui K., Yamane A., Resch W., Wang R., Green D.R., Tessarollo L., Casellas R. c-MYC is a universal amplifier of expressed genes in lymphocytes and embryonic stem cells. Cell. 2012;151:68–79. doi: 10.1016/j.cell.2012.08.033. [DOI] [PMC free article] [PubMed] [Google Scholar]
- Oler A.J., Alla R.K., Roberts D.N., Wong A., Hollenhorst P.C., Chandler K.J., Cassiday P.A., Nelson C.A., Hagedorn C.H., Graves B.J., Cairns B.R. Human RNA polymerase III transcriptomes and relationships to Pol II promoter chromatin and enhancer-binding factors. Nat. Struct. Mol. Biol. 2010;17:620–628. doi: 10.1038/nsmb.1801. [DOI] [PMC free article] [PubMed] [Google Scholar]
- Otto T., Horn S., Brockmann M., Eilers U., Schüttrumpf L., Popov N., Kenney A.M., Schulte J.H., Beijersbergen R., Christiansen H. Stabilization of N-MYC is a critical function of Aurora-A in human neuroblastoma. Cancer Cell. 2009;15:67–78. doi: 10.1016/j.ccr.2008.12.005. [DOI] [PubMed] [Google Scholar]
- Rahl P.B., Lin C.Y., Seila A.C., Flynn R.A., McCuine S., Burge C.B., Sharp P.A., Young R.A. c-MYC regulates transcriptional pause release. Cell. 2010;141:432–445. doi: 10.1016/j.cell.2010.03.030. [DOI] [PMC free article] [PubMed] [Google Scholar]
- Richards M.W., Burgess S.G., Poon E., Carstensen A., Eilers M., Chesler L., Bayliss R. Structural basis of N-MYC binding by Aurora-A and its destabilization by kinase inhibitors. Proc. Natl. Acad. Sci. USA. 2016;113:13726–13731. doi: 10.1073/pnas.1610626113. [DOI] [PMC free article] [PubMed] [Google Scholar]
- Richart L., Carrillo-de Santa Pau E., Río-Machín A., de Andrés M.P., Cigudosa J.C., Lobo V.J., Real F.X. BPTF is required for c-MYC transcriptional activity and in vivo tumorigenesis. Nat. Commun. 2016;7:10153. doi: 10.1038/ncomms10153. [DOI] [PMC free article] [PubMed] [Google Scholar]
- Rohban S., Cerutti A., Morelli M.J., d’Adda di Fagagna F., Campaner S. The cohesin complex prevents MYC-induced replication stress. Cell Death Dis. 2017;8:e2956. doi: 10.1038/cddis.2017.345. [DOI] [PMC free article] [PubMed] [Google Scholar]
- Sabò A., Kress T.R., Pelizzola M., de Pretis S., Gorski M.M., Tesi A., Morelli M.J., Bora P., Doni M., Verrecchia A. Selective transcriptional regulation by MYC in cellular growth control and lymphomagenesis. Nature. 2014;511:488–492. doi: 10.1038/nature13537. [DOI] [PMC free article] [PubMed] [Google Scholar]
- Schaaf C.A., Kwak H., Koenig A., Misulovin Z., Gohara D.W., Watson A., Zhou Y., Lis J.T., Dorsett D. Genome-wide control of RNA polymerase II activity by cohesin. PLoS Genet. 2013;9:e1003382. doi: 10.1371/journal.pgen.1003382. [DOI] [PMC free article] [PubMed] [Google Scholar]
- Shen Y., Igo M., Yalamanchili P., Berk A.J., Dasgupta A. DNA binding domain and subunit interactions of transcription factor IIIC revealed by dissection with poliovirus 3C protease. Mol. Cell. Biol. 1996;16:4163–4171. doi: 10.1128/mcb.16.8.4163. [DOI] [PMC free article] [PubMed] [Google Scholar]
- Shiotani B., Nguyen H.D., Håkansson P., Maréchal A., Tse A., Tahara H., Zou L. Two distinct modes of ATR activation orchestrated by Rad17 and Nbs1. Cell Rep. 2013;3:1651–1662. doi: 10.1016/j.celrep.2013.04.018. [DOI] [PMC free article] [PubMed] [Google Scholar]
- Sjostrom S.K., Finn G., Hahn W.C., Rowitch D.H., Kenney A.M. The Cdk1 complex plays a prime role in regulating N-MYC phosphorylation and turnover in neural precursors. Dev. Cell. 2005;9:327–338. doi: 10.1016/j.devcel.2005.07.014. [DOI] [PubMed] [Google Scholar]
- Söderberg O., Gullberg M., Jarvius M., Ridderstråle K., Leuchowius K.J., Jarvius J., Wester K., Hydbring P., Bahram F., Larsson L.G., Landegren U. Direct observation of individual endogenous protein complexes in situ by proximity ligation. Nat. Methods. 2006;3:995–1000. doi: 10.1038/nmeth947. [DOI] [PubMed] [Google Scholar]
- Stock J.K., Giadrossi S., Casanova M., Brookes E., Vidal M., Koseki H., Brockdorff N., Fisher A.G., Pombo A. Ring1-mediated ubiquitination of H2A restrains poised RNA polymerase II at bivalent genes in mouse ES cells. Nat. Cell Biol. 2007;9:1428–1435. doi: 10.1038/ncb1663. [DOI] [PubMed] [Google Scholar]
- Subramanian A., Tamayo P., Mootha V.K., Mukherjee S., Ebert B.L., Gillette M.A., Paulovich A., Pomeroy S.L., Golub T.R., Lander E.S., Mesirov J.P. Gene set enrichment analysis: a knowledge-based approach for interpreting genome-wide expression profiles. Proc. Natl. Acad. Sci. USA. 2005;102:15545–15550. doi: 10.1073/pnas.0506580102. [DOI] [PMC free article] [PubMed] [Google Scholar]
- Thomas L.R., Foshage A.M., Weissmiller A.M., Popay T.M., Grieb B.C., Qualls S.J., Ng V., Carboneau B., Lorey S., Eischen C.M., Tansey W.P. Interaction of MYC with host cell factor-1 is mediated by the evolutionarily conserved MYC box IV motif. Oncogene. 2016;35:3613–3618. doi: 10.1038/onc.2015.416. [DOI] [PMC free article] [PubMed] [Google Scholar]
- Valentijn L.J., Koster J., Haneveld F., Aissa R.A., van Sluis P., Broekmans M.E., Molenaar J.J., van Nes J., Versteeg R. Functional MYCN signature predicts outcome of neuroblastoma irrespective of MYCN amplification. Proc. Natl. Acad. Sci. USA. 2012;109:19190–19195. doi: 10.1073/pnas.1208215109. [DOI] [PMC free article] [PubMed] [Google Scholar]
- Van Bortle K., Nichols M.H., Li L., Ong C.T., Takenaka N., Qin Z.S., Corces V.G. Insulator function and topological domain border strength scale with architectural protein occupancy. Genome Biol. 2014;15:R82. doi: 10.1186/gb-2014-15-5-r82. [DOI] [PMC free article] [PubMed] [Google Scholar]
- Vietri Rudan M., Hadjur S. Genetic tailors: CTCF and cohesin shape the genome during evolution. Trends Genet. 2015;31:651–660. doi: 10.1016/j.tig.2015.09.004. [DOI] [PubMed] [Google Scholar]
- Walz S., Lorenzin F., Morton J., Wiese K.E., von Eyss B., Herold S., Rycak L., Dumay-Odelot H., Karim S., Bartkuhn M. Activation and repression by oncogenic MYC shape tumour-specific gene expression profiles. Nature. 2014;511:483–487. doi: 10.1038/nature13473. [DOI] [PMC free article] [PubMed] [Google Scholar]
- Welcker M., Orian A., Jin J., Grim J.E., Harper J.W., Eisenman R.N., Clurman B.E. The Fbw7 tumor suppressor regulates glycogen synthase kinase 3 phosphorylation-dependent c-MYC protein degradation. Proc. Natl. Acad. Sci. USA. 2004;101:9085–9090. doi: 10.1073/pnas.0402770101. [DOI] [PMC free article] [PubMed] [Google Scholar]
Associated Data
This section collects any data citations, data availability statements, or supplementary materials included in this article.