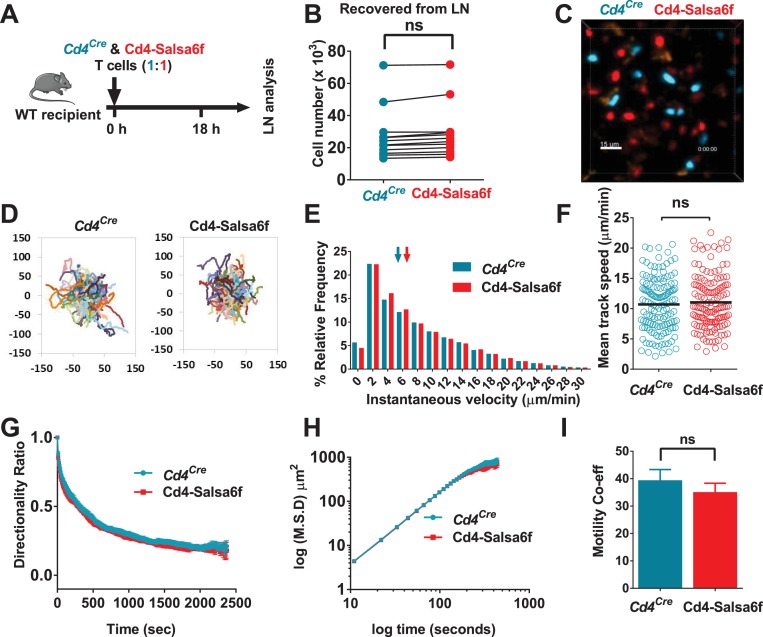
Figure 6. Motility of Salsa6f T cells in lymph node following adoptive transfer.
Cd4Cre and Cd4-Salsa6f (Hom) cells are shown in teal and in red, respectively. (A) Experimental design to characterize homing and motility of Cd4-Salsa6f cells. CTV-labeled Cd4Cre cells and CTY-labeled Cd4-Salsa6f cells (1:1) were adoptively transferred into wildtype mice, 18 hr prior to LN harvesting. (B) Paired numbers of CTV+ and CTY+ cells recovered from lymph nodes (p=0.65, Mann Whitney test). (C) Representative median filtered, maximum intensity projection image showing simultaneously imaged Cd4Cre and Cd4-Salsa6f cells the lymph node, scale bar = 30 µm. See Video 3. (D) Superimposed tracks with their origins normalized to the starting point. Cells were tracked for more than 20 min. n = 140. (E) Frequency distribution of instantaneous velocities; arrows indicate median, tick marks at the center of every other bin (n > 14,800, three independent experiments). (F) Scatter plot showing mean track speed, black bars indicate overall mean values (11.1 ± 0.4 and 10.7 ± 0.4 µm/min, for Cd4Cre and Cd4-Salsa6f cells respectively, p=0.69; n = 140). (G) Directionality ratio (displacement/distance) over elapsed time (tau = 461 s for Cd4Cre in teal; tau = 474 s for Cd4-Salsa6f in red. n = 217 time points). (H) MSD vs time, plotted on a log-log scale. (I) Measured motility coefficient from 140 tracks (35.1 ± 3.2 vs 39.4 ± 3.9 µm2/min for Cd4Cre and Cd4-Salsa6f cells, p=0.65).

