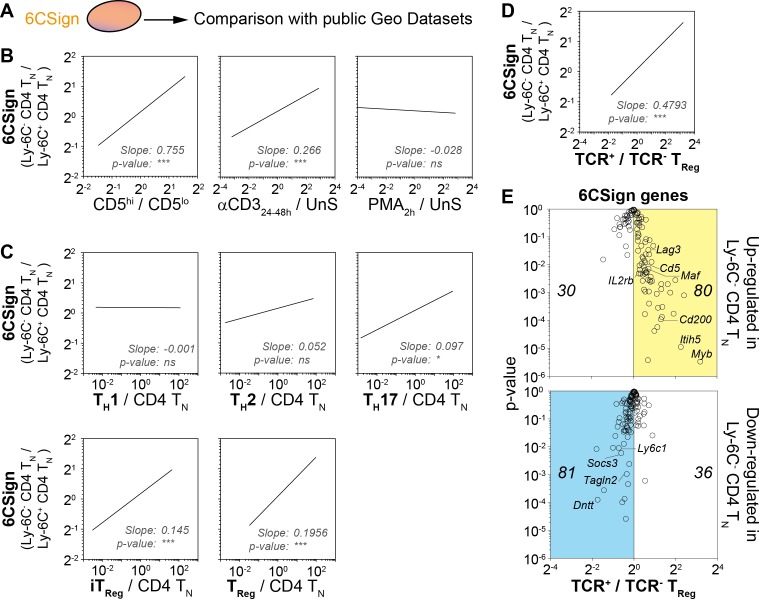
Figure 3. Transcriptomic signature of Ly-6C- CD4 TN cells reveals both their active TCR signaling and their bias toward iTreg-cell polarization.
(A–E) 6CSign was compared to several public Geo Datasets. (A) Diagram illustrating the analysis protocol. (B) Ratio vs ratio representation comparing gene expression ratio between Ly-6C- CD4 TN cells and Ly-6C+ CD4 TN cells (6CSign) with either CD5hivslo cell signature (Richards et al., 2015) (ratio of CD5hi CD4 TN cells to CD5lo CD4 TN cells, left panel), anti-CD3 activated CD4 TN-cell signature (Wakamatsu et al., 2013) (ratio of CD4 TN cells stimulated for 24–48 hr with anti-CD3 coated Ab to unstimulated CD4 TN cells, middle panel) and PMA-activated CD4 TN-cell signature (Bevington et al., 2016) (ratio of CD4 TN cells stimulated for 2 hr with PMA to unstimulated CD4 TN cells, right panel). (C) Ratio vs ratio representation comparing gene expression ratio between Ly-6C- CD4 TN cells and Ly-6C+ CD4 TN cells (6CSign) with in-vitro-induced TH1, TH2, TH17, iTreg and ex vivo purified Treg cell signatures that have been identified by Wei et al. (2009) (ratio of CD4 TH-cell subsets to CD4 TN cells). (D) Ratio vs ratio representation comparing gene expression ratio between Ly-6C- CD4 TN cells and Ly-6C+ CD4 TN cells (6CSign) with TCR-signaling-dependent CD4-Treg-specific signature (Vahl et al., 2014) (ratio between TCR+ Treg cells and TCR-ablated (TCR-) Treg cells). (B–D) Correlation analyses were performed using Pearson’s correlation test. (E) ‘Volcano plot’ representation (Log2 (ratio) versus Log10 (t-test p-value)) between TCR+ Treg cells and TCR-ablated (TCR-) Treg cells (Vahl et al., 2014), for 6CSign genes upregulated (upper panel) or downregulated (lower panel) in Ly-6C- CD4 TN cells. (B–E) Datasets were filtered to common probes between the two arrays.

