Figure 5. The calcium-calcineurin pathway shapes the phenotype of the CD4 TN-cell compartment in vivo.
(A) Flow-cytometry sorted Ly-6C+ CD4 TN cells from C57BL/6 Foxp3-GFP mice were cultured in IL-7 (10 ng/mL) alone or in the presence of either TG (4 nM), TG and Cyclosporin A (CsA; 50 nM) or TG and FK506 (FK; 200 nM). Flow-cytometry sorted Ly-6C- CD4 TN cells rested in IL-7 were used as control. After 5 days, cells were analyzed for their expression of Ly-6C, CD5, CD73, CD122, CD200 and Izumo1r. Representative contour-plots of cell surface markers are shown for gated CD4 TN cells (CD4+ TCRβ+ CD44lo CD25lo Foxp3-GFP-) as a function of culture condition. (B–F) C57BL/6 Foxp3-GFP mice were daily injected intraperitoneally with Prograf (FK506; 2.5 mg/kg) or diluent (PBS). Two weeks after treatment LNs (pooled pLNs and mLNs) and spleen were recovered and CD4 T cells were analyzed. (B) Diagram illustrating the experimental procedure. (C) Ly-6C and Izumo1r fluorescence histograms for gated CD4 TN cells (CD4+ TCRβ+ CD44lo CD25lo Foxp3-GFP-) recovered from LNs of PBS (white) and FK506 (grey) treated mice. (D) Percentage of Ly-6C+ cells among CD4 TN (CD4+ TCRβ+ CD44lo CD25lo Foxp3-GFP-) cells are shown for LNs and spleens of PBS (white) and FK506 (grey) treated mice. (E) Ly-6C Mean fluorescence intensities (MFIs), for gated Ly-6C+ CD4 TN (Ly-6C+ CD4+ TCRβ+ CD44lo CD25lo Foxp3-GFP-) cells recovered from LNs of PBS (white) and FK506 (grey) treated mice, are shown as means ± s.e.m. for two independent experiments with three mice per group. (F) Izumo1r and CD200 mean fluorescence intensities (MFIs), for gated Ly-6C+ CD4 TN (Ly-6C+ CD4+ TCRβ+ CD44lo CD25lo Foxp3-GFP-) cells recovered from LNs of PBS (white) and FK506 (grey) treated mice, are shown as means ± s.e.m. for a representative experiment with three mice per group. (G–I) 1 × 10⁶ flow-cytometry sorted Ly-6C- CD4 TN cells from CD45.1+ C57BL/6 Foxp3-GFP mice were adoptively transferred into sex-matched CD45.2+ C57BL/6 Foxp3-GFP recipient mice daily injected intraperitoneally with Prograf (FK506; 2.5 mg/kg) or diluent (PBS). Two weeks after transfer and treatment, LNs (pooled pLNs and mLNs) and spleen were recovered and donor-derived CD45.1+ CD4 T cells were analyzed. (G) Diagram illustrating the experimental model. (H) Absolute numbers of donor-derived CD4 TN (CD45.1+ CD45.2- CD4+ TCRβ+ CD44lo CD25lo Foxp3-GFP-) cells recovered from LNs and spleen of recipient mice are shown as means ± s.e.m. for two independent experiments with three mice per group. (I) Percentage of Ly-6C+ among donor-derived CD4 TN (CD45.1+ CD45.2- CD4+ TCRβ+ CD44lo CD25lo Foxp3-GFP-) cells recovered from LNs and spleen of recipient mice are shown as means ± s.e.m. for two independent experiments with three mice per group. (D, H, I) Each dot represents an individual mouse. (D-F; H, I) Significance of differences were assessed using a two-tailed unpaired Student’s t-test. Values of p<0.05 were considered as statistically significant (**p<0.01; ***p<0.001; ns, not significant).
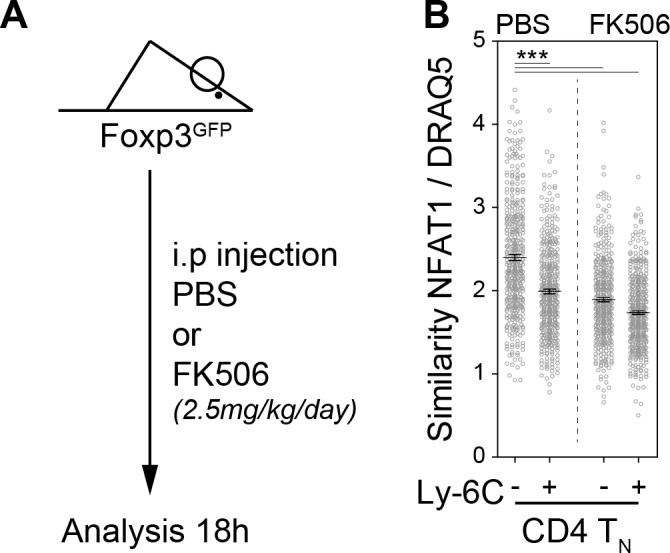
Figure 5—figure supplement 1. The calcium-calcineurin cascade drives NFAT nuclear translocation in CD4 TN cells in vivo.


