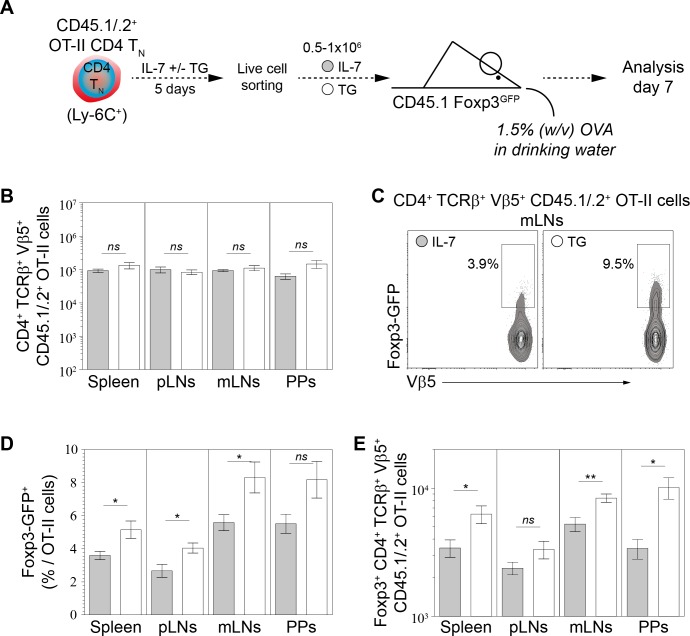
Figure 7. Calcium-mediated shaping of the CD4 TN-cell pTreg-cell differentiation potential in vivo.
Purified CD4 T cells from CD45.1/.2+ C57BL/6 Foxp3-GFP OT-II mice were cultured in IL-7 (10 ng/ml) with or without TG (4 nM). After 5 days live CD4 TN (CD44lo CD25lo CD8β- CD11b- CD11c- NK1.1- TCRγδ- Foxp3-GFP-) cells were flow-cytometry sorted and injected intravenously (0.5−1 × 10⁶ cells) into sex-matched CD45.1+ C57BL/6 Foxp3-GFP recipient mice fed with Ovalbumin (OVA; 1.5% w/v) in the drinking water. One week after transfer, peripheral and mesenteric LNs (pLNs and mLNs, respectively), Peyer’s Patches (PPs) and spleen were recovered separately and donor-derived CD4 T cells were analyzed. (A) Diagram illustrating the experimental model. (B) Absolute numbers of donor-derived OT-II CD4 T (CD45.1+ CD45.2+ CD4+ TCRβ+ Vβ5+) cells recovered from pLNs, mLNs, PPs and spleen of recipient mice are shown as means ± s.e.m. for three independent experiments with two or three mice per group. (C) Representative Foxp3/Vβ5 contour-plots and proportions of Foxp3-GFP+ cells for gated donor-derived OT-II CD4 T (CD45.1+ CD45.2+ CD4+ TCRβ+ Vβ5+) cells recovered from mLNs are shown. (D–E) Percentages (D) and absolute numbers (E) of Foxp3-GFP+ among donor-derived OT-II CD4 T (CD45.1+ CD45.2+ CD4+ TCRβ+ Vβ5+) cells recovered from pLNs, mLNs, PPs and spleen of recipient mice are shown as means ± s.e.m. for three independent experiments with two or three mice per group. (B, D, E) Significance of differences were assessed using a two-tailed unpaired Student’s t-test. Values of p<0.05 were considered as statistically significant (*p<0.05; ns, not significant). figure supplement legends.


