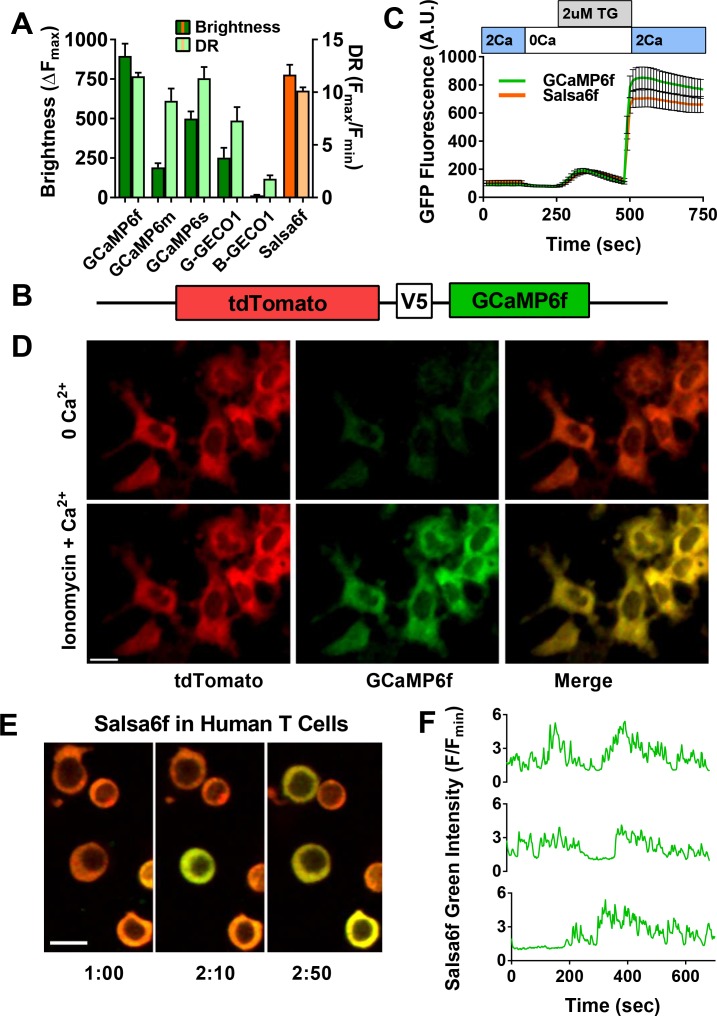
Figure 1. Design of novel tdTomato-V5-GCaMP6f fusion probe ‘Salsa6f’ and characterization in living cells.
(A) Several genetically encoded Ca2+ indicators were screened in vitro in HEK 293A cells, by co-transfecting with Orai1/STIM1 and measuring Ca2+ influx after thapsigargin-induced store depletion. Bars indicate maximum change in fluorescence intensity (dark) and dynamic range (DR: light) with Salsa6f shown in orange bars on right; n > 30 cells per probe, from two different transfections, error bars indicate SEM. (B) Diagram of Salsa6f construct used in transfection. (C) Averaged thapsigargin-induced Ca2+ entry, measured by change in green fluorescence, in GCaMP6f- (green, 11.5 ± 0.3, n = 63) or Salsa6f- (orange, 10.2 ± 0.3, n = 78) transfected HEK cells; data from two different transfections, error bars indicate SEM. (D) Two-photon images of Salsa6f co-transfected in HEK cells with Orai1/STIM1, showing red (tdTomato), green (GCaMP6f), and merged channels, at baseline in 0 mM extracellular Ca2+ (top) and after maximum stimulation with 2 µM ionomycin in 2 mM extracellular Ca2+ (bottom); scale bar = 20 µm; see Video 1; data are representative of at least three different experiments. (E) Confocal time lapse microscopy of human Cd4+ T cells previously transfected with Salsa6f and then activated for 2 days on plate-bound αCd3/28 antibodies; time = min:s, scale bar = 10 µm. (F) Representative traces of green fluorescence intensity from individual activated human T cells transfected with Salsa6f. Data are representative of at least three different experiments.

