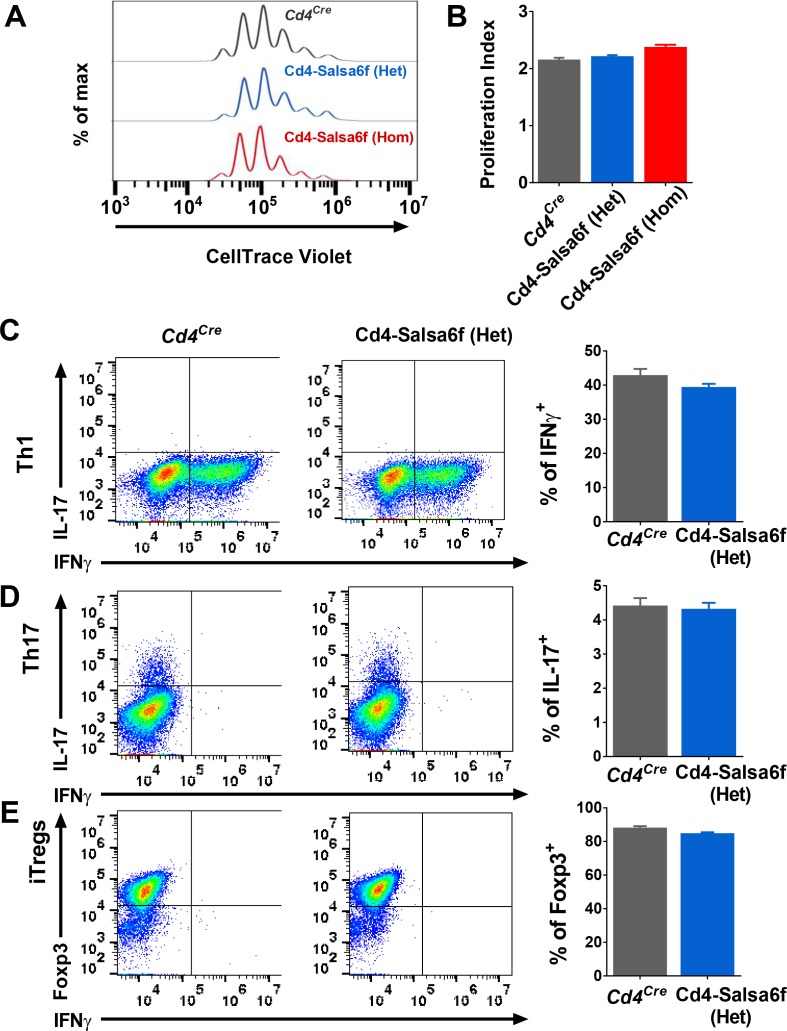
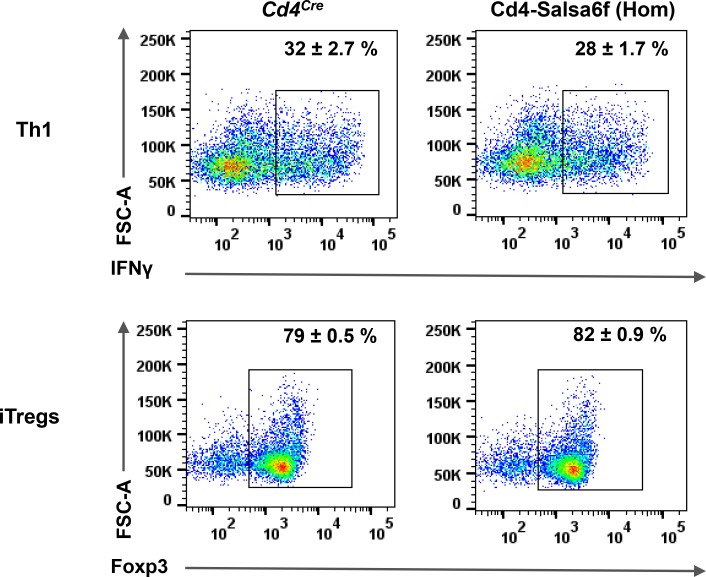
Figure 4. Functional responses of Cd4-Salsa6f T cells in vitro.
(A) Representative histogram showing cell trace violet (CTV) dilution in Cd4Cre (dark grey), Cd4-Salsa6f (Het) (blue), and Cd4-Salsa6f (Hom) (red) T cells at 72 hr following stimulation with αCd3/28 Dynabeads (1:1 ratio). (B) Proliferation index measured on CTV dilution curves (n = 8). (C–E) Dot plots showing differentiation of naive T cells from Cd4Cre and Cd4-Salsa6f (Het) mice into Th1 cells (C), Th17 cells (D) and iTregs (E) after 6 days (n = 4 mice). Right panels show average percentages of IFNγ+ cells (C), IL-17+ cells (D) and Foxp3+ cells (E).


