. 2017 Dec 14;6:e32417. doi: 10.7554/eLife.32417

Figure 9. Lymph nodes from Cd4-Salsa6f (Hom) mice exhibit cell-wide and subcellular Ca2+signals.

(A) Median filtered, maximum intensity projection of a red channel image from a single time point of an explanted lymph node from a Cd4-Salsa6f (Hom) mouse. (B) Green channel image corresponding to A). Orange arrowhead indicates cell-wide Ca2+ signal and gray arrowheads indicate smaller, local transient Ca2+ signals. (C, D) Enlargements of cell-wide (C) and local (D; gray arrowheads) Ca2+ signals. Note the lower fluorescence intensity in the center of the cell in C due to exclusion of Salsa6f from the nucleus. (E) Maximum intensity projection of 214 green channel time points (every 11.5 s over 41 min) showing hundreds of small local Ca2+ signals. Green channel image series was red channel subtracted and cropped from B. Asterisks indicate regions containing autofluorescent cells that have been cropped out. (F, G) Surface plot of maximum green channel intensity over two (F) and 50 (G) consecutive time points. Note the presence of four (F) and dozens (G) of small, discrete, high-intensity peaks of similar intensity. (H) Bar graph of relative frequencies of cell-wide and local Ca2+ signals. (I) Frequency distribution of the area of local Ca2+ signals. Scale bar in A is 100 µm (applies to B); scale bar in C is 10 µm (applies to D), scale bars in E and in F are 50 µm (applies to G). (J) Trace of fluorescence intensity over 25 min at the location of a transient subcellular Ca2+ signal (one time point every 5 s). (K) Trace of fluorescence intensity of a putative cell process from an autofluorescent cell drifting in the image field.

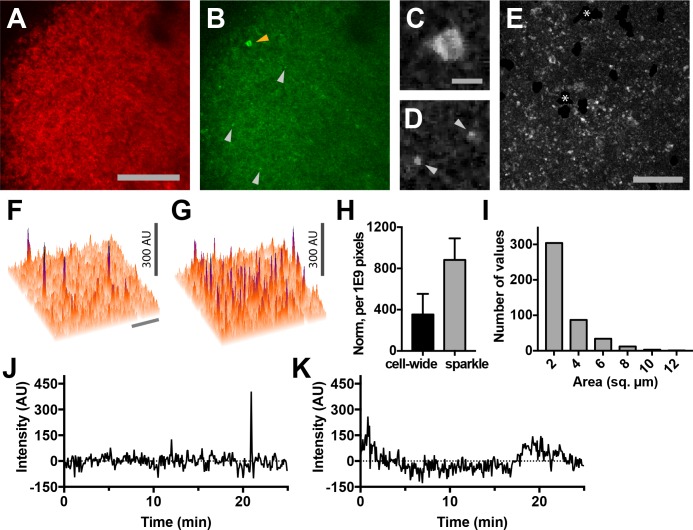
Figure 9.

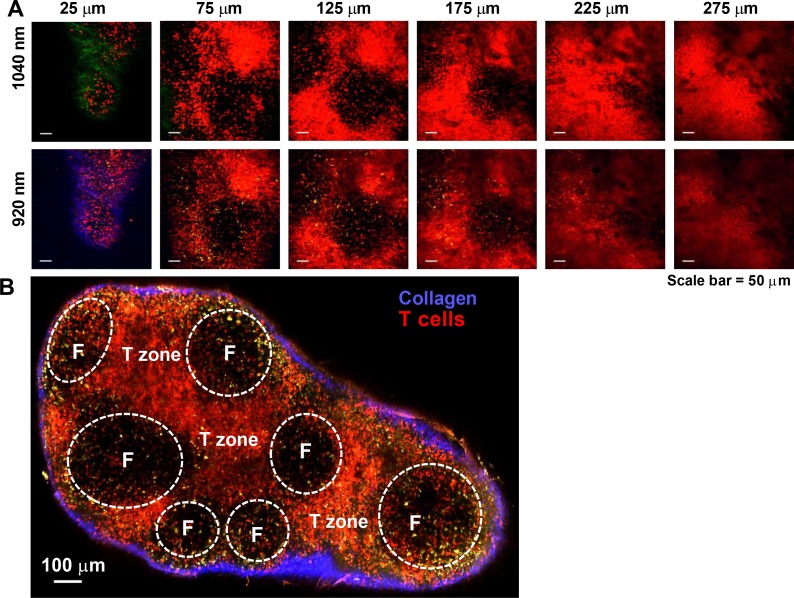
Figure 9—figure supplement 1. Imaging lymph nodes of Cd4-Salsa6f homozygous mice.

Figure 9—figure supplement 1.

Cre-mediated expression of Salsa6f in Cd4 T cells reveals endogenous T cell labeling in lymph node. (A) Two-photon images of explanted lymph node from Cd4-Salsa6f (Hom) mouse at various depths (indicated above each frame); 1040 nm femtosecond excitation (top row) or 920 nm excitation (bottom row). Second harmonic signal from collagen fibers is collected in green for 1040 nm excitation and in blue for 920 nm excitation. Salsa6f cells are readily detected up to 275 µm deep. (B) Montage image of a Cd4-Salsa6f (Hom) lymph node at 100 µm depth, imaged using 920 nm excitation showing Salsa6f+ cells in red, autofluorescent structures in yellow, and the capsular boundary shown in blue (second-harmonic signal). B cell follicles (F) are outlined. Scale bar = 100 µm.
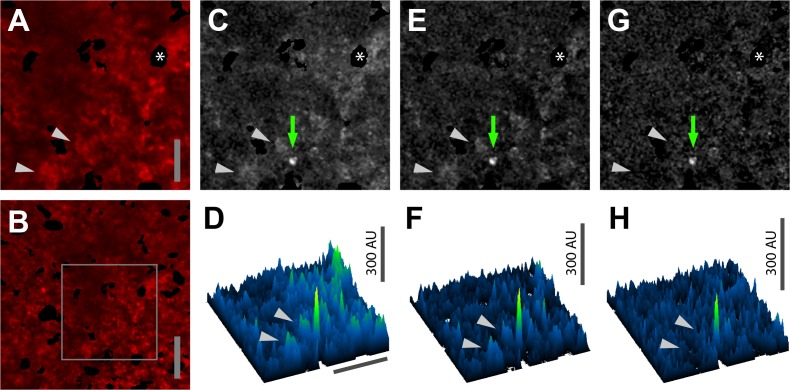
Figure 9—figure supplement 2. Subtraction of red channel fluorescence improves detection of Salsa6f Ca2+signals.

Figure 9—figure supplement 2.

(A, B) Median filtered, maximum intensity projection of a red channel image from a single time point of an explanted lymph node from a Cd4-Salsa6f (Hom) mouse. Panel A is enlarged and cropped from panel B (gray rectangle). (C, E, G) Green channel images corresponding to A with different image processing protocols. (C) Maximum intensity projection without further processing. (E) Maximum intensity projection after subtraction of the average of all green channel frames. (G) Maximum intensity projection after subtraction of the corresponding scaled red channel image and subtraction of the subsequent average from all green channel frames. Green arrows in C,E,G indicate a subcellular Ca2+ signal. (D, F, H) Surface plots corresponding to the images in C,E,G, respectively, showing the subcellular Ca2+ signal as a green peak. Gray arrowheads indicate nearby background cell fluorescence that is progressively removed by image processing. Asterisk indicates a region containing an autofluorescent cell that has been cropped out. Scale bar in A is 25 µm (applies to C,E,G); scale bar in B and the horizontal scale bar in D are 50 µm (applies to F,H).