

Abstract
Background
Although abnormalities of the QT interval are associated with atrial fibrillation (AF), it is unclear whether ventricular depolarization (QRS duration) or repolarization (JT interval) is a more important marker of AF risk.
Methods
This analysis included 4,181 (95% white; 59% women) participants from the Cardiovascular Health Study (CHS) who were free of baseline AF and major intraventricular delay. A linear scale was used to compute heart rate adjusted QT (QTa), QRS (QRS a), and JT (JT a) intervals. Prolonged QT a, QRS a, and JT a were defined by values greater than the sex‐specific 95th percentile for each measurement. AF events were ascertained during the annual study electrocardiograms and from hospitalization discharge data. Cox regression was used to compute hazard ratios (HR) and 95% confidence intervals (CI) for the associations of prolonged QT a, QRS a, and JT a with AF, separately.
Results
Over a mean follow‐up of 12.1 years, a total of 1,236 (30%) AF events were detected. An increased risk of AF (HR = 1.50. 95% CI = 1.20, 1.88) was observed with prolonged QT a. When we examined the association between individual components of the QT a interval and AF, the risk of AF was limited to prolonged JT a (HR = 1.31, 95% CI = 1.04, 1.65) and not prolonged QRS a (HR = 1.00, 95% CI = 0.77, 1.30). Similar results were obtained per 1‐SD increase in QT a (HR = 1.07, 95% CI = 1.01, 1.13), QRS a (HR = 0.99, 95% CI = 0.94, 1.06), and JT a (HR = 1.07, 95% CI = 1.01, 1.13).
Conclusions
The JT interval is a more important marker of AF risk in the QT interval among persons who do not have ventricular conduction delays.
Keywords: atrial fibrillation, QT interval, ventricular conduction
1. INTRODUCTION
Atrial fibrillation (AF) is the most common sustained arrhythmia in clinical practice and its prevalence is increasing due to growth in the aging population (Go et al., 2001). Due to the current and future burden that AF will place on the health care system, the identification of risk factors is of paramount importance for the appropriate implementation of preventive strategies.
Recent reports have demonstrated that abnormalities of the QT interval, a maker of ventricular depolarization and repolarization, are associated with AF (Mandyam et al., 2013; Nielsen et al., 2013; O'Neal et al., 2015). Since the QT interval includes components of ventricular depolarization (QRS duration) and repolarization (JT interval) (Yan, Lankipalli, Burke, Musco, & Kowey, 2003), it is likely that the relationship between the QT interval and AF is limited to repolarization. However, this hypothesis has not been explored. Therefore, the purpose of this study was to compare the association of QT interval components (QRS duration and JT interval) with AF in the Cardiovascular Health Study (CHS), a population‐based cohort study of the elderly.
2. METHODS
2.1. Study population
Details of CHS have been previously described (Fried et al., 1991). Briefly, CHS is a prospective population‐based cohort study of risk factors for coronary heart disease and stroke in individuals 65 years and older. A total of 5,888 participants with Medicare eligibility were recruited from four field centers located in the following locations in the United States: Forsyth County, NC; Sacramento County, CA; Washington County, MD; and Pittsburgh, PA. Subjects were followed with semi‐annual contacts, alternating between telephone calls and surveillance clinic visits. CHS clinic exams ended in June of 1999 and since that time two yearly phone calls to participants were used to identify events and collect data. The institutional review board at each site approved the study and written informed consent was obtained from participants at enrollment.
In this analysis, we compared the association of the individual components (e.g., QRS duration and JT interval) of the QT interval with incident AF. Participants were excluded if any of the following criteria were met: baseline AF was present; baseline covariate data were missing; or follow‐up data were missing. Additionally, participants with evidence of major intraventricular delay (QRS duration >120 ms and/or complete left or right bundle branch block) which artificially prolong the QT interval were excluded.
2.2. QT interval
Identical electrocardiographs (MAC PC, Marquette Electronics Inc., Milwaukee, WI) were used at all clinic sites, and resting, 10‐second standard simultaneous 12‐lead electrocardiograms (ECG) were recorded in all participants (Furberg et al., 1992). ECGs were automatically processed at a central ECG core lab (Epidemiological Cardiology Research Center, Wake Forest School of Medicine, Winston‐Salem, NC) using GE Marquette 12‐SL program (GE, Milwaukee, WI). ECG abnormalities were classified using the standards of the Minnesota code classification (Prineas, Crow, & Zhang, 2010).
Guided by current ECG interpretation recommendations, heart rate adjusted QT (QTa) was computed from baseline data using a linear regression model (Rautaharju et al., 2009). Specifically, the QT interval was regressed on heart rate (Soliman, Shah, Boerkircher, Li, & Rautaharju, 2014). Based on the β coefficient associated with heart rate, the following formula was derived to adjust for heart rate: QTa = QT + 2.07*(heart rate‐60). Similarly, heart rate adjusted QRS duration (QRSa = QRS + 0.14*(heart rate‐60)) and JT interval (JTa = JT + 1.93*(heart rate‐60)) were computed. Prolonged QTa, QRSa, JTa were defined by values greater than the sex‐specific 95th percentile for each measurement (QTa: men = 463 ms; women = 462 ms; QRSa: men = 112 ms; women = 104 ms; JTa: men = 368 ms; women = 375 ms).
2.3. Atrial fibrillation
In this analysis, AF events included paroxysmal, persistent, and permanent cases. Baseline AF cases were identified from the initial study ECG or by self‐reported history of a physician diagnosis. AF cases also were identified during the annual study ECGs that were performed annually until 1999. Additionally, hospitalization discharge data were used to identify AF events using International Classification of Diseases codes 427.31 and 427.32. Hospital diagnosis codes for AF ascertainment have been shown to have a positive predictive value of 98.6% (Alonso et al., 2009).
2.4. Covariates
Participant characteristics were collected during the initial CHS interview and questionnaire. Age, sex, race, income, education, and smoking status were self‐reported. Annual income was dichotomized at $25,000 and education was dichotomized at “high school or less.” Smoking was defined as current or ever smoker. Participants’ blood samples were obtained after a 12‐hr fast at the local field center. Measurements of total cholesterol, high‐density lipoprotein cholesterol, and plasma glucose were used in this analysis. Diabetes was defined as self‐reported history of a physician diagnosis, a fasting glucose value ≥126 mg/dL, or by the current use of insulin or oral hypoglycemic medications. Blood pressure was measured for each participant in the seated position and systolic measurements were used in this analysis. The use of aspirin and antihypertensive medications were self‐reported. Body mass index was computed as the weight in kilograms divided by the square of the height in meters. Baseline coronary heart disease was determined by self‐reported history or by medical record adjudication of the following diagnoses: myocardial infarction, angina pectoris without myocardial infarction, or coronary revascularization procedures (angioplasty and coronary artery bypass graft surgery) (Psaty et al., 1995). Baseline cases of stroke and heart failure were identified by self‐reported history of a physician diagnosis followed by review of medical records. Cardiovascular disease was the composite of coronary heart disease, stroke, and heart failure.
2.5. Statistical analysis
Categorical variables were reported as frequency and percentage while continuous variables were recorded as mean ± standard deviation. Statistical significance for categorical variables was tested using the chi‐square method and the student's t test for continuous variables. Baseline characteristics were compared by prolonged QTa and JTa, separately.
Follow‐up time was defined as the time from the initial study exam until one of the following: AF development, death, loss to follow‐up, or end of follow‐up. Cox regression was used to compute hazard ratios (HR) and 95% confidence intervals (CI) for the association between each QT interval component and AF. Multivariable models were constructed as follows: Model 1 adjusted for age, sex, race, education, and income; Model 2 adjusted for Model 1 covariates plus smoking, systolic blood pressure, diabetes, body mass index, total cholesterol, high‐density lipoprotein cholesterol, aspirin, antihypertensive medications, and cardiovascular disease. We also constructed a restricted cubic spline model to examine the graphical dose‐response relationships of QTa, QRSa, and JTa with AF at the 5th, 50th, and 95th percentiles, separately (Marrie, Dawson, & Garland, 2009).
Several sensitivity analyses were performed. We further adjusted for PR interval to determine if inclusion of this ECG characteristic influenced our findings. A separate analysis was performed for QRS duration without adjustment for heart rate. Additionally, to determine if our findings varied by age or sex, we computed interaction terms for QTa, QRSa, and JTa by these characteristics.
The proportional hazards assumption was not violated in our analysis. Statistical significance was defined as p < .05. SAS Version 9.4 (Cary, NC) was used for all analyses.
3. RESULTS
A total of 4,181 (95% white; 59% women) participants were included in the final analysis. The mean durations for QTa, QRSa, and JTa were 425 ± 21 ms, 90 ± 10 ms, and 335 ± 22 ms, respectively. Baseline characteristics stratified by incident AF are shown in Table 1. Additionally, baseline characteristics stratified by prolonged QTa and JTa are shown in Table S1.
Table 1.
Baseline characteristics by incident atrial fibrillation (N = 4,181)
| Characteristic | Incident atrial fibrillation | p‐valuea | |
|---|---|---|---|
| Yes (n = 1,236) | No (n = 2,945) | ||
| Age, years | |||
| 65–70 (%) | 521 (42) | 1,358 (46) | |
| 71–74 (%) | 294 (24) | 680 (23) | |
| 75–80 (%) | 294 (24) | 640 (22) | |
| >80 (%) | 127 (10) | 267 (9) | .11 |
| Male (%) | 561 (45) | 1,137 (39) | <.001 |
| Black (%) | 38 (3) | 163 (6) | <.001 |
| Education, high school or less (%) | 716 (58) | 1,665 (57) | .41 |
| Income, <$25,000 (%) | 780 (63) | 1,823 (62) | .46 |
| Ever smoker (%) | 665 (54) | 1,576 (54) | .86 |
| Diabetes (%) | 196 (16) | 390 (13) | .026 |
| Systolic blood pressure, mean ± SD, mm Hg | 140 ± 21 | 138 ± 19 | <.001 |
| Body mass index, mean ± SD, kg/m2 | 26 ± 4.0 | 26 ± 4.0 | .066 |
| HDL cholesterol, mean ± SD, mg/dL | 53 ± 15 | 55 ± 16 | .0036 |
| Total cholesterol, mean ± SD, mg/dL | 211 ± 38 | 214 ± 39 | .013 |
| Antihypertensive medication use (%) | 599 (48) | 1,196 (41) | <.001 |
| Aspirin use (%) | 429 (35) | 956 (32) | .16 |
| Cardiovascular disease (%) | 307 (25) | 532 (18) | <.001 |
| QTa duration,b mean ± SD, ms | 426 ± 22 | 424 ± 21 | .018 |
| QRSa duration,c mean ± SD, ms | 90 ± 11 | 89 ± 10 | .079 |
| JTa duration,d mean ± SD, ms | 336 ± 22 | 335 ± 22 | .15 |
HDL, high‐density lipoprotein; SD, standard deviation.
Statistical significance for continuous data was tested using the student's t‐test and categorical data was tested using the chi‐square method.
QTa was computed with the following formula: QT + 2.07*(heart rate‐60).
QRSa was computed with the following formula: QRS + 0.14*(heart rate‐60).
JTa was computed with the following formula: JT + 1.93*(heart rate‐60).
Over a mean follow‐up of 12.3 years, a total of 1,236 (30%) AF events were detected. An increased risk of AF (HR = 1.50. 95% CI = 1.20, 1.88) was observed with prolonged QTa (Table 2). When we examined the association between individual components of the QTa interval and AF, the risk of AF was limited to prolonged JTa (HR = 1.31, 95% CI = 1.04, 1.65), and not prolonged QRSa (HR = 1.00, 95% CI = 0.77, 1.30). Similar results were obtained per 1‐SD increase in QTa, QRSa, and JTa.
Table 2.
Risk of atrial fibrillation (N = 4,181)
| Events/No at risk | Model 1aHR (95%CI) | p‐value | Model 2bHR (95%CI) | p‐value | |
|---|---|---|---|---|---|
| QTa c | |||||
| Not prolonged | 1,154/3,970 | Ref | – | Ref | – |
| Prolonged | 82/211 | 1.60 (1.28, 2.01) | <.001 | 1.50 (1.20, 1.88) | <.001 |
| Per 1‐SD | 1,236/4,181 | 1.11 (1.05, 1.17) | <.001 | 1.07 (1.01, 1.13) | .029 |
| QRSa d | |||||
| Not prolonged | 1,176/3,967 | Ref | ‐ | Ref | ‐ |
| Prolonged | 60/214 | 1.11 (0.86, 1.45) | .42 | 1.00 (0.77, 1.30) | .99 |
| Per 1‐SD | 1,236/4,181 | 1.04 (0.98, 1.11) | .21 | 0.99 (0.94, 1.06) | .91 |
| JTa e | |||||
| Not prolonged | 1,158/3,966 | Ref | – | Ref | – |
| Prolonged | 78/215 | 1.39 (1.10, 1.75) | .0054 | 1.31 (1.04, 1.65) | .020 |
| Per 1‐SD | 1,236/4,181 | 1.09 (1.03, 1.16) | .0027 | 1.07 (1.01, 1.13) | .030 |
CI, confidence interval; HR, hazard ratio.
Adjusted for age, sex, race, education, and income.
Adjusted for Model 1 covariates plus smoking, systolic blood pressure, diabetes, body mass index, total cholesterol, high‐density lipoprotein cholesterol, aspirin, antihypertensive medications, and cardiovascular disease.
QTa was computed with the following formula: QT + 2.07*(heart rate‐60).
QRSa was computed with the following formula: QRS + 0.14*(heart rate‐60).
JTa was computed with the following formula: JT + 1.93*(heart rate‐60).
Figures 1, 2, and 3 show the associations of QTa, QRSa, and JTa values with incident AF using a restricted cubic spline model, respectively. As shown, the risk for AF was greater with increasing QTa and JTa values. The association between QRSa and incident AF was not shown to increase across QRSa values.
Figure 1.
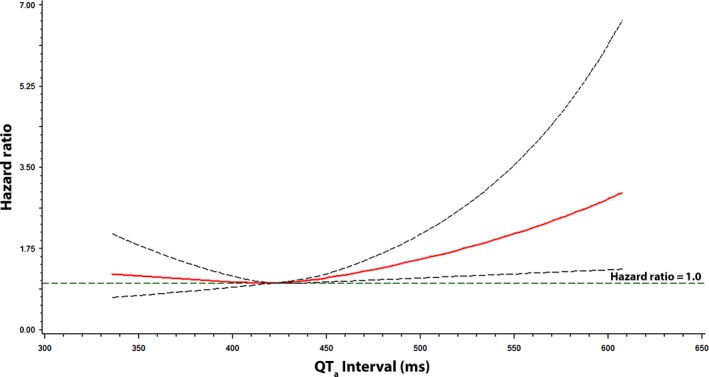
Risk of atrial fibrillation across QT a Interval. Each hazard ratio was computed with the median QT a value of 422 ms as the reference and was adjusted for age, sex, race, education, income, smoking, systolic blood pressure, diabetes, body mass index, total cholesterol, high‐density lipoprotein cholesterol, aspirin, antihypertensive medications, and cardiovascular disease. Dotted lines denote the 95% confidence limits. QT a was computed with the following formula: QT + 2.07*(heart rate‐60)
Figure 2.
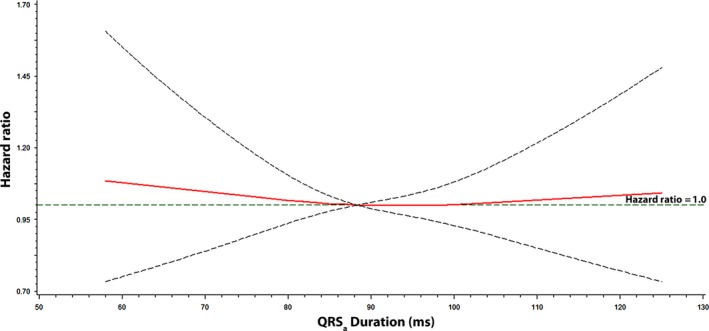
Risk of atrial fibrillation across QRS a Interval. Each hazard ratio was computed with the median QRS a value of 88 ms as the reference and was adjusted for age, sex, race, education, income, smoking, systolic blood pressure, diabetes, body mass index, total cholesterol, high‐density lipoprotein cholesterol, aspirin, antihypertensive medications, and cardiovascular disease. Dotted lines denote the 95% confidence limits. QRS a was computed with the following formula: QRS + 0.14*(heart rate‐60)
Figure 3.
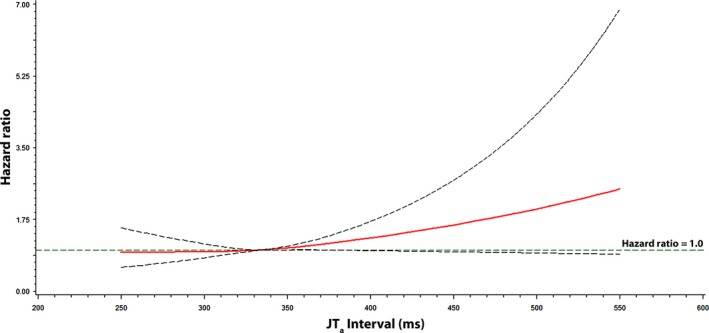
Risk of atrial fibrillation across JT a Interval. Each hazard ratio was computed with the median JT a value of 334 ms as the reference and was adjusted for age, sex, race, education, income, smoking, systolic blood pressure, diabetes, body mass index, total cholesterol, high‐density lipoprotein cholesterol, aspirin, antihypertensive medications, and cardiovascular disease. Dotted lines denote the 95% confidence limits. JT a was computed with the following formula: JT + 1.93*(heart rate‐60)
When we included PR interval in the multivariable model the results were not materially different from the findings of the main analysis (Table S2). Similarly, when we examined the association between QRS and AF without adjustment for heart rate, we did not observe an association of QRS duration (QRS per 1‐SD increase: HR = 0.99, 95% CI = 0.93, 1.06) with AF. Additionally, our findings did not vary by age (QTa: p‐interaction = .81; QRSa: p‐interaction = .33; JTa: p‐interaction = .97) or sex (QTa: p‐interaction = .78; QRSa: p‐interaction = .085; JTa: p‐interaction = .30).
4. DISCUSSION
In this study from CHS, we have shown that prolongation of the QT interval is associated with AF development, and identified the JT interval as the more important marker of AF risk. This suggests that ventricular repolarization is more predictive of future AF events than ventricular depolarization (e.g., QRS duration). The findings of this analysis provide important insight into the pathophysiology of AF, as prior reports have largely focused on the AF risk associated with the entire QT interval which includes components of both ventricular depolarization and repolarization.
Several reports have demonstrated that QT interval prolongation predicts incident AF. An analysis from the Atherosclerosis Risk In Communities study showed that prolonged QT increases the risk of AF development (Mandyam et al., 2013). The same study validated these findings in CHS and the Health, Aging, and Body Composition study (Mandyam et al., 2013). An examination of 281,277 subjects from the Copenhagen ECG study also found that prolongation of the QT interval was associated with incident AF (Nielsen et al., 2013). Additionally, data from the Multi‐Ethnic Study of Atherosclerosis showed that prolonged QT interval was associated with AF in a racially/ethnically diverse population (O'Neal et al., 2015).
To the best of our knowledge, previous studies have not examined the association between individual components of the QT interval and AF. The findings of the current analysis specify the JT interval, rather than the QRS interval, as the more important marker of AF risk, suggesting that abnormalities in ventricular repolarization increase the likelihood of AF occurrence. Although the JT interval is commonly used to assess for ventricular repolarization abnormalities in the presence of ventricular conduction delays, our data suggest that the AF risk associated with ventricular repolarization must account for ventricular depolarization. We excluded participants with evidence of baseline major intraventricular delay (QRS duration >120 ms) in an attempt to remove the influence of ventricular conduction abnormalities, but it is possible that prolongation of QRS duration is predictive of AF with values greater than 120 ms. Increases in QRS duration are predictive of incident heart failure (Ilkhanoff et al., 2012; Zhang et al., 2013, 2015), and due to the association between heart failure and AF (O'Neal, Qureshi, Zhang, & Soliman, 2016), it is possible that prolonged QRS predicts AF in the appropriate population (e.g., ventricular conduction delay). However, our data suggest that among persons who do not have evidence of ventricular conduction delays, the JT interval is the preferred ventricular repolarization marker of AF risk.
The mechanistic link between abnormal ventricular repolarization and AF is unclear. An increased prevalence of AF has been observed among patients with congenital long QT syndrome (Johnson et al., 2008). This has been explained by alterations in atrial refractory periods that predispose to AF in those who have prolonged QT (Kirchhof et al., 2003; Satoh & Zipes, 1998). Another explanation is related to the activity of the late sodium current, as increased late entry of sodium into cardiomyocytes has been observed in persons with long QT syndrome (Lowe et al., 2012), and a similar mechanism explains delayed after depolarizations and arrhythmia susceptibility in atrial myocytes (Song, Shryock, & Belardinelli, 2008). A similar phenomenon has been described with calcium channels (Voigt et al., 2012). Other explanations possibly are related to the development of heart failure, as prolonged QT is associated with its development (Rautaharju et al., 2007). Heart failure is associated with delayed atrial refractory periods that possibly explain the increased risk of AF in this population (Sanders et al., 2003). Although we offer several explanations further research is needed to clarify the link between ventricular repolarization and AF.
The current analysis should be interpreted in the context of several limitations. Several baseline characteristics were ascertained by self‐reported history and subjected our analyses to misclassification bias. Similarly, it is possible that some cases of AF were missed due to the time‐dependent nature of various types of the arrhythmia. Furthermore, although we included several covariates in our multivariable models that likely influenced the development of AF, we acknowledge that residual confounding is possible.
The findings of this analysis provide important insight into the pathophysiology of AF and suggest that the JT interval, a marker of ventricular repolarization that is not influenced by depolarization, is the more important marker of AF risk in the QT interval. Future studies that explore the relationship between the QT interval and AF should account for ventricular depolarization to remove the possible influence of ventricular conduction defects.
CONFLICT OF INTEREST
None.
Supporting information
ACKNOWLEDGMENTS
This manuscript was prepared using Cardiovascular Health Study Research Materials obtained from the National Heart, Lung, and Blood Institute Biologic Specimen and Data Repository Information Coordinating Center and does not necessarily reflect the opinions or views of the Cardiovascular Health Study or the National Heart, Lung, and Blood Institute.
Patel N, O'Neal WT, Whalen SP, Soliman EZ. The association of QT interval components with atrial fibrillation. Ann Noninvasive Electrocardiol. 2018;23:e12467 10.1111/anec.12467
Funding Information
Research reported in this publication was supported by the National Heart, Lung, And Blood Institute of the National Institutes of Health under Award Number F32HL134290. The content is solely the responsibility of the authors and does not necessarily represent the official views of the National Institutes of Health or the National Heart, Lung, and Blood Institute.
REFERENCES
- Alonso, A. , Agarwal, S. K. , Soliman, E. Z. , Ambrose, M. , Chamberlain, A. M. , Prineas, R. J. , Folsom, A. R. (2009). Incidence of atrial fibrillation in whites and African‐Americans: the Atherosclerosis Risk in Communities (ARIC) study. Am Heart J, 158, 111–117. [DOI] [PMC free article] [PubMed] [Google Scholar]
- Fried, L. P. , Borhani, N. O. , Enright, P. , Furberg, C. D. , Gardin, J. M. , Kronmal, R. A. , … Newman, A. (1991). The cardiovascular health study: Design and rationale. Annals of Epidemiology, 1, 263–276. [DOI] [PubMed] [Google Scholar]
- Furberg, C. D. , Manolio, T. A. , Psaty, B. M. , Bild, D. E. , Borhani, N. O. , Newman, A. , … Rautaharju, P. M. (1992). Major electrocardiographic abnormalities in persons aged 65 years and older (the Cardiovascular Health Study). Cardiovascular Health Study Collaborative Research Group. American Journal of Cardiology, 69, 1329–1335. [DOI] [PubMed] [Google Scholar]
- Go, A. S. , Hylek, E. M. , Phillips, K. A. , Chang, Y. , Henault, L. E. , Selby, J. V. , & Singer, D. E. (2001). Prevalence of diagnosed atrial fibrillation in adults: National implications for rhythm management and stroke prevention: The AnTicoagulation and Risk Factors in Atrial Fibrillation (ATRIA) Study. JAMA, 285, 2370–2375. [DOI] [PubMed] [Google Scholar]
- Ilkhanoff, L. , Liu, K. , Ning, H. , Nazarian, S. , Bluemke, D. A. , Soliman, E. Z. , & Lloyd‐Jones, D. M. (2012). Association of QRS duration with left ventricular structure and function and risk of heart failure in middle‐aged and older adults: The Multi‐Ethnic Study of Atherosclerosis (MESA). European Journal of Heart Failure, 14, 1285–1292. [DOI] [PMC free article] [PubMed] [Google Scholar]
- Johnson, J. N. , Tester, D. J. , Perry, J. , Salisbury, B. A. , Reed, C. R. , & Ackerman, M. J. (2008). Prevalence of early‐onset atrial fibrillation in congenital long QT syndrome. Heart Rhythm: The Official Journal of the Heart Rhythm Society, 5, 704–709. [DOI] [PMC free article] [PubMed] [Google Scholar]
- Kirchhof, P. , Eckardt, L. , Franz, M. R. , Monnig, G. , Loh, P. , Wedekind, H. , … Haverkamp, W. (2003). Prolonged atrial action potential durations and polymorphic atrial tachyarrhythmias in patients with long QT syndrome. Journal of Cardiovascular Electrophysiology, 14, 1027–1033. [DOI] [PubMed] [Google Scholar]
- Lowe, J. S. , Stroud, D. M. , Yang, T. , Hall, L. , Atack, T. C. , & Roden, D. M. (2012). Increased late sodium current contributes to long QT‐related arrhythmia susceptibility in female mice. Cardiovascular Research, 95, 300–307. [DOI] [PMC free article] [PubMed] [Google Scholar]
- Mandyam, M. C. , Soliman, E. Z. , Alonso, A. , Dewland, T. A. , Heckbert, S. R. , Vittinghoff, E. , … Marcus, G. M. (2013). The QT interval and risk of incident atrial fibrillation. Heart Rhythm: The Official Journal of the Heart Rhythm Society, 10, 1562–1568. [DOI] [PMC free article] [PubMed] [Google Scholar]
- Marrie, R. A. , Dawson, N. V. , & Garland, A. (2009). Quantile regression and restricted cubic splines are useful for exploring relationships between continuous variables. Journal of Clinical Epidemiology, 62, 511–517. [DOI] [PubMed] [Google Scholar]
- Nielsen, J. B. , Graff, C. , Pietersen, A. , Lind, B. , Struijk, J. J. , Olesen, M. S. , … Holst, A. G. (2013). J‐shaped association between QTc interval duration and the risk of atrial fibrillation: Results from the copenhagen ECG study. Journal of the American College of Cardiology, 61, 2557–2564. [DOI] [PubMed] [Google Scholar]
- O'Neal, W. T. , Efird, J. T. , Kamel, H. , Nazarian, S. , Alonso, A. , Heckbert, S. R. , … Soliman, E. Z. (2015). The association of the QT interval with atrial fibrillation and stroke: The Multi‐Ethnic Study of Atherosclerosis. Clinical Research in Cardiology, 104, 743–750. [DOI] [PMC free article] [PubMed] [Google Scholar]
- O'Neal, W. T. , Qureshi, W. , Zhang, Z. M. , & Soliman, E. Z. (2016). Bidirectional association between atrial fibrillation and congestive heart failure in the elderly. Journla of Cardiovascular Medicine, 17, 181–186. [DOI] [PubMed] [Google Scholar]
- Prineas, R. J. , Crow, R. S. , & Zhang, Z. M . (2010). The Minnesota code manual of electrocardiographic findings: Standards and procedures for measurement and classification. London: Springer. xiii, 328 p. [Google Scholar]
- Psaty, B. M. , Kuller, L. H. , Bild, D. , Burke, G. L. , Kittner, S. J. , Mittelmark, M. , … Robbins, J. (1995). Methods of assessing prevalent cardiovascular disease in the Cardiovascular Health Study. Annals of Epidemiology, 5, 270–277. [DOI] [PubMed] [Google Scholar]
- Rautaharju, P. M. , Prineas, R. J. , Wood, J. , Zhang, Z. M. , Crow, R. , & Heiss, G. (2007). Electrocardiographic predictors of new‐onset heart failure in men and in women free of coronary heart disease (from the Atherosclerosis in Communities [ARIC] Study). American Journal of Cardiology, 100, 1437–1441. [DOI] [PubMed] [Google Scholar]
- Rautaharju, P. M. , Surawicz, B. , Gettes, L. S. , Bailey, J. J. , Childers, R. , Deal, B. J. , … Wellens, H . (2009). American Heart Association E, Arrhythmias Committee CoCC, American College of Cardiology F, Heart Rhythm S. AHA/ACCF/HRS recommendations for the standardization and interpretation of the electrocardiogram: Part IV: The ST segment, T and U waves, and the QT interval: A scientific statement from the American Heart Association Electrocardiography and Arrhythmias Committee, Council on Clinical Cardiology; the American College of Cardiology Foundation; and the Heart Rhythm Society. Endorsed by the International Society for Computerized Electrocardiology. Journal of the American College of Cardiology, 53, 982–991. [DOI] [PubMed] [Google Scholar]
- Sanders, P. , Morton, J. B. , Davidson, N. C. , Spence, S. J. , Vohra, J. K. , Sparks, P. B. , & Kalman, J. M. (2003). Electrical remodeling of the atria in congestive heart failure: Electrophysiological and electroanatomic mapping in humans. Circulation, 108, 1461–1468. [DOI] [PubMed] [Google Scholar]
- Satoh, T. , & Zipes, D. P. (1998). Cesium‐induced atrial tachycardia degenerating into atrial fibrillation in dogs: Atrial torsades de pointes? Journal of Cardiovascular Electrophysiology, 9, 970–975. [DOI] [PubMed] [Google Scholar]
- Soliman, E. Z. , Shah, A. J. , Boerkircher, A. , Li, Y. , & Rautaharju, P. M. (2014). Inter‐relationship between electrocardiographic left ventricular hypertrophy and QT prolongation as predictors of increased risk of mortality in the general population. Circulation. Arrhythmia and Electrophysiology, 7, 400–406. [DOI] [PMC free article] [PubMed] [Google Scholar]
- Song, Y. , Shryock, J. C. , & Belardinelli, L. (2008). An increase of late sodium current induces delayed afterdepolarizations and sustained triggered activity in atrial myocytes. American Journal of Physiology. Heart and Circulatory Physiology, 294, H2031–H2039. [DOI] [PubMed] [Google Scholar]
- Voigt, N. , Li, N. , Wang, Q. , Wang, W. , Trafford, A. W. , Abu‐Taha, I. , … Dobrev, D. (2012). Enhanced sarcoplasmic reticulum Ca2 + leak and increased Na+‐Ca2 + exchanger function underlie delayed afterdepolarizations in patients with chronic atrial fibrillation. Circulation, 125, 2059–2070. [DOI] [PMC free article] [PubMed] [Google Scholar]
- Yan, G. X. , Lankipalli, R. S. , Burke, J. F. , Musco, S. , & Kowey, P. R. (2003). Ventricular repolarization components on the electrocardiogram: Cellular basis and clinical significance. Journal of the American College of Cardiology, 42, 401–409. [DOI] [PubMed] [Google Scholar]
- Zhang, Z. M. , Rautaharju, P. M. , Prineas, R. J. , Loehr, L. , Rosamond, W. , & Soliman, E. Z. (2015). Ventricular conduction defects and the risk of incident heart failure in the atherosclerosis risk in communities (ARIC) Study. Journal of Cardiac Failure, 21, 307–312. [DOI] [PMC free article] [PubMed] [Google Scholar]
- Zhang, Z. M. , Rautaharju, P. M. , Soliman, E. Z. , Manson, J. E. , Martin, L. W. , Perez, M. , … Prineas, R. J. (2013). Different patterns of bundle‐branch blocks and the risk of incident heart failure in the Women's Health Initiative (WHI) study. Circulation: Heart Failure, 6, 655–661. [DOI] [PMC free article] [PubMed] [Google Scholar]
Associated Data
This section collects any data citations, data availability statements, or supplementary materials included in this article.
Supplementary Materials