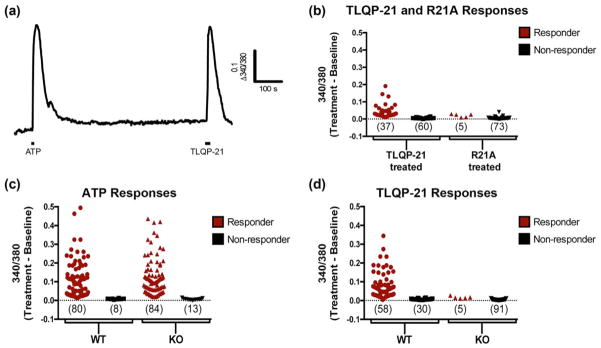
FIGURE 8.
TLQP-21 activates C3aR1 in cultured primary microglia. (a) Representative ratiometric (Δ340/380 nm) traces of ATP (100 μM) and TLQP-21 (10 μM)-evoked Ca2+ transients in microglial cells isolated from P1–3 neonatal brain from wild-type (WT) mice. (b) Scatter plot of peak response amplitudes to TLQP-21 and R21A in wild-type cultures demonstrates that the proportions of TLQP-21 and R21A responders and nonresponders are significantly different (p < .0001, Fisher’s exact test). (c) Scatter plot of peak response amplitudes to ATP in cultures from WT and C3aR1 KO mice shows that the proportions of ATP responders and nonresponders in WT and KO cultures are not significantly different. (d) Scatter plot of peak response amplitudes to TLQP-21 in cultures from C3aR1 KO and WT mice shows that the proportions of TLQP-21 responders and nonresponders in WT and KO cultures are significantly different (p < .0001, Fisher’s exact test). Each symbol in b–d represents a cell [Color figure can be viewed at wileyonlinelibrary.com]

