

Abstract
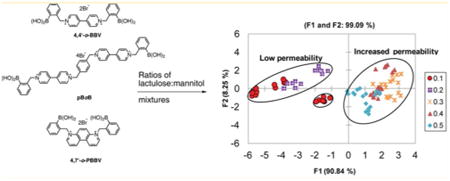
With the aim of discerning between different sugar and sugar alcohols of biomedical relevance, such as gut permeability, arrays of 2-component probes were assembled with up to six boronic acid-appended viologens (BBVs): 4,4′-o-BBV, 3,3′-o-BBV, 3,4′-o-BBV, 4,4′-o,m-BBV, 4,7′-o-PBBV, and pBoB, each coupled to the fluorophore 8-hydroxypyrene, 1,3,6-trisulfonic acid trisodium salt (HPTS). These probes were screened for their ability to discriminate between lactulose, l-rhamnose, 3-O-methyl-d-glucose, and xylose. Binding studies of sugar alcohols mannitol, sorbitol, erythritol, adonitol, arabitol, galactitol, and xylitol revealed that diols containing threo-1,2-diol units have higher affinity for BBVs relative diols containing erythro-1,2 units. Those containing both threo-1,2- and 1,3-syn diol motifs showed high affinity for boronic acid binding. Fluorescence from the arrays were examined by principle component analysis (PCA) and linear discriminant analysis (LDA). Arrays with only three BBVs sufficed to discriminate between sugars (e.g., lactulose) and sugar alcohols (e.g., mannitol), establishing a differential probe. Compared with 4,4′-o-BBV, 2-fold reductions in lower limits of detection (LOD) and quantification (LOQ) were achieved for lactulose with 4,7-o-PBBV (LOD 41 μM, LOQ 72 μM). Using a combination of 4,4′-o-BBV, 4,7-o-PBBV, and pBoB, LDA statistically segregated lactulose/mannitol (L/M) ratios from 0.1 to 0.5, consistent with values encountered in small intestinal permeability tests. Another triad containing 3,3′-o-BBV, 4,4′-o-BBV, and 4,7-o-PBBV also discerned similar L/M ratios. This proof-of-concept demonstrates the potential for BBV arrays as an attractive alternate to HPLC to analyze mixtures of sugars and sugar alcohols in biomedical applications and sheds light on structural motifs that make this possible.
Graphical abstract
Measurement of sugars and sugar alcohols in biological fluids is increasingly important in clinical practice and research. For example, assessment of in vivo gastrointestinal (GI) permeability uses oral ingestion and subsequent analysis of combinations of sugar and sugar alcohol markers in urine. Performing GI permeability assessment provides an alternative approach to screening for malnutrition and several gastrointestinal diseases.1 For example, it has been used to detect mucosal damage in humans and animals in studies connected with inflammatory bowel disease (IBD),2,3 celiac disease,4 and type 1 diabetes.5 Classically, small intestinal GI permeability is quantified by measuring urinary excretion of orally administered lactulose and mannitol by high-pressure liquid chromatography (HPLC) analysis in combination with an evaporative light scatter detector or mass spectrometry.6 Although sensitive, the labor-intensive nature of these methods and cost per analysis hinder the use of this method in large scale studies that require analysis of multiple samples per day. For permeability testing to advance to routine use, more rapid and cost-effective analyses of sugars and sugar alcohols in biological buffers, urine, and blood are desirable and would facilitate other lines of biomedical research where sugars and sugar alcohols need to be measured.
Boronic acid-based methods have been developed for sensing glucose in biological fluids7 as well as for other assays for a variety of sugars.8 Saccharide recognition by boronic acid derivatives has grown into a major field, taking advantage of the intrinsic affinity of boronic acids for 1,2-cis and/or 1,3-cis diols.9,10 Largely in relation to diabetes, development of fluorescent-based glucose sensors has been the focus of much of this research. However, there is a renewed interest in measuring other sugars in biological fluids, such as in blood serum and urine.10–12 For biomedical applications, these boronic acid-based sensors must operate in aqueous media at physiological pH around 7.4 and be free from endogenous fluorescence interference. We previously developed a two-component system that has been extensively studied for measuring glucose continuously in flowing blood.13
Multiwell based arrays can provide an inexpensive and rapid analytical tool that can play a central role in high-throughput analysis in clinical settings. Development of these arrays can allow analysis of complex mixtures by utilizing cross-reactive and semiselective indicators or receptors where responses are analyzed as a whole by pattern recognition algorithms. Boronic acid containing arrays have been used to discriminate saccharides and derivatives, allowing pattern based sensing. This recognition is similar to the way that human olfactory and gustatory systems work.14 Several strategies for arrays have been developed that utilize photoinduced electron transfer,15 indicator displacement assay (IDA),16,17 or colorimetric pH response induced by boronic ester formation.18 Indicator displacement assays that use fluorescence for quantification have proven useful for discriminating saccharides in aqueous solutions such as beverages.19–22 Using boronic acid arrays, specific fingerprints can be generated for each analyte or mixture to correctly identify and/or quantify the species that is present in solution. This could be achieved in combination with composite data using multivariate analysis, such as principle component analysis (PCA) and/or linear discriminant analysis (LDA).23 To our knowledge, only a few examples of boronic acid arrays have been used to identify and/or quantify mixtures of sugar markers in biomedical research.24
We recently reported a rapid and inexpensive assay to quantify lactulose or mannitol in human urine samples using 4,4′-ortho benzyl boronic acid-appended viologen (4,4′-o-BBV).25 Although successful, this method can be further improved by achieving lower detection and quantification limits as well as tighter discrimination between lactulose and other sugar GI markers such as mannitol. The flexibility of our two-component system permitted the synthesis of multiple BBV receptors in a few steps to assemble unique arrays of boronic acids with varying discrimination power toward different sugars and sugar alcohols. Herein, we report a unique boronic acid array that can discern mixtures containing different proportions of sugars. To demonstrate a biomedical application, mixtures of lactulose and mannitol in proportions representative of normal versus increased GI permeability were analyzed. We further demonstrate the ability to distinguish between seven sugar alcohols encountered in biomedical research, among these, mannitol (Figure 1A,B).
Figure 1.
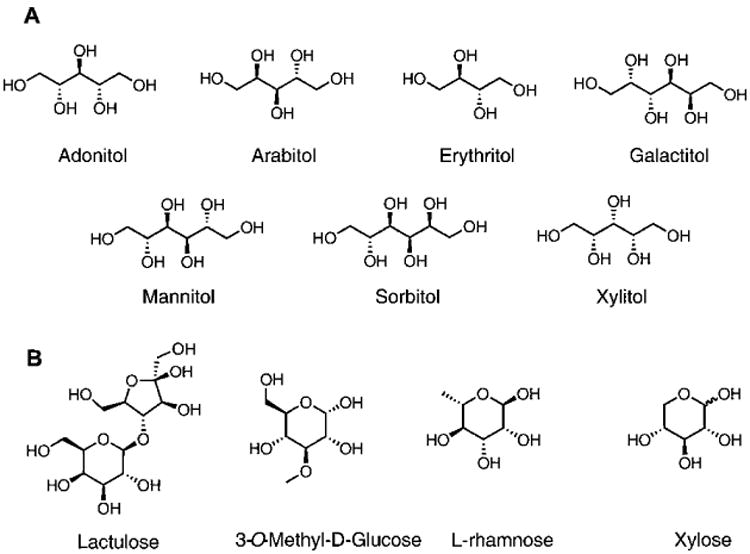
(A) The seven sugar alcohols used in this study. (B) In addition to mannitol, GI permeability markers assayed using boronic acid array.
Experimental Section
General
All reagents and chemicals were of at least analytical grade. Reactions were performed using standard syringe techniques and were carried out in oven-dried glassware under an argon atmosphere. Ultra pure water (>14 MΩ cm) obtained from a Millipore water system was used for each analysis unless otherwise stated. All saccharides and sugars were used as received.
Synthesis of Boronic Acid Receptors
The syntheses of 4,4′-o-BBV, 4,4′-o,m-BBV, 3,4′-o-BBV, 3,3′-o-BBV, 4,7-o-PBBV, and pBoB boronic acid receptors were synthesized according to previously published procedures, with slight modifications (see the Supporting Information).26–28
Discriminant Analysis of Sugar Alcohols and GI Permeability Markers
Boronic acid arrays were prepared by making a stock probe solution of each boronic acid receptor with its respective quencher to dye ratios (Q/D) and HPTS having an initial concentration of 8 μM in 0.1 M sodium phosphate pH 7.4 buffer. Previous studies showed optimal signal recovery when the probe solution is buffered at 7.4.29 A microtiter plate was prepared from each one probe solution, seven sugar alcohols or six permeability markers in the same sodium phosphate buffer to obtain a 2-fold above final concentration before adding to the 96-well plate (Fisherbrand, flat bottom, clear polystyrene, nonsterile). Each well contained equal amounts of probe solution and sugar solution to reach a total volume of 80 μL. To ensure reproducibility, each assay was repeated four times. Fluorescence intensity data was analyzed by PCA or LDA using XLSTAT-Pro (Addinsoft, Paris, France), a statistical add-on package for Excel (Microsoft Corp, Redmond, WA).
Distinguishing between Low and High Lactulose/Mannitol Ratios
Baseline urine was obtained from healthy volunteers who had consumed 0.5–1.0 L of water 3 h prior to urine collection. From the urine that was collected, 2 mL was subjected to a C18 solid phase extraction twice to remove urobilinogen and riboflavin found in urine.25 Baseline urine fractions were spiked with lactulose and mannitol to achieve the lactulose/mannitol (L/M) ratios necessary to represent low to high small intestinal permeability. Each receptor and HPTS (probe) was prepared as a solution as a 4-fold concentration in 0.1 M sodium phosphate-HEPES buffer pH 7.4, with 0.04% triton-×100.
Instrumentation
For multiwell fluorescence measurements, the fluorescence plate reader Envision 2103 Multilabel reader from PerkinElmer was used (excitation filter, 405 nm; emission filter, 535 nm; emission aperture, normal; measurement height from the bottom, 6.5 mm; number of flashes, 10).
Statistics
The lower limits of detection (LOD) and quantification (LOQ) were defined as the analyte concentration in which the fluorescence intensity in the assay was 3 and 10 standard deviations above the mean baseline fluorescence. Results are given as mean ± SEM.
Results And Discussion
Construction of Boronic Acid Receptor Array
The modular two-component sensing system is comprised of the anionic fluorescent dye, 8-hydroxypyrene, 1,3,6-trisulfonic acid trisodium salt (HPTS), and a boronic acid-appended viologen (BBV) that acts dually as a quencher and receptor. In the absence of sugar, a ground state complex is formed due to the Coulombic attraction between the anionic dye and cationic quencher with a decrease of fluorescence intensity as compared with free HPTS. When a saccharide binds, the boronic acids are converted to tetrahedral anionic boronate ester, which neutralizes the cationic viologen, diminishing its quenching efficiency and liberates HPTS. The fluorescent signal generated upon dissociation of the ground state complex is directly proportional to sugar concentration (Scheme 1).30 The dye and quencher as two discrete entities can provide better selectivity and sensitivity over saccharides of interest. This also allows the quencher to be readily modified without altering the photo-physical properties of the reporter dye. Because of the ionic nature of these receptors, they are water-soluble at physiological pH even in the absence of sugar. In addition, varying ratios of receptor to reporter dye can be used to modulate fluorescence response. Several bipyridinium and phenanthrolinium based receptors have been synthesized previously and have been studied extensively for glucose binding.13,26,31 From our library of receptors, six BBVs were chosen for this study based on the following criteria: (a) at least one boronic acid motif must be in the ortho position; (b) each receptor have varying intramolecular distance between boron atoms; (c) the cationic charge of all receptors must be at minimum of 2+; and (d) each receptor must be synthesized in no more than three steps (Figure 2).
Scheme 1. Proposed Mechanism for Fluorescence Signal Generation upon Recognition of Sugar Analyte with 4,4′-o-BBV Receptor.
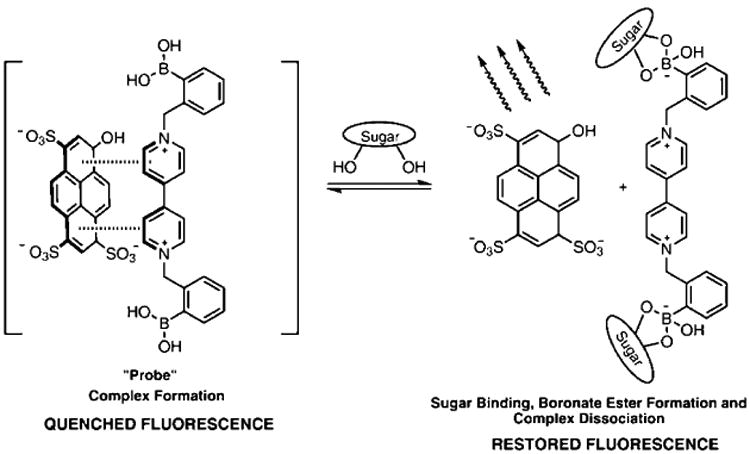
Figure 2.
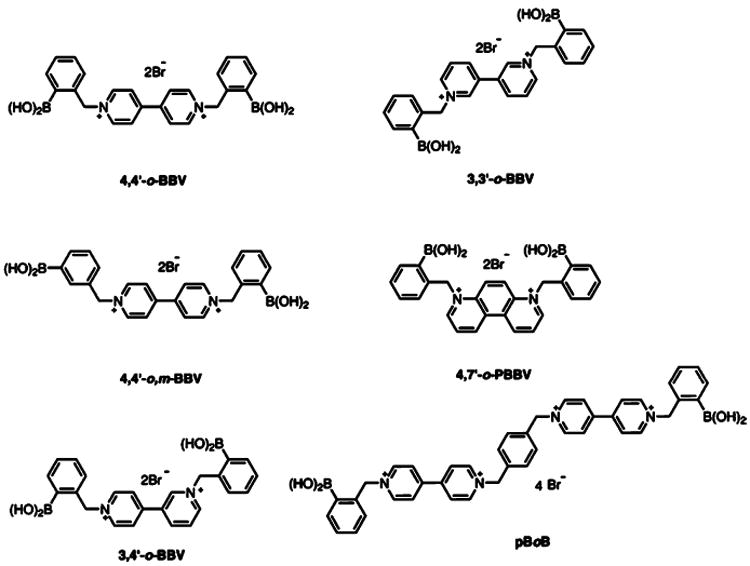
Structures of boronic acid array composed of six unique boronic acid-appended benzyl viologens with corresponding abbreviations.
Discrimination of Sugar Alcohols
Sugar alcohols are the reduction products from aldoses or ketoses. Few of these sugar alcohols, such as meso-erythritol, xylitol, and galactitol, are achiral, difficult to detect in aqueous solution, and challenging to separate chromatographically. Because of their acyclic nature, they tend to adopt different conformations when binding to boronic acid derivatives as compared with cyclic aldoses or ketoses.32 Consequently, designing selective boronic acid receptors for these alcohols poses a difficult challenge. Because these sugar alcohols are important metabolic intermediates, designing sensitive and selective sensors for sugar alcohols has attracted considerable attention in the field of sensor design.33 Only a few boronic acid receptors have demonstrated selectivity for sugar alcohols.34 One sensor design with installation of a stereogenic center near the boronic acid motif provided not only a enantioselective receptor for mannitol or sorbitol but also chemoselectivity over other sugar alcohols.34,35 To circumvent the selectivity challenge, boronic acid arrays can be utilized to provide semispecific binding to these acyclic sugars generating fingerprints for each sugar alcohol.
Because mannitol and erythritol are used as GI permeability markers, we were interested in testing our boronic acid array to generate fingerprints from other sugar alcohols that are potential GI permeability markers. Doing so would allow flexibility for concomitant or alternative use of other sugar alcohols. The BBV array was utilized to discriminate these sugar alcohols. Boronic acid receptors were prepped as “probe” solutions separately, and the seven sugar alcohols were prepared in 0.1 M sodium phosphate buffer at pH 7.4 to afford a 2-fold concentration of each individual probe solution and each sugar alcohol. Because the quenching efficiency of BBVs are different, the quencher to dye ratio (Q/D) of each receptor was adjusted to provide at least 80% quenching of HPTS. From our earlier studies, sugar induced fluorescence recovery can be slow and/or incomplete when HPTS is completely quenched. Consequently, we do not completely quench the fluorescence of HPTS to achieve optimal signal recovery.26 For 4,4′-o-BBV, 3,3′-o-BBV, 3,4′-o-BBV, 4,4′-o,m-BBV, a Q/D ratio of 125:1 was used; for 4,7-o-PBBV, a Q/D ratio of 30:1; and for pBoB, a Q/D ratio of 3:1. Binding isotherms of each sugar alcohol were obtained for each receptor (Figures S2–S7 in Supporting Information) to determine relative binding constants (Table S1). Sugar alcohol concentrations between 2 and 4 mM occupied the midpoint of the dynamic range for each receptor. This fit well within the range that is expected for these sugar alcohols to appear in urine during a permeability test. The boronic acid array provided a data matrix of 6 replicates × 6 receptors × 7 analytes. The fluorescence intensity (F) for each permutation was normalized against initial F without analyte (F0) as the ratio (F/F0). The resulting bar chart conveys a “fingerprint” of the differential responses (Figure 3).
Figure 3.
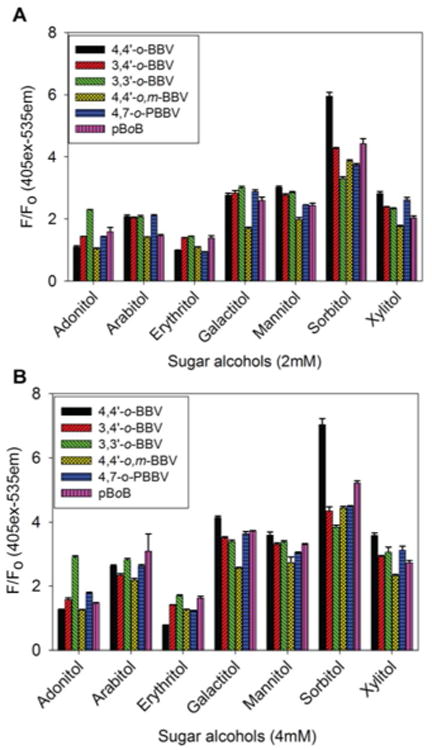
Normalized HPTS (4 μM final concentration) fluorescence responses (F0 = initial quenched fluorescence, F = recovered fluorescence) with each boronic acid receptor against 2 mM (A) and 4 mM (B) of each sugar alcohol in 0.1 M phosphate buffer solution, pH 7.4. Data points are mean ± SEM, n = 6.
Using an array of boronic acid receptors provided a rapid screening of multiple sugar alcohols in a short period of time. This fingerprint generating assay technique is similar to the high-throughput screening of chemical libraries for identifying drug targets and is less labor-intensive than designing selective boronic acids for binding sugar alcohols. The sugar alcohols examined here were of interest because of their potential to be utilized as a substitute for mannitol or use in applications other than gut permeability tests. Acyclic sugar alcohols in general have multiple syn-1,2- and/or syn-1,3-diol units, the latter being where boronate ester formation occurs preferentially.36 Similarly, the number of carbon atoms in the chain also influences boronic acid binding. For example, erythritol (four carbons), adonitol, arabitol, and xylitol (five carbons) exhibit significantly different binding affinities. The stability constants for boronate ester formation for acyclic sugars are known to be proportional to the number of hydroxyl groups.37 These structural differences are known to contribute to sugar alcohol binding affinities for boronic acid receptors. Upon boronate ester formation in erythro-1,2-diol, the neighboring substituents are transposed from a staggered to a sterically demanding eclipse conformation. Conversely, in threo-1,2-diol there is minimal conformation change where the neighboring substituents remain in an energetically favorable staggered conformation.38 As such, acyclic sugar alcohols with a threo-1,2-diol motif have higher binding affinities compared with that of the erythro-1,2-diol motif. Similar observations have been made regarding other groups.36,39 Of the seven sugar alcohols analyzed in this study, sorbitol (two threo-1,2-diol units and one syn-1,3-diol unit) had the highest binding constant relative to other sugar alcohols (Figure 3). Lastly, the intramolecular distance between the two boron atoms is also important for achieving cooperative binding of boronic acids to sugar alcohols containing diols in the threo configuration. Although a distinct fingerprint is generated using the six receptor array for these sugar alcohols, it is still difficult to visually discriminate sugar alcohols from each other. The data set was subjected to PCA analysis to computationally discriminate the sugar alcohols by analyzing the fingerprint generated from the boronic acid array.23 The two-dimensional PCA plot obtained for the seven sugar alcohols using the array of six boronic acid receptors with HPTS as the fluorescence reporter is shown in Figure 4.
Figure 4.
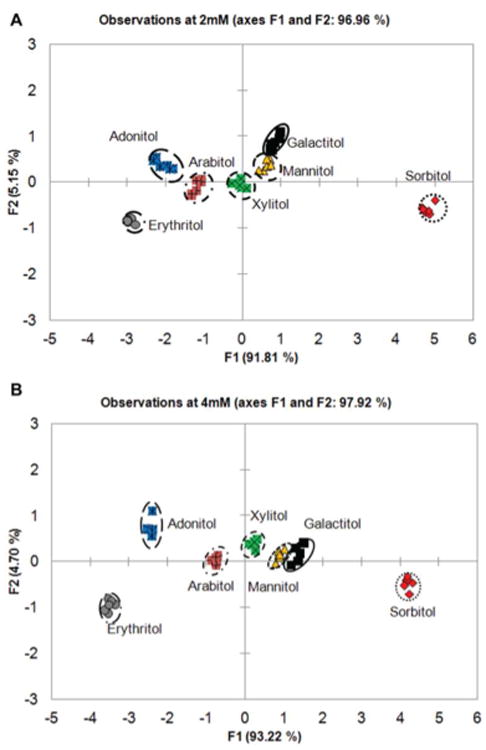
PCA plot with 97% variance for all seven sugar alcohols analyzed at 2 mM (A) and 4 mM (B) concentrations with the six boronic acid receptors. All of the studies were carried out in 0.1 M sodium phosphate pH 7.4 buffer at 25 °C.
Using the six boronic acid array provided high variance (F1 and F2 > 96%) for 2 mM and 4 mM sugar alcohols, with F1 being the significant contributor variance (92%). The F1 axis discriminates these sugar alcohols by their chain length; with six carbon sugar alcohols (galactitol, mannitol, and sorbitol) on the right quadrant and five or four carbon sugars alcohols (adonitol, arabitol, xylitol, and erythritol) on the left quadrant. The basis of their separation stems from the differences in the conformations of boronate esters formed from the sugar alcohol. In addition to the favorable threo-1,2-diol, sugars with syn-1,3-diols displayed higher binding affinity over those with only threo-1,2-diol subunits. The PCA plot shows a clear discrimination of majority of the sugar alcohols, with significant overlap between galactitol and mannitol indicating low discrimination between these sugar alcohols. Galactitol and mannitol (syn-1,2-diol and at least one threo-1,2-diol) have similar diol characteristics explaining their similar binding behavior. Boronate ester formation upon binding sugars with threo-1,2- or syn-1,3-diol was favored over those with erythro-1,2- or syn-1,2-diol units. This was further validated by performing density functional theory calculation carried out at B3LYP/6-31+G* level in the gas phase. The threo-1,2- versus erythro-1,2- preference was studied with borane esters of threitol and erythritol, where the latter is 1.89 kcal/mol higher in energy. Upon tetrahedral anionic borate formation, the energy further raised to 2.24 kcal/mol. This validates the previous observation that threo-1,2-diol units adopt a more energetically favorable conformation upon boronate ester formation.36 Similarly, the difference between syn-1,3- and anti-1,3- were computationally studied with sorbitol and mannitol. It was found that syn-1,3-ester is 3.55 kcal/mol lower in energy than the corresponding anti-1,3- ester. Experimental results showed that the 4,7-o-PBBV receptor had a positive correlation with the calculated predictions of preferred binding between threitol over erythritol, while the other five receptors showed no significant differences (data shown for 4,7-o-PBBV in Figure S8). Moreover, better cluster segregation is observed as the concentration of sugar alcohols increased to 4 mM. The five carbon sugar alcohols, such as xylitol and adonitol, segregate along the F1 axis with minor overlap between the xylitol, galactitol, mannitol, and arabitol cluster in near proximity. This concentration effect decreases the spatial resolution between the clusters and the clusters migrate toward the positive side along the F1 axis with increasing analyte concentration. Because of the overlap observed in the PCA plot with mannitol, galactitol, and xylitol are not suitable mannitol substitutes as GI markers. However, adonitol and erythritol show promise as GI markers, because they are well-separated from mannitol. Overall, sorbitol remained farther apart from the rest of the sugar alcohols. As upper GI permeability is conventionally evaluated using HPLC–ELSD or LC–MS to analyze the urinary excretion of orally administered sugar markers, we then investigated the alternative use of boronic acid arrays to discriminate between commonly used GI sugar markers.
Recognition of Permeability Markers
In vivo GI permeability assessment can be performed noninvasively by oral administration of sugar markers such as lactulose and mannitol. The transport of molecules from the intestinal lumen to the basolateral side can occur through two distinct mechanisms. Mannitol diffuses through transcellular and paracellular pathway, whereas lactulose passes through a size-restricted, paracellular pathway.40 After urinary excretion of these small molecules, they are quantified and the lactulose/mannitol ratio is determined to define “leakiness” of the gut barrier for the small intestine. In addition, other markers can be used to provide insight into the gastric permeability (sucrose), the intestinal absorptive function (xylose and 3-O-methylglucose),41 and colonic permeability (sucralose or erythritol)42,43 for human and canine subjects.
From a range of permeability markers, we selected the markers lactulose, l-rhamnose, xylose, 3oMeGluc, erythritol, and mannitol for our investigation with the boronic acid array to obtain a fingerprint response. The goal of this analysis was to discriminate lactulose from the other sugar markers that are usually used as internal references in the permeability test. The concentration that would be regarded as low permeability, 100–500 μM, was chosen for all markers to identify the boronic acid receptors that are significant for fingerprint generation. For lactulose, optimal fluorescent response is achieved with 4,4′-o-BBV, 4,7-o-PBBV, and pBoB receptors. For mannitol, 4,4′- and 3,3′-o-BBV provided significant fluorescent response (Figure 5A). Consequently, the fingerprint data obtained from just three receptors, 4,4′-o-BBV, 4,7-o-PBBV, and pBoB, was subjected to principle component analysis (PCA). A PCA plot was generated with 96% variance with F1 contributing the most (Figure 5B). All the markers clustered and segregated with the exception of l-rhamnose and erythritol. The clusters for these two sugar markers overlapped; this was expected based on the fingerprint data. For monosaccharides, cis-1,2-diol is necessary for generating a fluorescent signal,44 and for acyclic sugar alcohols, threo-1,2 and syn-1,3-diol binding are important for signal generation.38 Apparently, this binding motif is not optimal in l-rhamnose and erythritol. The majority of the markers segregated onto the left quadrants, with xylose and 3oMeGluc in the left negative quadrant. Lactulose was well discriminated with just two receptors, which provided excellent segregation of the lactulose cluster from the other markers. We then turned our attention to evaluate the effectiveness of this boronic array to discriminate GI permeability markers of interest in human urine samples. We also determined whether the LOD and LOQ could be improved for lactulose using more than two receptors.
Figure 5.
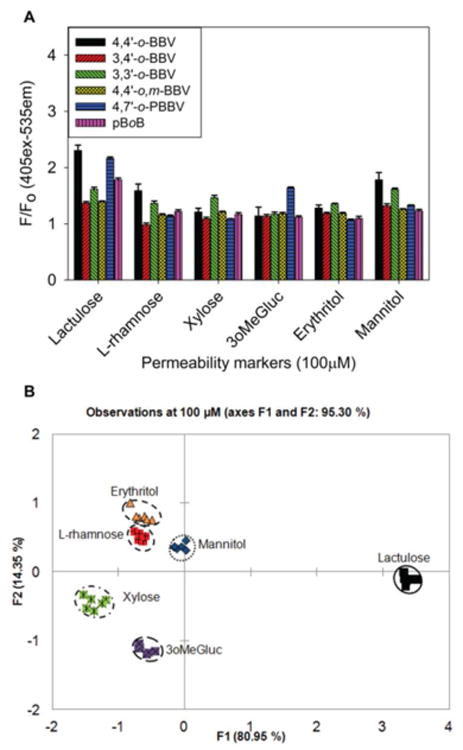
(A) Normalized HPTS (4 μM final concentration) fluorescence responses with each boronic acid receptor against 100 μM of each individual permeability marker. Data points are mean ± SEM, n = 6. F0 = initial quenched fluorescence, F = recovered fluorescence. (B) PCA plot with 100% variance for all permeability markers at 100 μM with 4,4′-o-BBV (500 μM) and 4,7′-o-PBBV (120 μM). Each study was carried out in 0.1 M sodium phosphate buffer solution, pH 7.4 at 25 °C.
The optimal three receptors for lactulose were identified as 4,4′-o-BBV, 4,7-o-PBBV, and pBoB. Using an array containing these three receptors, binding properties (LOD and LOQ) were determined for lactulose and mannitol in buffer and in human baseline urine (Figures S9 and S10). Our previous studies showed that 4,4′-o-BBV can detect lactulose in urine with an LOD and LOQ of 90 and 364 μM and mannitol LOD and LOQ of 416 and 860 μM.25 The present study obtained similar values (Table S2). In parallel measurements against 4,4′-o-BBV, 4,7-o-PBBV gave LOD and LOQ for lactulose of 40 and 72 μM, yielding 2.8- and 6.3-fold reductions compared to 4,4′-o-BBV. The LOD and LOQ of 4,7-o-PBBV for mannitol (272 and 650 μM) were not reduced to the extent relative 4,4′-o-BBV (2.1 and 1.1 fold). Hence, 4,7-o-PBBV offers sharper discrimination between lactulose and mannitol than 4,4′-o-BBV.
The pBoB receptor demonstrated the highest LOD and LOQ values. For lactulose, LOD and LOQ were 2.4- and 2.1-fold higher than 4,4′-o-BBV. For mannitol, the values were 1.6-and 1.9-fold higher than 4,4′-o-BBV. The LOD and LOQ values obtained with 4,7-o-PBBV, in particular, are competitive with those reported for HPLC–MS.45 Overall, the data in Table S2 implies that discriminating different lactulose/mannitol (L/M) ratios is feasible using an array of these three BBVs and, in turn, to differentiate low versus high GI permeability.
Discrimination between Low and Increased GI Permeability
Lactulose is among the most used markers for small intestinal mucosal permeability tests. It is a measure of “leakiness” of the epithelium stemming from any loss of integrity in the tight junctional barrier. This marker is typically referenced against mannitol, which essentially has free diffusion through tight junctions by the paracellular as well as by the transcellular mechanism. With low permeability, lactulose levels are usually <500 μM (<1% ingested) and mannitol levels are between 700 and 2000 μM (5–10% ingested). These reference values were obtained from healthy subjects using enzyme assays.46 With increased permeability, the level of lactulose in urine rises above 500 μM (>5% ingested). Consequently, in healthy humans L/M ratios between 0.1 and 0.3 are common, whereas L/M ratios in the range of 0.5 or higher are common with moderate hyperpermeability. In extreme cases, L/M values can rise >1. Similar values of L/M ratios have been reported in studies involving nonhuman subject groups.47–49 A higher L/M ratio is usually indicative of epithelial barrier damage stemming from maladies that affect the GI tract rooted from inflammation. To develop a routine, noninvasive, and user-friendly GI permeability test, new methodologies will be needed that do not involve specialized instruments, such as HPLC–ELSD and LC–MS, especially for use in low-resource or high-throughput settings. We were interested in applying our rapid and inexpensive assay to measure lactulose/mannitol ratios in human urine samples using an array of boronic acid-appended viologens (BBVs).
However, the current limitation of utilizing boronic acid receptors to quantify small intestinal permeability results from their inability to discriminate lactulose from mannitol in a mixture. There are no prior reports of studies that measure L/M ratios using boronic acid receptors, as it is synthetically challenging to design a boronic acid that is selective for either lactulose or mannitol. One known boronic acid receptor that potently differentiates lactulose from mannitol has limited water solubility, limiting its use for analyzing lactulose in urine.50 If boronic acids are not available to bind selectively to lactulose over mannitol, then it is limited to use one marker at a time in permeability tests. Fortunately, because of the semiselective characteristics of our BBVs, it was possible to generate a fingerprint of the lactulose/mannitol mixtures at various analyte concentrations to discern L/M ratios that distinguish low from increased permeability.
To evaluate the contribution of an individual BBV receptor in discriminating various L/M mixtures, we utilized combination of triads of o-BBVs. This resulted in 20 different BBV receptor arrays with varied L/M ratios. A total of 20 different triad of boronic acid receptors were prepared in 0.1 M sodium phosphate-HEPES buffer pH 7.4 containing 0.04% Triton X-100; the sugar GI marker (L/M) mixtures were prepared in the same buffer, with the exception that the salt concentration was decreased to 0.025 M. We observed that the triad of BBV receptors containing 4,4′-o-BBV, 4,7-o-PBBV, and pBoB generated relatively distinct chemometric patterns for the different L/M ratios (Figure S11). After analysis in buffer, we then used the same triad of BBV receptors along with HPTS to generate fingerprints in human baseline urine of L/M ratios representing low and increased small intestinal permeability. The probe solutions were prepared in the same buffer as described previously. The various L/M mixtures were prepared by spiking human baseline urine obtained from healthy subjects. To obtain the lower range of L/M ratio of 0.1–0.2 used in the L1–L5 mixtures, 100–500 μM lactulose and 500–5 000 μM for mannitol were used (Table S2). The normalized fluorescence response of five low (L1–L5) and nine increased (I1–I9) L/M ratios of GI permeability mixtures added to human urine is shown in Figure 6A. The 4,4′-o-BBV gave an excellent fluorescence response, whereas 4,7-o-PBBV provided a modest response and pBoB a minimal fluorescence signal changes. However, the input from the pBoB receptor was essential to discriminate these L/M ratios. Together, these three receptors provided a wide varying range of binding affinities that yielded distinctively different fingerprints. The fluorescence data thus obtained were subjected to linear discriminant analysis (LDA) to generate the score plot (Figure 6B).
Figure 6.
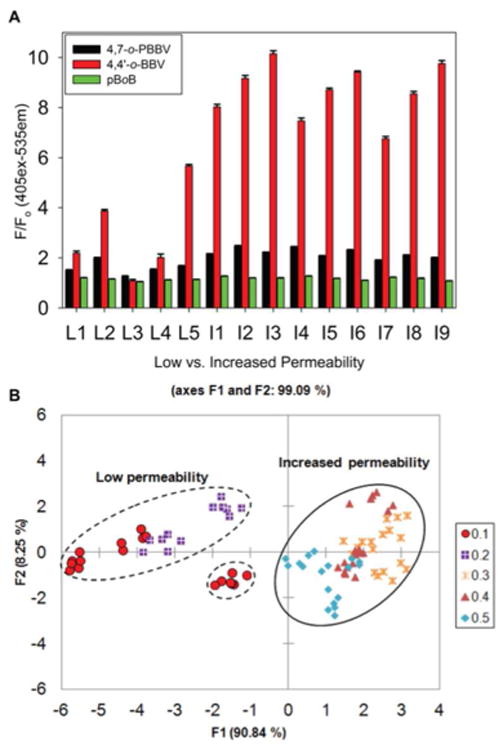
Discrimination between low and increased lactulose/mannitol (L/M) ratio. (A) Normalized fluorescence response of various (L/M) ratios representative of normal or increased GI permeability. Low (L1–L5) and increased (I1–I9) L/M ratios were tested with 4,4′-o-BBV (400 μM), 4,7-o-PBBV (200 μM), and pBoB (16 μM) receptors and HPTS (4 μM). Concentrations are final values in plate wells. Data points are mean ± SEM, n = 6. (B) LDA plot of normalized fluorescence response of various L/M ratios with 99% variance. Each measurement, in six replicates, was run in human urine. Probe solutions were prepared in sodium phosphate/HEPES buffer.
In the LDA plot resulting from the fluorescence data, there was 91% differentiation along the F1 axis and 8% along the F2 axis. The F1 axis separates the two clusters that represent the low L/M ratio of 0.1–0.2 and the increased (permeability) L/M ratio of 0.3–0.5. This array comprising only these three boronic acids (4,4′-o-BBV, 4,7-o-PBBV, and pBoB) was sufficient to discriminate between the low and increased permeability groups. Low values clustered into the left negative and positive quadrants whereas the increased L/M ratios clustered in the right quadrants. This provided unambiguous identification of the two major clusters without any significant overlap between them. The discrimination of the different L/M ratios stems from increasing levels of mannitol; also, a false positive correlation can stem from >3 mM mannitol in the low permeability group (Figure S12).
Confirmation of this training set was carried out using a cross-validation (resubstitution method) that is reported as a confusion matrix. In the cross-validation method, factor scores associated with each observation are submitted to the classification functions and assigned to a group. The numbers of correct and incorrect classifications are counted. In all cases, the LDA classification was validated and gave a 100% correct classification. The goal of this validation was to determine whether an unknown sample could be classified as indicating low or increased L/M ratio by segregating in the positive or negative quadrants along the F2 axis using this training set.
Summary
In summary, this study describes a small array of three boronic acid receptors configured in a two-component fluorescence assay that was used to analyze GI markers lactulose and mannitol in connection with discerning normal from increased small intestinal permeability. In addition, discrimination of seven sugar alcohols and six GI permeability markers was achieved. This study revealed that sugar alcohols with threo-1,2 diol units have higher preference for the boronic acid receptors over that of erythro-1,2 units. Our results demonstrate that it is possible to replace mannitol with other sugars, such as 3-O-methylglucose, as the reference GI marker. Using an array containing a triad of boronic acids receptors, such as, 4,4′-o-BBV, 4,7-o-PBBV, and pBoB, it was possible to discriminate between low and increased small intestinal permeability by analyzing various L/M ratios. Boronic acid arrays can provide an inexpensive, rapid analytical tool that plays a central role in high-throughput analysis in mixtures of sugars or sugar derivatives in complex media. For the first time, a boronic acid array has been used to rapidly identify different sugar and sugar alcohol ratios utilizing chemometric analysis for a biomedical application. This technique alleviated the need to design a highly selective boronic acid receptor for lactulose or mannitol. The present triad receptor array demonstrates the feasibility of rapidly identifying changes in small intestinal permeability, and clearly it may be applied in other biomedical applications.
Supplementary Material
Acknowledgments
The authors would like to dedicate this work to the memory of Professor Heinrich Noth (date of death June 26, 2015). The authors thank Mary N. Wessling for proofreading and editing. A.R. gratefully acknowledges the generous support from the Bridge to the Doctorate program (LSAMP, 2011–2013) of the National Science Foundation (NSF). A.R. also kindly acknowledges the continual support from the Initiative for Maximizing Student Diversity (IMSD, Grant 5R25GM058903) fellowship and the MHIRT travel support of the National Institute of Health (NIH). D.L.W. gratefully acknowledges funding from the Swedish Medical Association (Svenska Läkaresällskapet, Grants SLS-178281, SLS-249741, SLS-330891, SLS-327661, SLS-411921, and SLS-503131), Bengt Ihres Foundation (Grants SLS-249541, SLS-330731, SLS-411011, and SLS-503061), Regional Research Council (RFR, Uppsala/Örebro region (Grants RFR-307491 and RFR-476131), Sven Jerring's Foundation 2013, and the Gastroenterology Research Foundation, Sweden (Grant SLS-504191).
Footnotes
Supporting Information: The Supporting Information is available free of charge on the ACS Publications website at DOI: 10.1021/acs.anal-chem.6b00880.
Experimental procedures, characterization of boronic acid receptors, and detailed sample preparations (PDF)
Author Contributions: D.-L.W. and B.S. contributed equally. A.R., D.-L.W., and B.S. designed the research and analyzed all data; A.R., P.P., and R.Z. performed experiments. P.P. and R.Z. assisted in analyzing the data. A.R. wrote the article with proofreading and editing from the rest of the authors. D.-L.W. and B.S. funded the research.
Notes: The authors declare no competing financial interest.
References
- 1.Bjarnason I, Macpherson A, Hollander D. Gastroenterology. 1995;108:1566–1581. doi: 10.1016/0016-5085(95)90708-4. [DOI] [PubMed] [Google Scholar]
- 2.Welcker K, Martin A, Kolle P, Siebeck M, Gross M. Eur J Med Res. 2004;9:456–60. [PubMed] [Google Scholar]
- 3.Gerova VA, Stoynov SG, Katsarov DS, Svinarov DA. World J Gastroenterol. 2011;17:2211–2215. doi: 10.3748/wjg.v17.i17.. [DOI] [PMC free article] [PubMed] [Google Scholar]
- 4.Smecuol E, Bai JC, Vazquez H, Kogan Z, Cabanne A, Niveloni S, Pedreira S, Boerr L, Maurino E, Meddings JB. Gastroenterology. 1997;112:1129–1136. doi: 10.1016/s0016-5085(97)70123-9. [DOI] [PubMed] [Google Scholar]
- 5.Meddings JB, Jarand J, Urbanski SJ, Hardin J, Gall DG. Am J Physiol-Gastrol Liver Physiol. 1999;276:G951–G957. doi: 10.1152/ajpgi.1999.276.4.G951. [DOI] [PubMed] [Google Scholar]
- 6.Miki K, Butler R, Moore D, Davidson G. Clin Chem. 1996;42:71–75. [PubMed] [Google Scholar]
- 7.Jelinek R, Kolusheva S. Chem Rev. 2004;104:5987–6015. doi: 10.1021/cr0300284. [DOI] [PubMed] [Google Scholar]
- 8.Kim KK, Escobedo JO, St Luce NN, Rusin O, Wong D, Strongin RM. Org Lett. 2003;5:5007–5010. doi: 10.1021/ol035978q. [DOI] [PMC free article] [PubMed] [Google Scholar]
- 9.(a) Wiskur SL, Lavigne JL, Metzger A, Tobey SL, Lynch V, Anslyn EV. Chem - Eur J. 2004;10:3792–3804. doi: 10.1002/chem.200305737. [DOI] [PubMed] [Google Scholar]; (b) Bull SD, Davidson MG, Van den Elsen JMH, Fossey JS, Jenkins ATA, Jiang YB, Kubo Y, Marken F, Sakurai K, Zhao J, James TD. Acc Chem Res. 2013;46:312–326. doi: 10.1021/ar300130w. [DOI] [PubMed] [Google Scholar]; (c) Musto CJ, Suslick KS. Curr Opin Chem Biol. 2010;14:758–766. doi: 10.1016/j.cbpa.2010.07.006. [DOI] [PMC free article] [PubMed] [Google Scholar]
- 10.Hansen JS, Christensen JB. Biosensors. 2013;3:400–418. doi: 10.3390/bios3040400. [DOI] [PMC free article] [PubMed] [Google Scholar]
- 11.Lacina K, Skladal P, James TD. Chem Cent J. 2014;8:60. doi: 10.1186/s13065-014-0060-5. [DOI] [PMC free article] [PubMed] [Google Scholar]
- 12.Wang HC, Lee AR. J Food and Drug Anal. 2015;23:191–200. doi: 10.1016/j.jfda.2014.12.001. [DOI] [PMC free article] [PubMed] [Google Scholar]
- 13.Cordes DB, Singaram B. Pure Appl Chem. 2012;84:2183–2202. [Google Scholar]
- 14.Persaud K, Dodd G. Nature. 1982;299:352–355. doi: 10.1038/299352a0. [DOI] [PubMed] [Google Scholar]
- 15.James TD, Sandanayake K, Shinkai S. Angew Chem, Int Ed Engl. 1996;35:1910–1922. [Google Scholar]
- 16.Zaubitzer F, Buryak A, Severin K. Chem - Eur J. 2006;12:3928–3934. doi: 10.1002/chem.200501410. [DOI] [PubMed] [Google Scholar]
- 17.Nguyen BT, Anslyn EV. Coord Chem Rev. 2006;250:3118–3127. [Google Scholar]
- 18.Lee JW, Lee JS, Chang YT. Angew Chem, Int Ed. 2006;45:6485–6487. doi: 10.1002/anie.200602055. [DOI] [PubMed] [Google Scholar]
- 19.Edwards NY, Sager TW, McDevitt JT, Anslyn EV. J Am Chem Soc. 2007;129:13575–13583. doi: 10.1021/ja073939u. [DOI] [PubMed] [Google Scholar]
- 20.Tan J, Wang HF, Yan XP. Anal Chem. 2009;81:5273–5280. doi: 10.1021/ac900484x. [DOI] [PubMed] [Google Scholar]
- 21.Musto CJ, Lim SH, Suslick KS. Anal Chem. 2009;81:6526–6533. doi: 10.1021/ac901019g. [DOI] [PMC free article] [PubMed] [Google Scholar]
- 22.Ghosh KK, Yap E, Kim H, Lee JS, Chang YT. Chem Commun. 2011;47:4001–4003. doi: 10.1039/c0cc04616g. [DOI] [PubMed] [Google Scholar]
- 23.Jurs PC, Bakken GA, McClelland HE. Chem Rev. 2000;100:2649–2678. doi: 10.1021/cr9800964. [DOI] [PubMed] [Google Scholar]
- 24.Ouchi K, Colyer CL, Sebaiy M, Zhou J, Maeda T, Nakazumi H, Shibukawa M, Saito S. Anal Chem. 2015;87:1933–1940. doi: 10.1021/ac504201b. [DOI] [PubMed] [Google Scholar]
- 25.Resendez A, Halim MA, Landhage CM, Hellstrom PM, Singaram B, Webb DL. Clin Chim Acta. 2015;439:115–121. doi: 10.1016/j.cca.2014.09.031. [DOI] [PMC free article] [PubMed] [Google Scholar]
- 26.(a) Suri JT, Cordes DB, Cappuccio FE, Wessling RA, Singaram B. Langmuir. 2003;19:5145–5152. [Google Scholar]; b Cordes DB, Gamsey S, Sharrett Z, Miller A, Thoniyot P, Wessling RA, Singaram B. Langmuir. 2005;21:6540–6547. doi: 10.1021/la050219x. [DOI] [PubMed] [Google Scholar]
- 27.Gamsey S, Miller A, Olmstead MM, Beavers CM, Hirayama LC, Pradhan S, Wessling RA, Singaram B. J Am Chem Soc. 2007;129:1278–1286. doi: 10.1021/ja066567i. [DOI] [PubMed] [Google Scholar]
- 28.Sharrett Z, Gamsey S, Levine P, Cunningham-Bryant D, Vilozny B, Schiller A, Wessling RA, Singaram B. Tetrahedron Lett. 2008;49:300–304. [Google Scholar]
- 29.Gamsey S, Baxter NA, Sharrett Z, Cordes DB, Olmstead MM, Wessling RA, Singaram B. Tetrahedron. 2006;62:6321–6331. [Google Scholar]
- 30.Camara JN, Suri JT, Cappuccio FE, Wessling RA, Singaram B. Tetrahedron Lett. 2002;43:1139–1141. [Google Scholar]
- 31.(a) Vilozny B, Schiller A, Wessling RA, Singaram B. J Mater Chem. 2011;21:7589–7595. [Google Scholar]; (b) Sharrett Z, Gamsey S, Hirayama L, Vilozny B, Suri JT, Wessling RA, Singaram B. Org Biomol Chem. 2009;7:1461–1470. doi: 10.1039/b821934f. [DOI] [PubMed] [Google Scholar]; (c) Cordes DB, Miller A, Gamsey S, Singaram B. Anal Bioanal Chem. 2007;387:2767–2773. doi: 10.1007/s00216-007-1128-z. [DOI] [PubMed] [Google Scholar]; (d) Gamsey S, Miller A, Olmstead MM, Beavers CM, Hirayama LC, Pradhan S, Wessling RA, Singaram B. J Am Chem Soc. 2007;129:1278–1286. doi: 10.1021/ja066567i. [DOI] [PubMed] [Google Scholar]
- 32.(a) Norrild JC. J Chem Soc, Perkin Trans. 2001;2:719–726. [Google Scholar]; (b) Norrild JC, Eggert H. J Chem Soc, Perkin Trans. 1996;2:2583–2588. [Google Scholar]; (c) Norrild JC, Eggert H. J Am Chem Soc. 1995;117:1479–84. [Google Scholar]
- 33.Slatner M, Nidetzky B, Kulbe KD. Biochemistry. 1999;38:10489–10498. doi: 10.1021/bi990327g. [DOI] [PubMed] [Google Scholar]
- 34.Liang X, James TD, Zhao J. Tetrahedron. 2008;64:1309–1315. [Google Scholar]
- 35.Zhao J, James TD. J Mater Chem. 2005;15:2896–901. [Google Scholar]
- 36.Evans WJ, Mc Courtney EJ, Carney WB. Anal Biochem. 1979;95:383–386. doi: 10.1016/0003-2697(79)90743-7. [DOI] [PubMed] [Google Scholar]
- 37.Van Duin M, Peters JA, Kieboom APG, Van Bekkum H. Tetrahedron. 1985;41:3411–3421. [Google Scholar]
- 38.Peters JA. Coord Chem Rev. 2014;268:1–22. [Google Scholar]
- 39.Lorand JP, Edwards JO. J Org Chem. 1959;24:769–74. [Google Scholar]
- 40.Fihn BM, Sjoqvist A, Jodal M. Gastroenterology. 2000;119:1029–1036. doi: 10.1053/gast.2000.18148. [DOI] [PubMed] [Google Scholar]
- 41.Teshima CW, Meddings JB. Current gastroenterology reports. 2008;10:443–9. doi: 10.1007/s11894-008-0083-y. [DOI] [PubMed] [Google Scholar]
- 42.Farhadi A, Keshavarzian A, Holmes EW, Fields J, Zhang L, Banan A. J Chromatogr B: Anal Technol Biomed Life Sci. 2003;784:145–154. doi: 10.1016/s1570-0232(02)00787-0. [DOI] [PubMed] [Google Scholar]
- 43.Hiele M, Ghoos Y, Rutgeerts P, Vantrappen G. Br J Nutr. 1993;69:169–176. doi: 10.1079/bjn19930019. [DOI] [PubMed] [Google Scholar]
- 44.Schiller A, Vilozny B, Wessling RA, Singaram B. Anal Chim Acta. 2008;627:203–211. doi: 10.1016/j.aca.2008.08.011. [DOI] [PubMed] [Google Scholar]
- 45.Camilleri M, Nadeau A, Lamsam J, Nord SL, Ryks M, Burton D, Sweetser S, Zinsmeister AR, Singh R. Neuro-gastroenterol Motil. 2010;22:E15–E26. doi: 10.1111/j.1365-2982.2009.01361.x. [DOI] [PMC free article] [PubMed] [Google Scholar]
- 46.Northrop CA, Lunn PG, Behrens RH. Clin Chim Acta. 1990;187:79–87. doi: 10.1016/0009-8981(90)90333-n. [DOI] [PubMed] [Google Scholar]
- 47.van Wijck K, Verlinden TJM, van Eijk HMH, Dekker J, Buurman WA, Dejong CHC, Lenaerts K. Clin Nutr. 2013;32:245–251. doi: 10.1016/j.clnu.2012.06.014. [DOI] [PubMed] [Google Scholar]
- 48.McOmber ME, Ou CN, Shulman RJ. J Pediatr Gastroenterol Nutr. 2010;50:269–275. doi: 10.1097/MPG.0b013e3181aa3aa9. [DOI] [PMC free article] [PubMed] [Google Scholar]
- 49.Meddings JB, Gibbons I. Gastroenterology. 1998;114:83–92. doi: 10.1016/s0016-5085(98)70636-5. [DOI] [PubMed] [Google Scholar]
- 50.Kijima H, Takeuchi M, Shinkai S. Chem Lett. 1998:781–782. [Google Scholar]
Associated Data
This section collects any data citations, data availability statements, or supplementary materials included in this article.