Abstract
Aberrant glycosylation has been linked to many different cancer types. In breast cancer metastasis to the brain the blood brain barrier, a region of the brain that regulates the entrance of ions, diseases, toxins, etc., fails to block breast cancer cells from crossing. Here we present a study of identifying and quantifying the glycosylation of six breast and brain cancer cell lines using hydrophilic interaction liquid chromatography (HILIC) and electrostatic repulsion liquid chromatography (ERLIC) enrichments and LC-MS/MS analysis. Qualitative and quantitative analyses of N-linked glycosylation were performed by both enrichment techniques for individual and complementary comparison. Potential cancer glycopeptide biomarkers were identified and confirmed by chemometric and statistical evaluations. A total of 497 glycopeptides were characterized of which 401 were common glycopeptides (80.6% overlap) identified from both enrichment techniques. HILIC enrichment yielded 320 statistically significant glycopeptides in 231BR relative to the other cell lines out of 494 unique glycopeptides, and sequential HILIC-ERLIC enrichment yielded 212 statistically significant glycopeptides in 231BR compared to the other cell lines out of 404 unique glycopeptides. The results provide the first comprehensive glycopeptide listing for these six cell lines.
Keywords: glycoproteomics, N-linked glycosylation, glycopeptide, HILIC enrichment, ERLIC enrichment, blood brain barrier, cancer cell lines, mass spectrometry
Graphical abstract
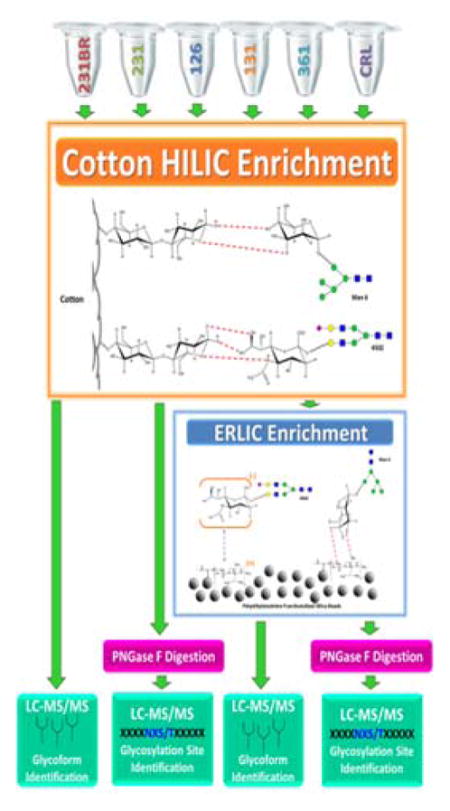
Six breast and brain cancer cell lines were subjected to HILIC and sequential HILIC-ERLIC enrichment for comprehensive identification and quantitation of glycopeptides aiding in the metastasis process across the blood brain barrier.
Introduction
Glycosylation is one of the most prevalent post-translational modifications evidenced by up to ~50% of the human proteome being considered a glycoprotein.1 Glycoproteins function in numerous biological processes, including protein folding, cell growth, cell-cell interaction and adhesion, immune defense, fertilization, viral replication, parasitic infection, degradation of blood clots, inflammation, and cancer metastasis.2, 3 Two fields of study have been developed for the isolation, identification, and quantitation of glycoproteins. The first field is known as “glycomics” and focuses solely on the structure and linkages of the glycans. The second field is referred to as “glycoproteomics” and unlike glycomics, it concentrates on the glycosylation site in addition to the glycan structure. Therefore, glycoproteomics is capable of evaluating the microheterogeneity associated with each glycosylation site. There are two types of glycosylation: N-linked and O-linked.4 N-linked glycosylation involves the covalent attachment of the amide group on an asparagine (N) amino acid to a glycoform. The sequon of the peptide backbone has the motif of NXS/T, where X is not a proline. N-linked glycans are characterized by their five saccharide core, composed of two N-Acetylglucosamine (GlcNAc) followed by three mannose (Man) units resulting in two available antennae for further glycosylation. In contrast, O-linked glycans are the attachment of the hydroxyl functional group on serine (S) or threonine (T) amino acids to a glycoform with no specific sequence motif. O-linked glycans do not express one core type, but can express up to eight different core structures. The most common core, termed Core 1, is Galβ1-3GalNAc. Listed are the other O-glycan core structures: Core 2 is GlcNAcβ1-6(Galβ1-3)GalNAcα, Core 3 is GlcNAcβ1-3GalNAcα, Core 4 is GlcNAcβ1-6(GlcNAcβ1-3)GalNAcα, Core 5 is GalNAcα1-3GalNAcα, Core 6 is GlcNAcβ1-6GalNAcα, Core 7 is GalNAcα1-6GalNAcα, and Core 8 is Galα1-3GalNAcα.3 Additionally saccharides may attach to these cores. Due to this high variation with O-glycans, the manual glycan structure assignment proves to be a challenge.
The current method most often used for glycoproteomic analysis is liquid chromatography (LC) interfaced to a mass spectrometer (MS). In the analysis technique, glycoproteomic samples are enzymatically digested, separated on the LC, and finally analyzed by MS.5 The mass spectrometer is operated in a tandem mass mode in order to gain both diagnostic and structural information. These two types of spectra are acquired by Higher-Energy Collisional Dissociation (HCD) and Collision Induced Dissociation (CID), respectively. Despite the prevalence of glycosylation on proteins, after a typical tryptic digest, glycopeptides are much less abundant than tryptic peptides. Glycopeptides also express poor ionization efficiency during MS analysis. These two observations contribute to the difficulties commonly associated with the analysis of glycopeptides.6, 7 It has, therefore, become routine practice to enrich glycopeptide samples prior to MS analysis. Enrichment allows for the selective binding of the glycopeptides while removing a majority of other interfering species (such as tryptic peptides). Common enrichment methods include lectin affinity chromatography8–10, hydrazide enrichment11, 12, and immunoprecipitation13, 14.
Hydrophilic interaction liquid chromatography (HILIC) selectively enriches glycopeptides by exploiting the polar nature of the glycan; the cellulose material attracts the polar glycopeptides to a greater extent than the tryptic peptides.15, 16 Additional hydrogen bonding contributes to the attraction and isolation of glycopeptides from the solution leaving the hydrophobic peptides to be washed away with an organic solvent. In comparison, electrostatic repulsion liquid chromatography (ERLIC) enrichment is based on the electrostatic interactions between the positively charged polyethylene mine group covalently bound to a modified silica bead stationary phase.17, 18 The large, positive functional group repels species with the same charge, such as positively charged peptides, and attracts species with negative charges such as sialic acid containing glycopeptides. As with HILIC, additional hydrogen bonding secures the attraction and isolation of neutral glycopeptides as well.
Glycopeptide analysis has shown that aberrant glycosylation can be associated with a variety of diseases such as Alzheimer’s disease19, 20, rheumatoid arthritis21, 22, diabetes mellitus23, 24, and cancer25–27. In the case of cancer, studies have shown that 90% of cancer patient mortality rates are due to cancer metastasis28. Even more specific, breast cancer metastasizes to the brain in approximately 30% of patients; the one-year survival rate for breast cancer patients with brain metastasis is as low as 20%.29 The blood-brain barrier (BBB) protects the brain from the peripheral circulation by isolating it with a layer of tight-junction cells; it also regulates the flow of ions, nutrients, and toxins.29 The mechanism by which the blood-brain barrier allows for breast cancer to penetrate, at which point the blood-brain barrier loses its integrity, is currently unknown. For tumor cell penetration across the BBB, the tumor cells have experienced local invasion, intravasation survival in the circulation due to the vascular endothelial growth factor (VEGF), adhesion to the brain microvascular endothelial cells, and finally extravasation where the tumor cells can start growing a new tumor. We hypothesize that a combination of glycans expressed in the cell contributes to this metastasis. The focus of this study is to monitor the changes in the glycosylation abundance of six different breast cancer cell lines through HILIC and ERLIC enrichment for a comprehensive cataloging of glycans present in various breast cancer cell lines.
Experimental section
Chemicals
Dithiothreitol (DTT), iodoacetamide (IAA), ammonium bicarbonate (ABC), sodium deoxycholate (SDC), and MS-grade formic acid were purchased from Sigma-Aldrich (St. Louis, MO). Sodium chloride, disodium phosphate, and HPLC grade water were purchased from Mallinckrodt Chemicals (Phillipsburg, NJ). HPLC grade acetonitrile was purchased from J.T. Baker (Phillipsburg, NJ). Trypsin/Lys-C mix, mass spectrometry grade was purchased from Promega (Madison, WI). PNGase F (Glycerol-free, 500,000 units/ml) was purchased from New England Biolab (Ipswich, MA).
Cancer Cell lines
Six cells lines were purchased from ATCC (Manassas, VA). The cell lines include MDA-MB-231, MDA-MB-231BR, MDA-MB-361, HTB-131, HTB-126, and CRL-1620. All cell lines were cultured in suggested culture medium and harvested following recommended protocols. Table 1 lists the receptor expression and the target location for each cell line. The cell line notation used is as follows: 231, 231BR, 361, 131, 126, and CRL, respectively.
Table 1.
Clinicopathological Features of Cancer Cell Lines. Listed are the receptor regulation information (+, up regulation; −, down regulation) and the isolation location of each cell line. In this study, all cell lines were compared to MDA-MB-231BR since this cell line is a brain targeting breast cancer cell line.
| Cell Line | Estrogen Receptor | Progesterone Receptor | Human Epidermal Growth Factor Receptor 2 | Location |
|---|---|---|---|---|
| MDA-MB-231BR | − | − | − | Subline of 231, brain targeting metastatic |
| MDA-MB-231 | − | − | − | Breast cancer cell line, non-specific metastatic derived from metastatic site: pleural effusion |
| HTB-126 | − | − | − | Breast cancer cell line, derived from a carcinoma |
| HTB-131 | − | − | − | Breast cancer cell line, derived from metastatic site: pericardial effusion |
| MDA-MB-361 | + | + | + | Breast cancer cell line, derived from metastatic site: brain |
| CRL-1620 | N/A | N/A | N/A | Brain cancer cell line |
Extraction and tryptic digestion of protein
Cancer cell line samples (~5x10⁶ cells) were mixed with 100 μL of 5% SDC lysis solution. The cell line samples were lysed in a 2 mL microtube at 40k rpm for 3 minutes with 30 second rests in between for six times. Lysis was performed with 30 μL of triple-high impact zirconium beads (Ø: 0.5 mm). The lysate was centrifuged at 21,000 g for 10 minutes. The supernatant was collected and denatured at 80 °C for 10 minutes. SDC concentration was diluted to 0.5% with 50 mM ABC buffer.
Tryptic Digestion
The concentration of the extracted protein was determined by BCA protein assay (Thermo-Pierce, San Jose, CA). Tryptic digestion was carried out on 400 μg aliquots of extracted protein for each cell line. Protein reduction was then conducted by adding DTT to a final concentration of 5 mM. Incubation occurred at 60 °C for 45 minutes. Alkylation was then performed with 20 mM IAA. Incubation occurred at 37.5 °C in the dark for 30 minutes. A second addition of 5 mM DTT aliquot was added to quench the alkylation process and incubated at 37.5 °C for 30 minutes. After pH confirmation of basic solution conditions, a trypsin solution in a ratio of 1:25 w/w of enzyme:substrate was added and incubated at 37.5 °C for 18 hours. Microwave digestion was then used to complete the tryptic digestion at 45 °C for 30 minutes at 50 W. The digestion was quenched, and the SDC was precipitated by adding 1% (v/v) neat formic acid. The mixture was centrifuged at 21,000 g for 10 minutes. The supernatant was collected, vacuum dried, and re-suspended in 300 μL of 90% acetonitrile immediately before HILIC enrichment.
HILIC Enrichment
Following tryptic digestion, HILIC enrichment was performed on 400 μg aliquots of each cell line based on a modified method by Selman et al15. The HILIC apparatus consisted of 5 mg of commercially available cotton balls packed into a 1 mL pipette tip. The tip was washed with 10 mL of the elution buffer (0.5% formic acid) in 1000 μL increments for 10 times, followed by conditioning of the HILIC material with 10 mL of the loading buffer (90% acetonitrile) in 1000 μL increments for 10 times. The bottom of the tip was sealed with Parafilm, and a 300 μL aliquot of the cell line sample was applied. The top of the tip was then sealed with Parafilm and incubated at 4 °C for 1–2 hours with low agitation. The Parafilm was then removed, and the tip was washed with 10 mL of washing buffer (90% acetonitrile/0.1% formic acid) in 1000 μL increments for 10 times. The cellulose media was then tightly packed into the bottom of the tip, and 400 μL of the elution buffer was aspirated through the stationary phase 25 times and collected. The tip was washed with the elution buffer until a total of 2 mL was collected. The collected eluents were dried and then re-suspended in 8 μL aliquots of 0.1% formic acid so that 112.5 μg of the sample was analyzed by mass spectrometry.
ERLIC and HILIC-ERLIC Enrichment
In the case of only ERLIC enrichment, 400 μg aliquots of cell line samples were enriched. For sequential HILIC-ERLIC enrichment, a 200 μg aliquot of the already HILIC enriched cell line samples were the subjected to ERLIC enrichment (purchased from PolyLC Inc., Columbia, MD). The tip was washed with 100 μL of the elution buffer (5.0% acetonitrile/2.0% formic acid) three times. The tip was then conditioned 100 μL of the loading buffer (80% acetonitrile/0.1% formic acid) three times. The bottom of the tip was capped, and 200 μL of sample was applied to the ERLIC tip. The sample was then mixed, and the top was capped with the provided lid. The samples were allowed to incubate at room temperature for one hour (no agitation). Afterwards, the ERLIC tip was washed with 200 μL of the washing buffer (80% acetonitrile/0.1% formic acid) five times. Glycopeptide elution was then performed and collected with 200 μL of the elution buffer for five times. Figure S-1 depicts the work flow for sample enrichment and analysis.
PNGase F Digestion
A 50 μg aliquot of HILIC enriched and HILIC-ERLIC enriched samples were dried and re-suspended in formic acid prior to PNGase F digestion. Deglycosylation was achieved by adding 200 μL of 10 mM phosphate buffer saline and 0.5 μL of PNGase F to the samples. The samples were incubated at 37 °C for 18 hours. Samples were re-suspended in 0.1% formic acid for mass spectrometric analysis.
LC-MS/MS Analysis
Analysis by LC-MS/MS was performed on a Dionex 3000 Ultimate nano-LC system (Dionex, Sunnyvale, CA) interfaced to an LTQ Orbitrap Velos mass spectrometer (Thermo Scientific, San Jose, CA) equipped with a nano-ESI source. Online-purification of the glycopeptides and peptides was achieved using a PepMap 100 C18 pre-column (75 μm id × 2 cm, 3 μm, 100Å, Thermo Scientific). A sample size of 6 μL was injected during analysis. Separation was then performed using a PepMap 100 C18 capillary column (75 μm id × 15 cm, 2 μm, 100Å, Thermo Scientific). The flow rate was set at 350 nL/min and solvent A was 2% acetonitrile containing 0.1% formic acid, and solvent B was 98% acetonitrile with 0.1% formic acid. To achieve separation the following flow gradient was used: 5% solvent B for 0–10 minute, ramping of 5–20% solvent B for 10–65 minutes, ramping of 20–30% solvent B for 65–90 minutes, ramping of 30–50% solvent B for 90–110 minutes, ramping of 50–80% solvent B for 110–111 minutes, maintaining 80% solvent B at 115 minutes, decreasing 80–5% solvent B from 115–116 minutes, and maintaining 5% solvent B from 116–120 minutes. A 10 minute delay was employed on MS and tandem MS acquisitions. During this time, samples were loaded onto the PepMap 100 C18 pre-column and washed with solvent A at a flow rate of 3 μL/min using a loading pump.
The LTQ Orbitrap Velos mass spectrometer was operated in positive ion-mode with the ESI voltage set to 1500 V at 300°C. Data-dependent acquisition experiment was programmed to conduct three scan events. Scan event one was a full MS scan from 650–2000 m/z range for the HILIC and HILIC-ERLIC enriched sample and from 350–2000 m/z range for the HILIC-PNGase F digested samples with a mass resolution of 15,000. The second scan event was a CID MS/MS of the 5 most intense ions selected from scan event one and having an isolation window of 3.0 m/z. The collision energy was set at 35% and a 0.250 activation Q value. The third scan event was an HCD MS/MS of the 5 most intense ions selected from scan event one and having an isolation widow of 3.0 m/z. The collision energy was set to 45% and a 0.1 ms activation time. The dynamic exclusion was for the ions with a repeat count of 2. The repeat duration was set to 60 seconds, and the dynamic exclusion of an ion was maintained for 90 seconds in an exclusion list of 200.
Data analysis
The .raw files were converted to .mgf files using Discoverer Daemon 1.2 (Thermo Scientific) The .mgf file was then used for a database search using MASCOT 2.3.2 (Matrix Science, Boston, MA) for peptide sequencing. MASCOT parameters were set to search for fixed modification of carbamidomethylation on cysteine and variable modification of oxidation of methionine. The peptide tolerance for matching was set to 10 ppm. A maximum of two missed cleavages were accounted for, and the MS/MS tolerance was set to 0.8 Da. GlyPID 2.030 was used to search for possible glycan structures with an ion score of four or higher. Confirmation was based on diagnostic ion detection in the HCD MS/MS. Such diagnostic ions included m/z values of 138, 204, 274, 292, 366, 657, etc. Glycan structures were then printed and manually assigned from CID MS/MS using the Y1 for glycan-peptide matching. A theoretical peptide backbone mass was calculated from the CID MS/MS using the precursor value after glycan assignment. This theoretical peptide backbone was then matched within 20 ppm (set for maximum matching) to the identified peptides from the MASCOT peptide search results of the PNGase F digested samples.
Peak area quantitation for HILIC glycopeptides and HILIC-ERLIC glycopeptides were obtained with Pinpoint 1.1 (Thermo Scientific, San Jose, CA). A Pinpoint work book of glycopeptide m/z values was created. The peak width was set to 10 scans and a mass accuracy of 20 ppm. Peptide sequences were searched against a carbamidomethylation modification only. The three lowest monoisotopic values were selected. All MS .raw files were then imported into Pinpoint, the accuracy was set to 20 ppm, and the points smoothed. Peak areas exported to Excel from Pinpoint were analyzed for repeating identification and same retention time, but different charge states. In such cases, the peak area intensity values were summed. Additionally, glycopeptides with adducts from cysteine and methionine modifications were summed together with the respective glycopeptide and charge state, while glycopeptides identified as phosphorylated/sulfated were not summed. The peak areas were then normalized, and the average relative intensities (RI) were calculated. The standard error of the mean (SEM) was calculated to consider the variability between the biological cell line samples. A statistical t-test was performed to identify significant differences with a p-value < 0.01.
Results and Discussion
HILIC, ERLIC, and HILIC-ERLIC Comparison
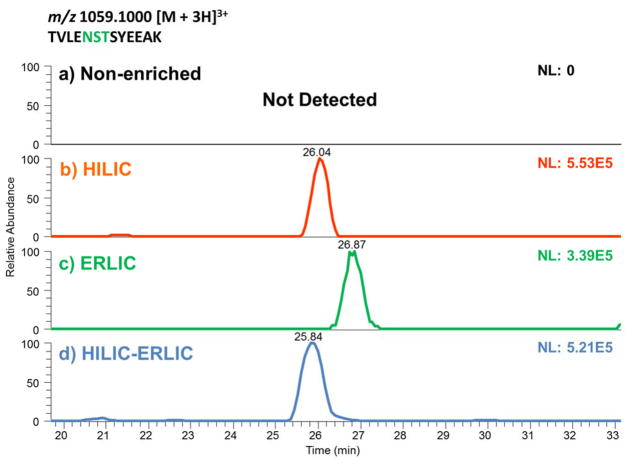
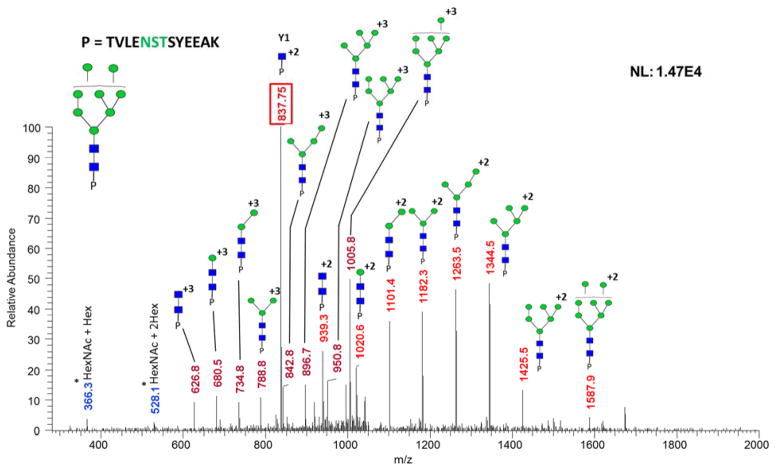
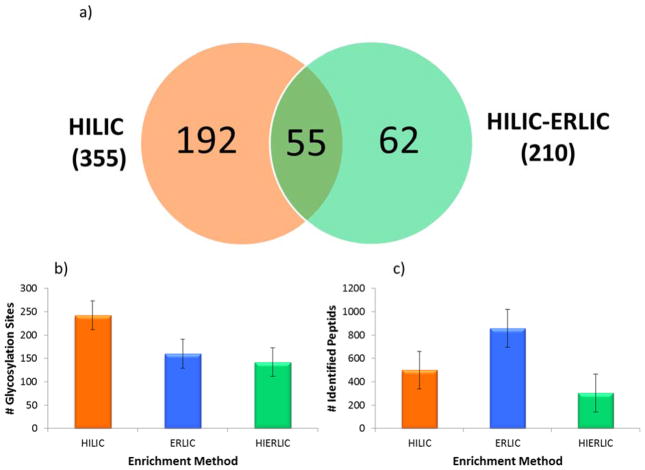
A comparison of HILIC, ERLIC, and sequential HILIC-ERLIC was completed to determine which enrichment method led to the largest number of glycopeptides identified and reduced competitive ionization originating from co-eluting tryptic peptides. It was observed that the different enrichment techniques led to various MS intensities. As shown in the top trace of Figure 1, glycopeptide enrichment is necessary for detection by LC-MS/MS. Figure 1 also suggests that the HILIC enriched sample was detected with the highest intensity followed by HILIC-ERLIC and finally ERLIC. It should be noted that the observed difference in retention time is due to the fact that LC-MS/MS analyses were carried out over the course of several days. The CID MS/MS glycan structural assignment of the 1437.9232 m/z glycopeptide is depicted in Figure 2. It was also observed that upon analyzing cell line CRL-1620 by HILIC, ERLIC, and then sequential HILIC-ERLIC enrichment that HILIC enrichment captured the largest amount (355) of unique glycopeptides, and HILIC-ERLIC captured the lowest amount (210 unique glycopeptides). This is shown in the Venn diagram in Figure 3a as well as the number of glycosylation sites that were unique to each enrichment method. HILIC enrichment out of the three enrichment methods also enabled the highest number of unique glycopeptides capture (Figure 3b); however, HILIC enrichment did not remove the largest number of peptides (Figure 3c). It was observed that HILIC-ERLIC enrichment had the lowest number of identified peptides (302), and the HILIC enriched sample retained 496 peptides, In contrast, ERLIC enrichment had 855 identified peptides, suggesting that this technique alone could not eliminate co-eluting peptides, thus adversely influencing MS/MS analysis. Therefore based on these results, it appears that HILIC and HILIC-ERLIC enrichment is beneficial in the analysis of glycopeptides. Accordingly, then these methods were employed for glycopeptide analysis of six breast cancer cell lines.
Figure 1.
Extracted Ion Chromatograms (EIC) of a glycopeptide possessing Man8 glycan structure from samples that were non-enriched (a), or enriched by HILIC (b), ERLIC (c), and HILIC-ERLIC (d). Enrichment is necessary for glycopeptide as suggested by the inability to detect this peptide in a sample that was not subjected to any enrichment protocol (a).
Figure 2.
CID MS/MS of a Glycopeptide with 1059.1000 m/z shown in Figure 1. Glycopeptide assignment for the +2 and +3 charge state fragments is shown here. The five core N-glycan and Y1 (peptide + HexNAc) are observed in the spectrum, thus facilitating confident structural assignment. Symbols: GlcNAc, blue squares; Man, green circles; Gal, yellow circles; NeuNAc, magenta diamonds. Oxonium ions are marked with asterisks.
Figure 3.
Enrichment Method Comparison. HILIC, ERLIC, and sequential HILIC-ERLIC enrichment methods were compared using cell line CRL-1620. The Venn diagram (a) depicts the number of identified unique glycosylation sites for HILIC and HILIC-ERLIC enrichment methods (shown bolded in the parentheses is the total number of glycopeptides identified in each case) and of those, which glycosylation sites were unique to the individual methods. The two graphs compare the average number of glycosylation sites (b) to the number of identified peptides (c). 242 glycosylation sites, the largest amount, were detected with HILIC enrichment and that 142 peptides, the lowest amount, were determined from HILIC-ERLIC enrichment. The error bars represent the standard deviations associated with biological triplicates.
Glycopeptide Identification and Quantitation
Glycan structures were identified from MS/MS spectra by manual interpretation of the CID with verification by diagnostic ions in the HCD. In the CID, the m/z differences between peaks were used to match saccharides lost after fragmentation. Saccharide matching was used to build the branches and then the five saccharide unit core, ending with the Y1 (peptide + HexNAc) (see Figure 2). Identification of the N-glycan and Y1 allowed for peptide backbone identification. Theoretical peptide masses calculated from the identified glycan spectra were compared to the experimental peptide masses from the PNGase F samples and matched within 20 ppm. A total of 494 unique glycopeptides were identified from the six cell lines by HILIC enrichment and 404 unique glycopeptides were identified by HILIC-ERLIC enrichment. Glycopeptides were determined to be unique if the glycoform, peptide backbone, and retention time (+/− 2 mins) did not match a previously identified glycopeptide. Glycopeptide abundances were then acquired by measuring the peak areas by an extracted ion chromatogram (EIC) and normalizing the areas. Of the 494 glycopeptides identified by HILIC enrichment, after LC-ESI-MS/MS, 40 were not detected during quantitation. The 404 glycopeptides from the HILIC-ERLIC-enriched sample had 147 glycopeptides that were not detected during quantitation.
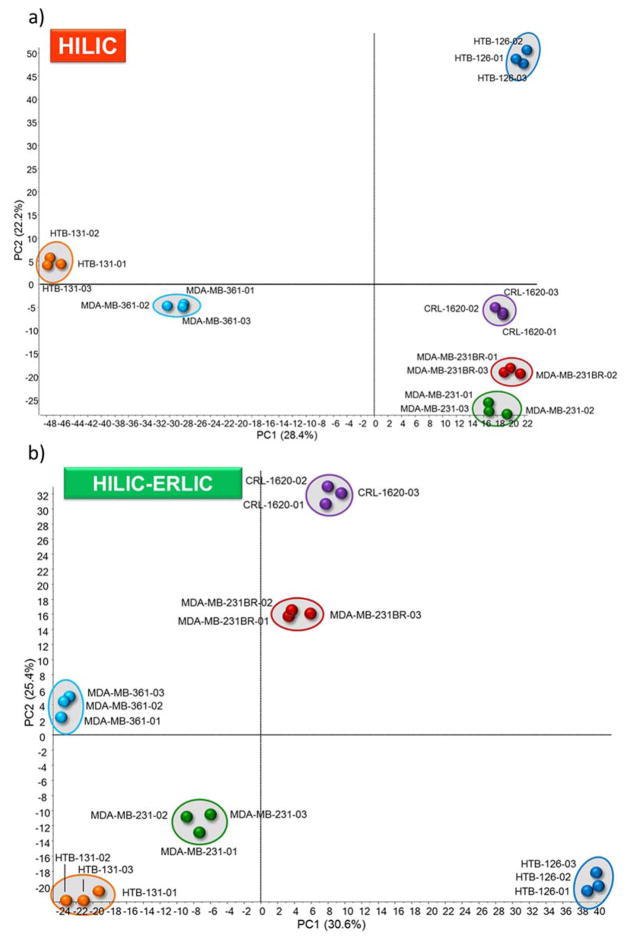
The cell lines were observed to express different glycopeptide abundances among the cell lines. This is first depicted in the principle component analysis (PCA) plots shown in Figure 4. PCA is a form of chemometric analysis that is widely used that utilizes cluster analysis to capture the differences among data sets.31 A plot of the principal component one and two scores for the six cell line samples are illustrated here. Each cell line was clustered to represent different disease states. In the HILIC PCA plot (4a) cell lines 126, CRL, 231BR, and 231 express the greatest similarity along PC1. In the PCA plot representing sequential HILIC-ERLIC enrichment (Figure 4b), the six cell lines show little to no populating along the PCs (CRL and 231BR show some similarity along PC1), but each cell line still demonstrates distinct clustering for different disease states. Therefore, according to the PCA plots, a high distinction exists for the six cell lines, but the various enrichment methods yield different alignment.
Figure 4.
Principal Component Analysis (PCA) plot of LC-ESI-MS/MS results for HILIC (a) and HILIC-ERLIC (b) enriched samples from six breast and brain cancer cell lines.
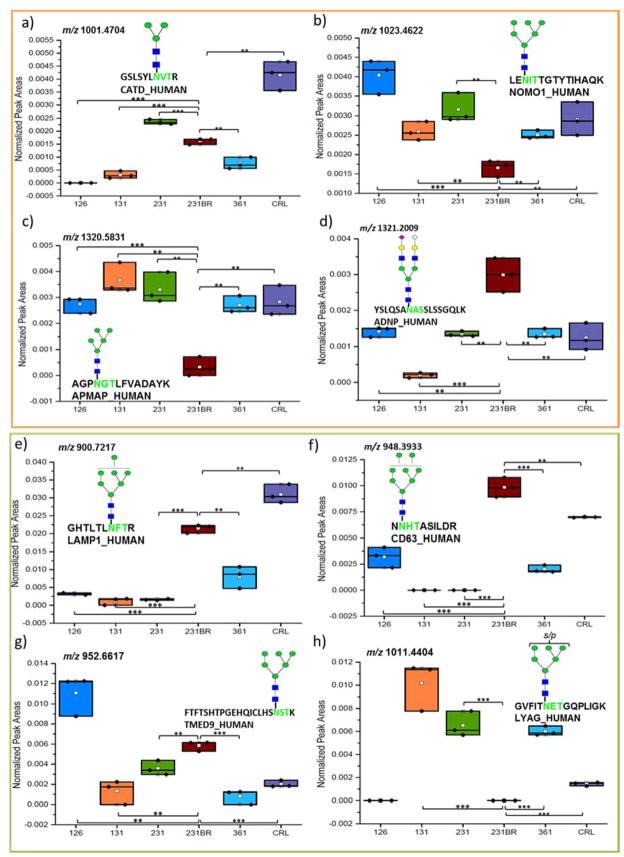
Secondly, to demonstrate that a difference in expression can be detected with our approach, box plots, displaying abundances of four glycopeptides, are shown in Figure 5. Figure 5a–d shows the abundances of four glycopeptides from the HILIC enriched cell lines, and Figure 5e–h shows the abundances of four glycopeptides after sequential HILIC-ERLIC enrichment arbitrarily selected for comparison. In the Figures 5a–d, a comparison is made between varieties of glycan structures on: Cathepsin D (Figure 5a), Nodal modulator 1 (Figure 5b), Adipocyte plasma membrane-associated protein (Figure 5c), and Activity-dependent neuroprotector homeobox protein (Figure 5d). The identified glycan structures include mannose 3, mannose 5, mannose 6, and a sialylated structure. For example, a down regulation was observed for the mannose 5 glycopeptide structure in the MDA-MD-231BR cell line, whereas the other cell lines displayed an up-regulation of this glycopeptide. Other glycopeptides were observed to have a similar significant expression of unique structures. Figures 5e–h compare Lysosome-associated membrane glycoprotein 1 ((Figure 5e), CD63 antigen (Figure 5f), Transmembrane emp24 domain-containing protein 9 (Figure 5g), and Lysosomal alpha-glucosidase glycoproteins (Figure 5h) with an identified mannose 6, sulfated mannose 6, mannose 7, or a mannose 8 glycan structure. It was observed, for example, that the mannose 6 glycopeptide structure expressed an up-regulation in cell line 126 in comparison to the expression in the other cell lines. Other glycopeptides were observed to have a similar significant expression of unique structures.
Figure 5.
Box and dot plots of normalized peak areas of glycopeptides identified by LC-MS/MS after HILIC (a) and HILIC-ERLIC (b) enrichment. These glycopeptides were determined to have statistically significant differences in expression when compared to cell line 231BR. Symbols are the same as in Figure 5; *p < 0.05, **p < 0.01, and ***p < 0.001 (Student’s t-test).
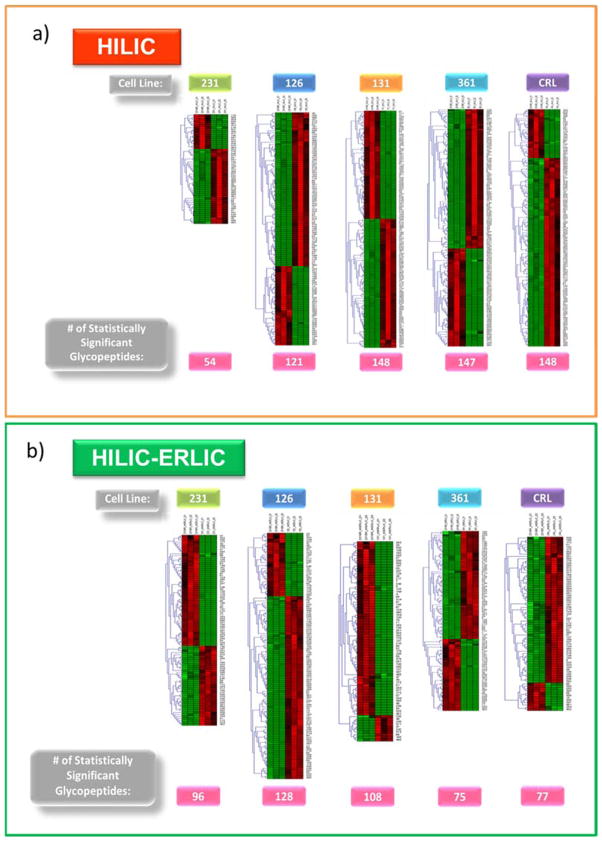
After statistical treatment, the statistically significant abundant glycopeptides compared to MDA-MB-231BR were determined by Student’s t-test using a p-value cutoff of 0.01. From the HILIC enriched cell line samples, 320 out of the 494 identified glycopeptides were statistically significant. In comparison, the HILIC-ERLIC enriched samples had 212 out of the 404 identified glycopeptides determined to be statistically significant. Table S-1 provides a comparison of the number of significantly identified glycopeptides after HILIC and HILIC-ERLIC enrichment. The total number of expressed glycopeptides represents how many glycopeptides were identified in the single cell line. For example, HILIC enriched cell line HTB-126 expressed 483 glycopeptides out of the 494 unique glycopeptides identified from all six cell lines. Out of the 483 expressed glycopeptides, 121 were determined to be significant. It was observed that after HILIC enrichment, HTB-131 and MDA-MB-361 had the highest number of statistically significant glycopeptides (p <0.01) making it the most different compared to 231BR. While after HILIC-ERLIC enrichment HTB-126 had the largest number of statistically significant glycopeptides (p <0.01), resulting in 126 being the most different compared to 231BR. A comprehensive listing of the identified glycopeptides with quantitation information is provided in Table S-2 and Table S-3. The list of glycopeptides includes the retention time (CID_time), glycoform assignment, the matched peptide sequence, the protein name and protein accession number for quantitation. Also listed is the average relative intensity (Avg RI) of the three biological replicates based on normalized area, the standard deviation (Std Dev) associated with the Avg RI, the standard error mean (SEM), and the p-values compared to cell line 231BR for quantitation.
The distribution of the statistically significant glycoforms can be seen in Figure S-2. In both the HILIC and HILIC-ERLIC enriched cases, the high-mannose, biantennary mono-sialylated fucosylated, and biantennary di-sialylated fucosylated glycoforms had a higher abundance of statistically significant identified glycopeptides compared to the other glycoforms identified. For a complete listing of the p-values associated with the statistically significant glycopeptides see Table S-2 and Table S-3. The heat maps in Figure 6 shows the hierarchical clustering analysis. In these heat maps, each row represents a unique glycopeptide that was determined to be statistically significant and each column represents a different cell line sample. The branches connecting the samples are used to show similarity among the identified glycopeptides. Triplicates from each cell line were compared to the triplicates of the reference cell line, 231BR. The cells that are colored bright red represent a high expression and the light green colored cells represent an under expression. As the cell approaches a dark green or black color, this represents no change and, therefore, no similarity between the glycopeptide quantitation comparisons. The glycopeptides are listed by their corresponding numerical value as assigned in Table S-2 and Table S-3.
Figure 6.
Hierarchical Clustering of Label-Free Quantitation for Glycopeptides Detected in HILIC (a) vs HILIC-ERLIC (b) Enriched Samples. The comparison of cell line abundances to 231BR cell line are depicted here. The cell line samples (N = 3 for each cell line) are represented by the columns, and the glycopeptides are represented by the rows. The glycopeptide numbering corresponds to the assigned numerical values listed in supporting information Tables S-2 and S-3. Scale: bright red, a high expression; bright green, a low expression; black, no change.
A recent study from our group (Song et al.32) has shown that lectin affinity chromatography (LAC) captures 102 glycopeptides from esophagus disease blood serum samples for LC-ESI-MS/MS. This is comparable to the LAC studies performed by Madera et al.33 and Drake et al.34 where 108 and 122 glycopeptides were also identified from blood serum samples, respectively. Enrichments performed by hydrazide chemistry (HC) has also shown successful capturing of glycopeptides. In the study performed by Song et al., 96 glycopeptides were identified and detected from an esophagus disease blood serum sample by HC enrichment. This was supported by a previous paper by Zhang et al.11 They reported the identification of 97 human blood serum samples using HC enrichment. Song et al. reported that 139 blood serum glycopeptides were detected using LAC and HC. Of these, 59 were determined to be common in both enriched samples, corresponding to a 42% overlap.
In this study, a total of 497 glycopeptides were identified from both HILIC and HILIC-ERLIC enrichment techniques. From LC-ESI-MS/MS, 401 common glycopeptides were found to be detected in both enriched cancer cell line samples, corresponding to an 80.6% overlap. Of the 497 glycopeptides, 93 glycopeptides were detected by HILIC enrichment alone and 3 glycopeptides from HILIC-ERLIC enrichment alone. The discrepancies associated with enriching and identifying glycopeptides both in this study and other studies is attributed to the different chemistry of the enrichment techniques. LAC targets glycan structures with specific saccharides, whereas HC, HILIC, and HILIC-ERLIC allow for a broader range of glycopeptides. Based on an extensive literature search, ERLIC is primarily associated with phosphopeptide enrichment.35 We acknowledge here the sample loss associated with the HILIC-ERLIC enrichment technique and will continue to optimize the protocol in future studies.
Conclusion
In conclusion, this study provides an evaluation of the distribution of glycoproteins/glycopeptides of six breast and brain cancer cell lines, using HILIC and sequential HILIC-ERLIC enrichment. Glycan structure assigning was achieved with high confidence. The reliable data generated in this study are currently used in the development of a software enabling automated glycan assignment to reduce analysis time and increase data accuracy (GlycoSeq36). Statistical tests were performed on the abundances of the identified glycopeptides, resulting in significant glycopeptides for monitoring as potential biomarkers. Comparing the two enrichment techniques gave an 80.6% overlap of glycopeptides common to both. Statistical treatment suggested that 320 HILIC-enriched glycopeptides and 212 HILIC-ERLIC-enriched glycopeptides are significantly expressed. Evaluation of glycopeptides using HILIC and ERLIC based enrichment techniques is complimentary.
Supplementary Material
Acknowledgments
This work was supported by a grant from the Cancer Prevention Institute of Texas (CPRIT, RP130624) and partially by an NIH grant (1R01GM112490).
Footnotes
Author Contributions
L.G.Z. performed HILIC and HILIC-ERLIC experiments, manual glycan assignment and quantitation for the six cell lines and wrote the manuscript. A.K.H. performed HILIC-ERLIC experiment and manual glycan assignment and quantitation of three of the cell lines. E.S. performed HILIC and HILIC-ERLIC experiments and contributed to glycan assignment and quantitation of two cell lines. J.Z. performed quantitation analysis on three of the cell lines. R.Z. performed the protein extraction experiment and contributed to the glycan assignments of one cell line. P.M. assisted in the protein extraction. Y.M designed the study, supervised the work, and critically revised the manuscript. All authors have given approval to the final version of the manuscript.
Notes
The authors declare no competing financial interest.
Supporting Information. Experimental workflow, glycoform distribution of statistically significant glycopeptides, statistically significant glycopeptide comparison, and comprehensive list of identified glycopeptides after HILIC and HILC-ERLIC enrichment. This material is available free of charge via the Internet at http://pubs.acs.org.
References
- 1.Apweiler R, Hermjakob H, Sharon N. On the frequency of protein glycosylation, as deduced from analysis of the SWISS-PROT database. Biochim Biophys Acta. 1999;1473(1):4–8. doi: 10.1016/s0304-4165(99)00165-8. [DOI] [PubMed] [Google Scholar]
- 2.Dwek RA. Glycobiology: Toward Understanding the Function of Sugars. Chem Rev. 1996;96(2):683–720. doi: 10.1021/cr940283b. [DOI] [PubMed] [Google Scholar]
- 3.Varki A, Cummings RD, Esko JD, Freeze HH, Stanley P, Bertozzi CR, Hart GW, Etzler ME, editors. Essentials of Glycobiology. Cold Spring Harbor Laboratory Press; Cold Spring Harbor (NY): 2009. [PubMed] [Google Scholar]
- 4.An HJ, Froehlich JW, Lebrilla CB. Determination of glycosylation sites and site-specific heterogeneity in glycoproteins. Curr Opin Chem Biol. 2009;13(4):421–6. doi: 10.1016/j.cbpa.2009.07.022. [DOI] [PMC free article] [PubMed] [Google Scholar]
- 5.Kuzyk MA, Smith D, Yang J, Cross TJ, Jackson AM, Hardie DB, Anderson NL, Borchers CH. Multiple reaction monitoring-based, multiplexed, absolute quantitation of 45 proteins in human plasma. Mol Cell Proteomics. 2009;8(8):1860–77. doi: 10.1074/mcp.M800540-MCP200. [DOI] [PMC free article] [PubMed] [Google Scholar]
- 6.Huang BY, Yang CK, Liu CP, Liu CY. Stationary phases for the enrichment of glycoproteins and glycopeptides. Electrophoresis. 2014;35(15):2091–107. doi: 10.1002/elps.201400034. [DOI] [PubMed] [Google Scholar]
- 7.Chen CC, Su WC, Huang BY, Chen YJ, Tai HC, Obena RP. Interaction modes and approaches to glycopeptide and glycoprotein enrichment. Analyst. 2014;139(4):688–704. doi: 10.1039/c3an01813j. [DOI] [PubMed] [Google Scholar]
- 8.Ongay S, Boichenko A, Govorukhina N, Bischoff R. Glycopeptide enrichment and separation for protein glycosylation analysis. J Sep Sci. 2012;35(18):2341–72. doi: 10.1002/jssc.201200434. [DOI] [PubMed] [Google Scholar]
- 9.Madera M, Mann B, Mechref Y, Novotny MV. Efficacy of glycoprotein enrichment by microscale lectin affinity chromatography. J Sep Sci. 2008;31(14):2722–32. doi: 10.1002/jssc.200800094. [DOI] [PMC free article] [PubMed] [Google Scholar]
- 10.Mechref Y, Madera M, Novotny MV. Glycoprotein enrichment through lectin affinity techniques. Methods Mol Biol. 2008;424:373–96. doi: 10.1007/978-1-60327-064-9_29. [DOI] [PubMed] [Google Scholar]
- 11.Zhang H, Li XJ, Martin DB, Aebersold R. Identification and quantification of N-linked glycoproteins using hydrazide chemistry, stable isotope labeling and mass spectrometry. Nat Biotechnol. 2003;21(6):660–6. doi: 10.1038/nbt827. [DOI] [PubMed] [Google Scholar]
- 12.Nilsson J, Ruetschi U, Halim A, Hesse C, Carlsohn E, Brinkmalm G, Larson G. Enrichment of glycopeptides for glycan structure and attachment site identification. Nat Methods. 2009;6(11):809–11. doi: 10.1038/nmeth.1392. [DOI] [PubMed] [Google Scholar]
- 13.Tsai HY, Boonyapranai K, Sriyam S, Yu CJ, Wu SW, Khoo KH, Phutrakul S, Chen ST. Glycoproteomics analysis to identify a glycoform on haptoglobin associated with lung cancer. Proteomics. 2011;11(11):2162–70. doi: 10.1002/pmic.201000319. [DOI] [PubMed] [Google Scholar]
- 14.Wang D, Hincapie M, Rejtar T, Karger BL. Ultrasensitive characterization of site-specific glycosylation of affinity-purified haptoglobin from lung cancer patient plasma using 10 mum i.d. porous layer open tubular liquid chromatography-linear ion trap collision-induced dissociation/electron transfer dissociation mass spectrometry. Anal Chem. 2011;83(6):2029–37. doi: 10.1021/ac102825g. [DOI] [PMC free article] [PubMed] [Google Scholar]
- 15.Selman MH, Hemayatkar M, Deelder AM, Wuhrer M. Cotton HILIC SPE microtips for microscale purification and enrichment of glycans and glycopeptides. Anal Chem. 2011;83(7):2492–9. doi: 10.1021/ac1027116. [DOI] [PubMed] [Google Scholar]
- 16.Buszewski B, Noga S. Hydrophilic interaction liquid chromatography (HILIC)--a powerful separation technique. Anal Bioanal Chem. 2012;402(1):231–47. doi: 10.1007/s00216-011-5308-5. [DOI] [PMC free article] [PubMed] [Google Scholar]
- 17.Alpert AJ. Electrostatic repulsion hydrophilic interaction chromatography for isocratic separation of charged solutes and selective isolation of phosphopeptides. Anal Chem. 2008;80(1):62–76. doi: 10.1021/ac070997p. [DOI] [PubMed] [Google Scholar]
- 18.Hao P, Guo T, Sze SK. Simultaneous analysis of proteome, phospho- and glycoproteome of rat kidney tissue with electrostatic repulsion hydrophilic interaction chromatography. PLoS One. 2011;6(2):e16884. doi: 10.1371/journal.pone.0016884. [DOI] [PMC free article] [PubMed] [Google Scholar]
- 19.Akasaka-Manya K, Manya H, Sakurai Y, Wojczyk BS, Spitalnik SL, Endo T. Increased bisecting and core-fucosylated N-glycans on mutant human amyloid precursor proteins. Glycoconj J. 2008;25(8):775–86. doi: 10.1007/s10719-008-9140-x. [DOI] [PubMed] [Google Scholar]
- 20.Sihlbom C, Davidsson P, Nilsson CL. Prefractionation of cerebrospinal fluid to enhance glycoprotein concentration prior to structural determination with FT-ICR mass spectrometry. J Proteome Res. 2005;4(6):2294–301. doi: 10.1021/pr050210g. [DOI] [PubMed] [Google Scholar]
- 21.Elliott MA, Elliott HG, Gallagher K, McGuire J, Field M, Smith KD. Investigation into the concanavalin A reactivity, fucosylation and oligosaccharide microheterogeneity of alpha 1-acid glycoprotein expressed in the sera of patients with rheumatoid arthritis. J Chromatogr B Biomed Sci Appl. 1997;688(2):229–37. doi: 10.1016/s0378-4347(96)00309-x. [DOI] [PubMed] [Google Scholar]
- 22.Smith KD, Pollacchi A, Field M, Watson J. The heterogeneity of the glycosylation of alpha-1-acid glycoprotein between the sera and synovial fluid in rheumatoid arthritis. Biomed Chromatogr. 2002;16(4):261–6. doi: 10.1002/bmc.158. [DOI] [PubMed] [Google Scholar]
- 23.Poland DC, Schalkwijk CG, Stehouwer CD, Koeleman CA, van het Hof B, van Dijk W. Increased alpha3-fucosylation of alpha1-acid glycoprotein in Type I diabetic patients is related to vascular function. Glycoconj J. 2001;18(3):261–8. doi: 10.1023/a:1012412908983. [DOI] [PubMed] [Google Scholar]
- 24.Higai K, Azuma Y, Aoki Y, Matsumoto K. Altered glycosylation of alpha1-acid glycoprotein in patients with inflammation and diabetes mellitus. Clin Chim Acta. 2003;329(1–2):117–25. doi: 10.1016/s0009-8981(02)00427-8. [DOI] [PubMed] [Google Scholar]
- 25.Lau KS, Dennis JW. N-Glycans in cancer progression. Glycobiology. 2008;18(10):750–60. doi: 10.1093/glycob/cwn071. [DOI] [PubMed] [Google Scholar]
- 26.Block TM, Comunale MA, Lowman M, Steel LF, Romano PR, Fimmel C, Tennant BC, London WT, Evans AA, Blumberg BS, Dwek RA, Mattu TS, Mehta AS. Use of targeted glycoproteomics to identify serum glycoproteins that correlate with liver cancer in woodchucks and humans. Proc Natl Acad Sci U S A. 2005;102(3):779–84. doi: 10.1073/pnas.0408928102. [DOI] [PMC free article] [PubMed] [Google Scholar]
- 27.Machado E, Kandzia S, Carilho R, Altevogt P, Conradt HS, Costa J. N-Glycosylation of total cellular glycoproteins from the human ovarian carcinoma SKOV3 cell line and of recombinantly expressed human erythropoietin. Glycobiology. 2011;21(3):376–86. doi: 10.1093/glycob/cwq170. [DOI] [PubMed] [Google Scholar]
- 28.Reymond N, d’Agua BB, Ridley AJ. Crossing the endothelial barrier during metastasis. Nat Rev Cancer. 2013;13(12):858–70. doi: 10.1038/nrc3628. [DOI] [PubMed] [Google Scholar]
- 29.Arshad F, Wang L, Sy C, Avraham S, Avraham HK. Blood-brain barrier integrity and breast cancer metastasis to the brain. Patholog Res Int. 2010;2011:920509. doi: 10.4061/2011/920509. [DOI] [PMC free article] [PubMed] [Google Scholar]
- 30.Mayampurath AM, Wu Y, Segu ZM, Mechref Y, Tang H. Improving confidence in detection and characterization of protein N-glycosylation sites and microheterogeneity. Rapid Commun Mass Spectrom. 2011;25(14):2007–19. doi: 10.1002/rcm.5059. [DOI] [PubMed] [Google Scholar]
- 31.Balsera MA, Wriggers W, Oono Y, Schulten K. Principal Component Analysis and Long Time Protein Dynamics. J Phys Chem-US. 1996;100(7) [Google Scholar]
- 32.Song E, Zhu R, Hammoud ZT, Mechref Y. LC–MS/MS Quantitation of Esophagus Disease Blood Serum Glycoproteins by Enrichment with Hydrazide Chemistry and Lectin Affinity Chromatography. J Proteome Res. 2014;13(11):12. doi: 10.1021/pr500570m. [DOI] [PMC free article] [PubMed] [Google Scholar]
- 33.Madera M, Mechref Y, Klouckova I, Novotny MV. High-sensitivity profiling of glycoproteins from human blood serum through multiple-lectin affinity chromatography and liquid chromatography/tandem mass spectrometry. J Chromatogr B Analyt Technol Biomed Life Sci. 2007;845(1):121–37. doi: 10.1016/j.jchromb.2006.07.067. [DOI] [PubMed] [Google Scholar]
- 34.Drake PM, Schilling B, Niles RK, Braten M, Johansen E, Liu H, Lerch M, Sorensen DJ, Li B, Allen S, Hall SC, Witkowska HE, Regnier FE, Gibson BW, Fisher SJ. A lectin affinity workflow targeting glycosite-specific, cancer-related carbohydrate structures in trypsin-digested human plasma. Anal Biochem. 2011;408(1):71–85. doi: 10.1016/j.ab.2010.08.010. [DOI] [PMC free article] [PubMed] [Google Scholar]
- 35.Alpert AJ, Hudecz O, Mechtler K. Anion-Exchange Chromatography of Phosphopeptides: Weak Anion Exchange versus Strong Anion Exchange and Anion-Exchange Chromatography versus Electrostatic Repulsion–Hydrophilic Interaction Chromatography. Anal Chem. 2015;87(9):7. doi: 10.1021/ac504420c. [DOI] [PMC free article] [PubMed] [Google Scholar]
- 36.Yu C, Mayampurath A, Zhu R, Zacharias LG, Song E, Wang L, Mechref M, Tang H. Automated glycan sequencing from tandem mass spectra of N-linked glycopeptides. Anal Chem. doi: 10.1021/acs.analchem.5b04858. in press. [DOI] [PMC free article] [PubMed] [Google Scholar]
Associated Data
This section collects any data citations, data availability statements, or supplementary materials included in this article.


