More than 20 years ago, in a footnote to their classic paper, Bronfenbrenner & Ceci, 1994 described a personal communication with one of the current authors:
For twins with mothers having the least education, the correlation between identical twins is .80, whereas the correlation for fraternal twins is .47. For the twins having mothers with more education, these correlations are .82 and .39, respectively. As you will see, this yields a heritability estimate of .66 for the first group, whereas it is .86 for the second group. If I understand your hypothesis correctly, this is in accordance with your predictions. However, the difference between the two DZ [dizygotic] correlations does not seem to reach statistical significance, although it is quite near.
Although at that time Scarr (1971) had already reported variation in the heritability of cognitive ability according to socioeconomic status, and Fischbein (1980) had replicated it, the phenomenon had received little notice. It was only several years later, when Rowe, Jacobson, & Van den Oord (1999) reported a similar interaction with maternal education in the Adolescent Health and Development Project, followed by the Turkheimer et al. (2003) report from the National Collaborative Perinatal Project, that the possibility that low SES might attenuate genetic (or amplify shared environmental) variance in cognitive ability came to be widely considered.
The years since Turkheimer et al. (2003) have seen a sharp increase in analyses of this kind. A narrative review (Turkheimer & Horn, 2012) and a recent meta-analysis (Tucker-drob & Bates, 2015) have reached a consistent conclusion: the interaction between ACE parameters and SES appears to occur reliably in the United States, albeit with an average effect size somewhat smaller than was suggested by the early reports; the interaction does not, however, appear to occur in other western nations. In the current paper we return to the original Norwegian conscript data that prompted the footnote in Bronfenbrenner & Ceci (1994), using modeling methods that have been developed since that time. As described in the footnote, there does indeed appear to be an interaction between parental education and children’s ability. Several complications that arise in the course of the analysis lead to suggestions for future studies.
Methods
Participants
Subjects were drawn from a population of Norwegian male military conscripts born between 1931 and 1960. At that time, all able young Norwegian men had to meet before a draft board before they enter military service. The data set was obtained by matching the files with intelligence test scores from the army files with the Norwegian Twin Panel comprising zygosity data. This dataset has been previously employed for several related analyses: whether the genetic and environmental estimates vary across ability level and across birth cohorts (Sundet, Eilertsen, Tambs, & Magnus, 1994; Sundet, Tambs, Magnus, & Berg, 1988). It was possible to retrieve complete zygosity, intelligence test and education of at least one parent for 700 MZ pairs and 1,006 DZ pairs. Data for twins born in the period 1936–1943 were not obtainable. Thus, we have data on 22 age groups of male twins, all of which have been tested at approximately the same age (late teens or early twenties), thereby avoiding a confounding of age and year of birth. The sample includes about 40% to 45% of the male twin population born in that period. Sample attrition was due mainly to selection in the twin panel (Magnus, Nance, & Berg, 1983) but also to missing intelligence test data on one or both members of the twin pair. In addition, the fact that disabled young people were exempted from the medical and psychological investigations may have introduced some bias. Although other sources of bias may be present as well, due to the population-based twin panel, we consider the sample to be representative of the general population of young Norwegian males during the relevant time period.
Measures
A detailed history of Norwegian conscript testing is available (in Norwegian) in (Hansen, 2006). The zygosity of the pairs was ascertained by means of a mailed questionnaire, which was answered by more than 80% of the twins. Bloodtyping of a subsample (207 pairs) showed that this questionnaire classified 97% of the pairs correctly (Magnus, Nance, & Berg, 1983).
The intelligence test used by the Norwegian Army included three subtests--Arithmetic, Word Similarities, and Figures. The Arithmetic subtest measures arithmetic ability but also logical reasoning ability and consists of questions quite similar to those in the Arithmetic subtest of the WAIS. In 1963 the Arithmetic test was modernized and updated rules for scoring were introduced. For the first few years the Figures test was a version of Raven’s Progressive Matrices. In the mid 1950’s it was replaced by a test constructed to be similar to Raven’s Progressive Matrices test (Hansen, 2006). The Word Similarities subtest is intended to be a measure of the vocabulary of the respondent. A key word is given, and the task is to pick out the synonymous word among six alternatives. The test-retest reliabilities of the Arithmetic, Word Similarities, and Figures subtests are .84, .90, and .72, respectively. The intercorrelations between the subtests are .53 (Arithmetic and Figures), .64 (Arithmetic and Word Similarities), and .59 (Figures and Word Similarities) (Notes from the Psychological Services of the Norwegian Armed Forces, 1956).
The data reported in this paper is a general ability (GA) score obtained by combining the subtest scores (the individual subtest scores are no longer available). The Word Similarities subtest was not included in the battery until 1954. Thus, the GA scores for the 1931–1934 age groups are not strictly comparable to the rest. Considering the high intercorrelations between the subtests, this may not be a very serious limitation. The scale used is an ordinary stanine (M = 5, SD = 1.96). The test-retest reliability of GA is .87 (Notes from the Psychological Services of the Norwegian Armed Forces, 1956). To our knowledge the test has not been fully validated against more established ability tests, but it has been compared to WAIS IQ for a small sample (n = 48) in which the WAIS was administered between two and twenty-five years after the military test; the correlations was found it to be reasonably high (r = .75, 95% CI = .59 – .85; Tambs, Sundet, & Magnus, 1988).
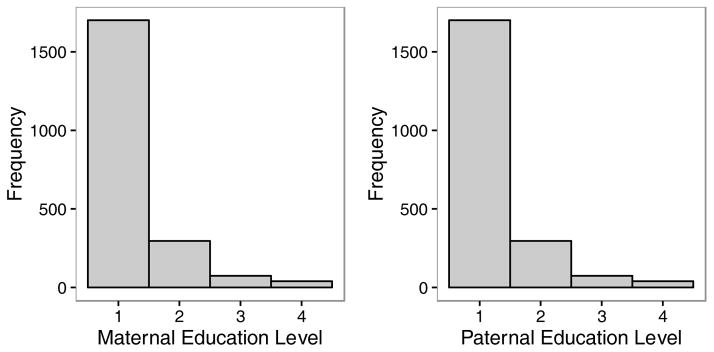
Educational attainment was measured on an ordinal scale with values ranging from 1 to 4. (1 = 0–7 years, 2 = 8–9, 3 = 10–12, 4 = 12+). The distribution of education scores for mothers and fathers is given in Figure 1. We will conduct the main analyses for this paper using mid-parent education, substituting the education of one parent when the other one is missing. Results for maternal and paternal education alone are roughly similar, and provided in Appendix 1.
Figure 1.
Histograms of paternal and maternal education level.
Modeling Procedures
Basic statistical procedures and data preparation were conducted in R. Models were fit using MPlus (Muthén & Muthén, 2015) using maximum likelihood estimation. The structural equation models we employed will be described below.
Results
Descriptive Results
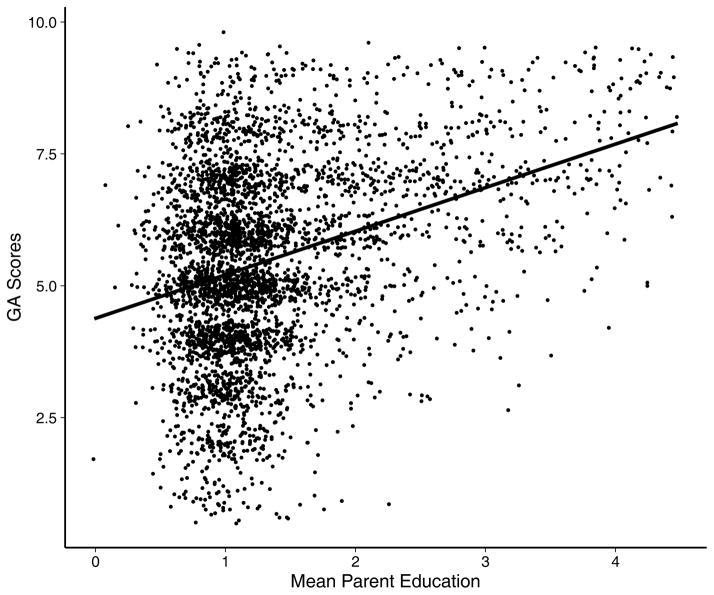
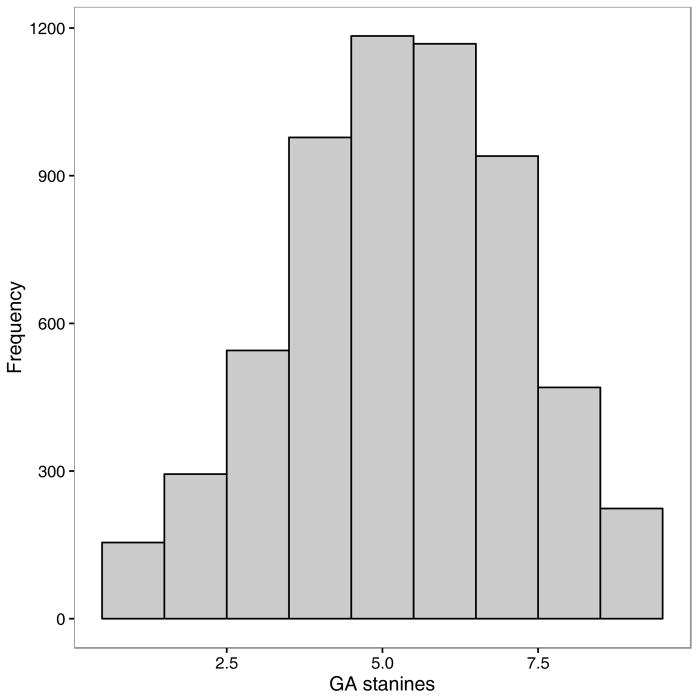
Mother’s education had a mean of 1.27 (SD = .62, Median = 1.0), father’s education had a mean of 1.40 (SD = .82, Median =1.0). The distributions of mother’s, father’s and mid-parent education were highly skewed, mostly falling in the lowest category, as illustrated in Figure 3. These values are equivalent to less than a high school education, reflecting the lower educational standards of an earlier time in Norway. The mean GA score was 5.30 (SD = 1.85, Median = 5). The distributions of GA scores are given in Figure 2. The twin correlations for GA scores were r = .84 in MZ twins and r = .51 in DZ twins. Maternal education was correlated .31 with child GA, paternal education was correlated .34, and mid-parent education was correlated .35.
Figure 3.
Scatterplot of jittered conscript general ability (GA) scores plotted against jittered mid-parent education level with fitted ordinary least squares regression line with 95% confidence interval. Small amount of error added to data to show pattern of scatter plot.
Figure 2.
Histogram of conscript general ability (GA) scores.
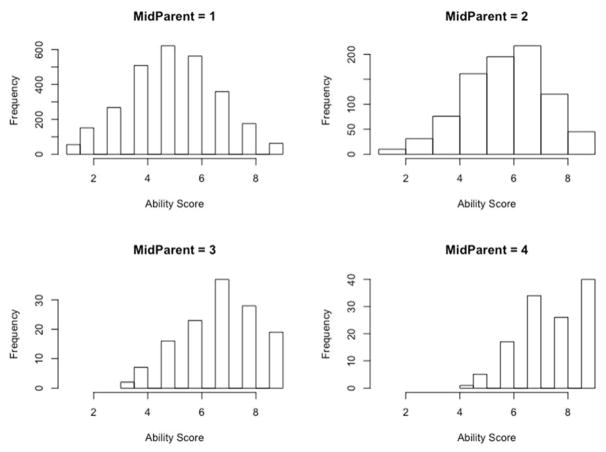
Figure 3, a scatterplot of child against mid-parent education (a small amount of jittered error has been added to GA and education in the figure, to prevent the points from overlapping and enhancing the impression of the shape of the relationship), illustrates a result that will play an important role in the analysis that follows: the relationship is visibly heteroscedastic, with reduced variation around the regression line at higher levels of parental education resulting from a relative absence of low GA scores among the children of parents with high education, and a ceiling effect on the GA score (Figure 4). This heteroscedasticity and right-censoring will be taken into account in the models that follow.
Figure 4.
Distribution of GA at four levels of mid-parent education.
Modified Twin Correlation Model
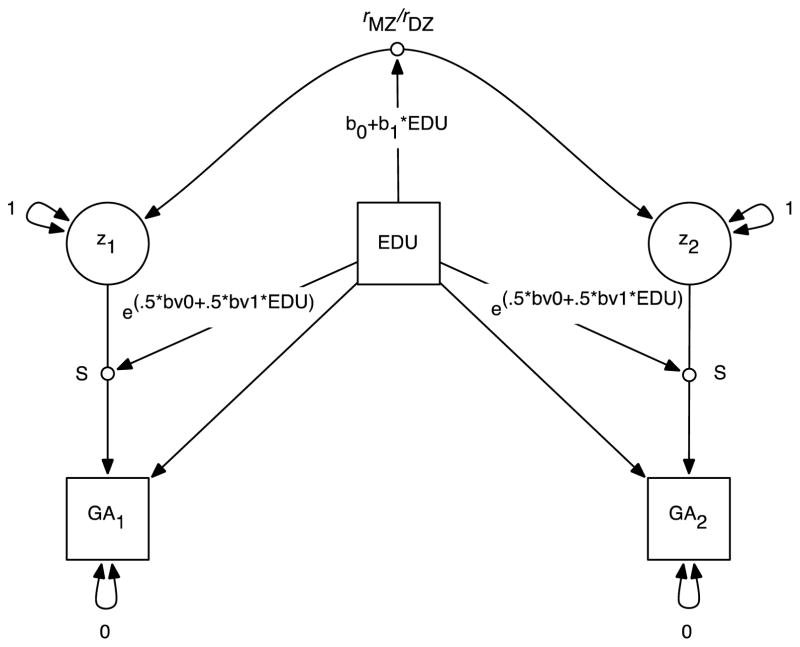
We then proceeded to model the MZ and DZ twin correlations as a function of mid-parent education. The model, which we refer to as a modified twin-correlation model, is illustrated in Figure 5. The model differs in some ways from the classic Purcell (Purcell, 2002) model that has become the standard in the field. First of all, for the time being we focus on the twin correlations themselves rather than the ACE parameters that can be derived from them, for reasons that will become apparent in a moment. Secondly, we constructed the model to separate the heteroscedasticity in phenotypic variance we have already observed from the twin correlations that are the main object of the model. In Figure 5, s is the standard deviation of twin GA, and Z is a latent variable that standardizes GA to a mean of 0 and a standard deviation of 1. The MZ and DZ covariances are therefore correlations. As in the Purcell model, we included a main effect of mid-parent education on child GA. We then fit a single log-linear model of mid-parent education to the phenotypic variance in the MZ and DZ twins to account for the phenotypic heteroscedasticity1, and separate linear models of mid-parent education to the MZ and DZ twin correlations to detect changes in twin correlations as a function of mid-parent education.
Figure 5.
Modified twin-correlation model. GA1 = twin 1 general ability score; GA2 = twin 2 general ability score; z1 = twin 1 latent GA score; z2 = twin 2 latent GA score; EDU = mid-parent education level; S = random effect of latent GA on observed GA in standard deviation units; rMZ/rDZ = MZ and DZ twin GA correlations, respectively, moderated by mid-parent education level.
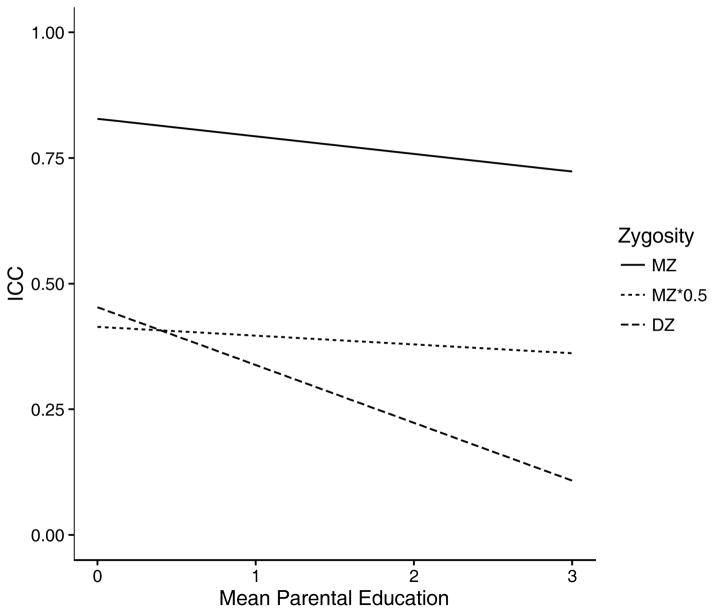
Results are in Table 1. Child GA was linearly related to mid-parent education, and variance was significantly reduced at higher levels of mid-parent education. Both MZ and DZ twin correlations showed linear decreases with increasing mid-parent education, although the slope was substantially larger in the DZ twins. [MZ: slope = −.04 (.02); DZ: slope=−.12 (.04)]. The modeled twin correlations are illustrated in Figure 6.
Table 1.
Maximum likelihood estimates from modified twin-correlation model with mid-parent education level moderator
| b0 | SE | b1 | SE | |
|---|---|---|---|---|
| Main Effect of Education | ||||
| Education | 5.18 | 0.04 | 0.92 | 0.04 |
|
| ||||
| Moderation by Education | ||||
| log(σ2GA) | 1.11 | 0.03 | −0.22 | 0.04 |
| rMZ | 0.83 | 0.01 | −0.04 | 0.02 |
| rDZ | 0.45 | 0.03 | −0.12 | 0.04 |
Notes. Intercept (b0) and slope (b1) of log(σ2GA) estimated in Mplus 7.4 by calculating e(b0 + b1*EDU).
Figure 6.
Line plot of MZ and DZ intraclass correlation coefficients. ICCs modeled as a function of the intercept and slope of mid-parent education level. MZ*0.5 = ICCs exactly one-half of the MZ correlations.
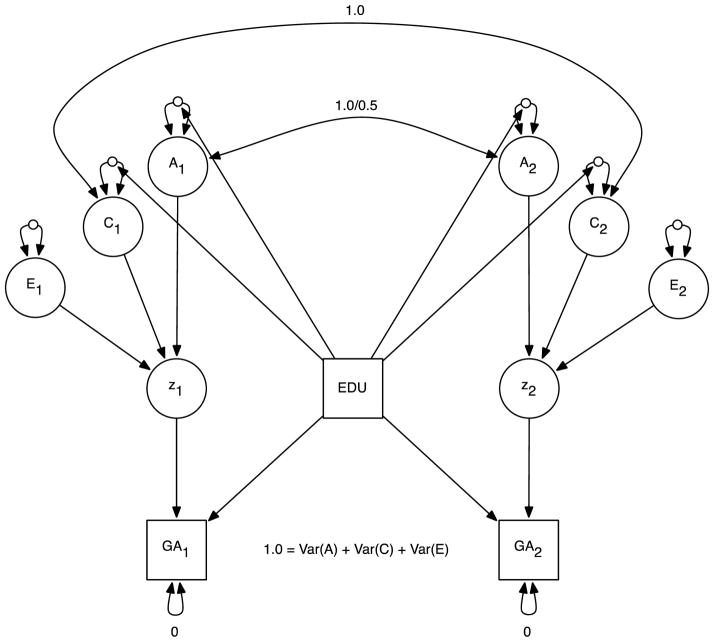
We then fit a model in which the MZ and DZ correlations were parameterized as the ACE parameters from the classic twin model. The model is illustrated in Figure 6. Rather than modeling the raw MZ and DZ correlations as in the previous model, they were reparameterized to ACE variances that were constrained to sum to 1.0. As the ACE parameters were variance components and therefore non-negative, we modeled them as log-linear functions of parental education. Results are in the top half of Table 2. To our surprise, although the previous model had demonstrated that the gap between the MZ and DZ twin correlations increases with mid-parent education, the ACE model showed no indication of an interaction between mid-parent education and either A or C.
Table 2.
Maximum likelihood estimates from Purcell gene-by-environment interaction model with mid-parent education level moderator
| b0 | SE | b1 | SE | |
|---|---|---|---|---|
| Moderation by Education | ||||
| No Negative Variances | ||||
| Education | 5.16 | 0.04 | 0.95 | 0.05 |
| A | 0.89 | 0.03 | 0.004 | 0.01 |
| C | 0.17 | 0.15 | −0.02 | 0.06 |
| log(σ2GA)/E | 1.11 | 0.03 | −0.20 | 0.04 |
|
| ||||
| Moderation by Education | ||||
| Allow Negative Variances | ||||
| Education | 5.18 | 0.04 | 0.92 | 0.04 |
| A | −0.26 | 0.07 | 0.10 | 0.06 |
| C | 0.06 | 0.05 | −0.12 | 0.06 |
| log(σ2GA)/E | 1.11 | 0.03 | −0.22 | 0.04 |
Notes. Intercept (b0) and slope (b1) of log(σ2GA)/E estimated in Mplus 7.4 by calculating e(b0 + b1*EDU).
A re-examination of Figure 5 suggests why this apparent contradiction occurs. The lightly dotted line in Figure 5 shows correlations that are exactly half of the MZ correlation. For most of the range of mid-parent education the DZ correlation is below this line, thus violating the assumptions of the classical twin model. Constraining C to be positive therefore disallows most of the parameter space in which the interaction was detected in the twin correlations. If one removes this constraint (by modeling the ACE variances linearly instead of exponentially) the interaction is once again present, with significant declines in C as a function of mid-parent education, as shown in the lower half of Table 2.
Distribution of Education and Censoring of GA Scores
Although the modified Purcell model we have used accounted for continuous changes in the variance of GA as a function of parental education, it does not address the root cause of the heteroscedasticity, which is that increasing cognitive ability over time led to a ceiling effect in the measurement of GA, as shown in Figure 4. The model also treated parental education as continuous, when it was in fact measured discretely, using four categories for each parent; moreover, the distribution of parental education was highly skewed, with most parents in the first (lowest) education category.
We therefore conducted a separate set of models to address these difficulties directly. Mplus includes methods for tobit modeling of censored variables (Waller & Muthen, 1992). Declaring GA as right censored, we computed the between and within pair variances of GA, and used these to estimate the intraclass correlations for GA. In addition, instead of characterizing parental education as a pseudo-continuous moderator, we computed the ICCs separately for the four levels of parental education and for MZ and DZ pairs (2 zygosity groups x 4 parental education groups = 8 ICCs), and used the MZ and DZ ICCs to estimate A and C components at each level of parental education. Finally, we computed linear trends over the MZ and DZ ICCs and the A and C components (without constraining C to be positive). For the MZ and DZ ICCs for the four levels of parental education (ICCMZ1 − ICCMZ4) we computed the linear trend using the usual contrast coefficients:
Finally, we tested the significance of the A and C linear trends using a Wald test with two degrees of freedom.
Results of the analysis are given in Table 3. The table shows the within, between and total pair variances for MZ and DZ twins at the four levels of parental education. For comparison, we also show the total variances for a model that does not account for right censoring of GA. The table then shows the estimated ICCs from the censored model, along with the resulting standardized A and C components, without constraining them to be greater than zero or less than one.
Table 3.
Results from right-censored models using discrete parental education
| MZ | DZ | Model Parameters | |||||||||||||
|---|---|---|---|---|---|---|---|---|---|---|---|---|---|---|---|
|
| |||||||||||||||
| Between | Within | ICC | Total | Uncorrected | N | Between | Within | ICC | Total | Uncorrected | N | A | C | ||
| Mid Parent Edu | 1 | 2.44 | 0.54 | 0.82 | 2.98 | 2.16 | 602 | 1.48 | 1.68 | 0.48 | 3.16 | 3.13 | 936 | 0.68 | 0.14 |
| 2 | 1.82 | 0.43 | 0.81 | 2.25 | 2.15 | 195 | 0.97 | 1.70 | 0.36 | 2.68 | 2.55 | 288 | 0.90 | −0.09 | |
| 3 | 1.73 | 0.58 | 0.75 | 2.31 | 1.83 | 37 | 1.27 | 1.75 | 0.42 | 3.04 | 2.50 | 37 | 0.66 | 0.09 | |
| 4 | 1.44 | 1.15 | 0.56 | 2.59 | 1.53 | 31 | 0.08 | 2.93 | 0.03 | 3.01 | 1.53 | 37 | 1.06 | −0.50 | |
Comparing the total variances across the four education levels, it is apparent that controlling for censoring mitigated most of the heteroscedasticity in the variances. The linear trends for A (.853, SE=1.439) and C (−1.70, SE=2.55) are in the expected direction but not statistically significant. The Wald test of the hypothesis that both the A and C linear trends are 0 was significant (chi-square = 8.16, 2 df, p = .016), suggesting that either A or C or both is changing linearly across education levels, but we are unable to determine which. The analysis also makes clear, once again, that the effect arises only on the level of the twin correlations, or alternately only if one is willing to allow the A and C parameters to deviate from the parameter space permitted by the classical twin model. It also makes clear that most of the effect arises in the highest education group, in which both the MZ and DZ ICCs, and especially the latter, are greatly reduced.
Cohort Analysis
The Norwegian sample included conscripts from a long period, with participants born between 1931 and 1960. Year of birth was correlated with the variables of interest: 0.16 with cognitive ability, 0.11 with paternal education and .15 with maternal education. We fit a model similar to the twin-correlation model above, using year of birth rather than mid-parent education as the modifier. Although the results, given in Table 4, were similar to the parental education results (slight negative slope of MZ correlation on birth year, stronger negative slope of DZ correlation on birth year) neither slope nor a simultaneous combination of the two reached statistical significance.
Table 4.
Maximum likelihood estimates from modified twin-correlation model with birth year as the moderator
| b0 | SE | b1 | SE | |
|---|---|---|---|---|
| Main Effect of Education | ||||
| Birth Year | 4.75 | 0.09 | 0.33 | 0.04 |
|
| ||||
| Moderation by Education | ||||
| log(σ2GA) | 1.42 | 0.06 | −0.13 | 0.03 |
| rMZ | 0.85 | 0.02 | −0.004 | 0.01 |
| rDZ | 0.56 | 0.05 | −0.04 | 0.03 |
Notes. Intercept (b0) and slope (b1) of log(σ2GA) estimated in Mplus 7.4 by calculating e(b0 + b1*EDU).
Discussion
Our analysis confirms the footnote in Bronfenbrenner & Ceci (1994): there appears to be a significant interaction between mid-parent education and MZ and DZ twin correlations for GA, although the particulars of the interaction turn out to be considerably more complex than was apparent when the observation was originally made. Both MZ and DZ twin correlations show significant linear declines as a function of mid-parent education, the decline is steeper in the DZ twins. One would therefore expect A to increase and C to decrease as a function of mid-parent education, but on a first examination this does not appear to happen. Further examination reveals that the reason is that DZ twin correlations rapidly decrease beyond the limitations of the classical twin model, so the positivity constraints on the ACE variances obscure the clear result for the twin correlations.
Our results are of some interest because previous analyses have not found a heritability by environmental quality interaction in samples from outside the United States (e.g., (van der Sluis, Willemsen, de Geus, Boomsma, & Posthuma, 2008); (Bates, Hansell, Martin, & Wright, 2016)). One way that our sample is different from other European samples is that it is from much longer ago, including pre-war data from families with quite poorly educated parents. One difficulty faced by modern European studies of this kind is that there is no longer a great deal of variability in socioeconomic status, particularly for education. Another possibility that is worth investigating is whether the same phenomenon that happened here—low DZ twin correlations that violate the assumptions of the ACE model and obscure the interaction when the analysis is conducted in terms of all-positive ACE parameters—may have occurred in some of the negative European reports, which have only reported their results in terms of ACE. We would encourage other investigators to include descriptions of their results in terms of the MZ and DZ twin correlations so these possibilities could be considered.
It should also be noted that the current study has significant limitations. In particular, the measurement of parental education and GA are both coarse, on four- and ten-point scales, respectively. Parental education is highly skewed, and the sample sizes at the upper levels are small. Reliable detection of interactions is always problematic, especially in the presence of skew and non-linearity (Eaves, 2006). No ability data are available for the parents or other relatives. Only cross-sectional data, from a single country at a single age and only for males, are included, and no other data on the rearing environments are available.
Twin correlations that violate the classical twin model are not uncommon, and there are many available ways to adjust the model to take such violations into account. One could, for example, make a post hoc decision to employ an ADE model, or speculate about epistatic effects that might tend to inflate MZ correlations relative to DZ. Alternatively, some of us (Beam & Turkheimer, 2013) and others (Dolan et al, 2014) have explored a class of models that routinely produce DZ twin correlations that decline rapidly with age and quickly lead to DZ correlations that are less than half the MZ correlation. These models, called reciprocal effects models or P => E (phenotype to environment) models, are used to show how people’s exposure to environments (either randomly or systematically) can trigger a recursive process between individuals and their subsequent environmental exposure. Individuals will select environments suited to their ability level and these environments in turn reinforce their ability level. There are two statistical consequences of P=>E models: first, gene-environment correlation - the statistical phenomenon of nonrandom exposure to environments based on differences in genotype - increases over time; and second, nonshared environmental factors become increasingly stable over time.
Estimation of P=>E models requires age-matched pairs with varying degrees of genetic and environmental difference within pairs. Pairs with greater differences (unrelated pairs compared to DZ pairs or DZ pairs compared to MZ pairs) should diverge in their similarity more quickly than pairs with fewer differences, as each selects environments that are better suited for their observed ability level. Subsequent selection of and reinforcement by future environments, in turn, will cause pairs to diverge even more over time. In P=>E models, gene-environment correlation rather than gene-by-environment interaction causes DZ twins to decline more rapidly than MZ twins.
In the final analysis, we would argue that the tendency for MZ and DZ twin correlations to violate the constraints of the classical twin model constitutes a good reason to focus analyses on the twin correlations themselves, leaving for a later time speculation or empirical analysis about how the twin parameters might be reparameterized in terms of quantitative genetics. More informed analysis of the best biometric parameterizations of data of this kind may become possible when more than simple twin data are available, longitudinal data allow careful analysis of change within and between pairs, or when DNA or other biological data have been collected to help inform speculation about alternative genetic models. In the meantime, it should be remembered that twin correlations are interesting in and of themselves, and if anything are closer to the actual phenomenon of interest (in this case the intellectual development of young people) than the ACE models we routinely impose on them.
Figure 7.
Purcell GxE interaction model. GA1 = twin 1 general ability score; GA2 = twin 2 general ability score; z1 = twin 1 latent GA score; z2 = twin 2 latent GA score; EDU = mid-parent education level. Open circles indicate random effects. GA scores are standardized so that the ACE variance components total 1.0.
Footnotes
The .5 terms in the exponential expressions for the variance are included because s1 and s2 represent the standard deviations of GA, not the variances.
Contributor Information
Eric Turkheimer, University of Virginia.
Christopher R. Beam, University of Southern California
Jon Martin Sundet, University of Oslo.
Kristian Tambs, Norwegian Institute of Public Health.
References
- Bates TC, Hansell NK, Martin NG, Wright MJ. Intelligence When does socioeconomic status (SES) moderate the heritability of IQ? No evidence for g × SES interaction for IQ in a representative sample of 1176 Australian adolescent twin pairs. Intelligence. 2016;56:10–15. http://doi.org/10.1016/j.intell.2016.02.003. [Google Scholar]
- Beam CR, Turkheimer E. Phenotype-environment correlations in longitudinal twin models. Development and Psychopathology. 2013;25(2013):7–16. doi: 10.1017/S0954579412000867. http://doi.org/10.1017/S0954579412000867. [DOI] [PMC free article] [PubMed] [Google Scholar]
- Bronfenbrenner, Ceci Nature-nurture reconceptualized in developmental perspective: a bioecological model. Psychological Review. 1994;101(4):568–586. doi: 10.1037/0033-295x.101.4.568. [DOI] [PubMed] [Google Scholar]
- Dolan, et al. GE Covariance Through Phenotype to Environment Transmission: An Assessment in Longitudinal Twin Data and Application to Childhood Anxiety. Behavior Genetics. 2014;44:240–253. doi: 10.1007/s10519-014-9659-5. http://doi.org/10.1007/s10519-014-9659-5. [DOI] [PMC free article] [PubMed] [Google Scholar]
- Eaves LJ. Genotype × Environment Interaction in Psychopathology: Fact or Artifact? Twin Research and Human Genetics. 2006;9(1):1–8. doi: 10.1375/183242706776403073. http://doi.org/10.1375/183242706776403073. [DOI] [PubMed] [Google Scholar]
- Fischbein IQ and social class. Intelligence. 1980;4(1):51–63. [Google Scholar]
- Hansen . Forsvarets institutt for ledelse. 2006. Contributions to the history of the Psychological Services in the Norwegian Army (In Norwegian) [Google Scholar]
- Magnus, Nance, Berg Predicting zygosity in Norwegian twin pairs born 1915–1960. Clinical Genetics. 1983;24(2):103–112. doi: 10.1111/j.1399-0004.1983.tb02220.x. [DOI] [PubMed] [Google Scholar]
- Muthén LK, Muthén BO. Mplus statistical analysis with latent variables: user’s guide. Los Angeles: 2015. [Google Scholar]
- Notes from the Psychological Services of the Norwegian Armed Forces. (1956). Oslo.
- Purcell Variance Components Models for Gene – Environment Interaction in Twin Analysis. Twin Research. 2002;5(6):554–571. doi: 10.1375/136905202762342026. [DOI] [PubMed] [Google Scholar]
- ROWE DAVIDC, Jacobson KV, den O. Genetic and Environmental Influences on Vocabulary IQ: Parental Education Level as Moderator. Child Development. 1999;70(5):1151–1162. doi: 10.1111/1467-8624.00084. [DOI] [PubMed] [Google Scholar]
- Scarr Race, social class, and IQ. Science. 1971;174(4016):1285–1295. doi: 10.1126/science.174.4016.1285. [DOI] [PubMed] [Google Scholar]
- Sundet, Eilertsen, Tambs, Magnus No differential heritability of intelligence test scores across ability levels in norway. Behavior Genetics. 1994;24(4):337–339. doi: 10.1007/BF01067534. [DOI] [PubMed] [Google Scholar]
- Sundet, Tambs, Magnus, Berg On the Question of Secular Trends in the Heritability of Intelligence Test Scores: A Study of Norwegian Twins. Intelligence. 1988;12:47–59. [Google Scholar]
- Tambs, Sundet, Magnus GENETIC AND ENVIRONMENTAL EFFECTS ON THE COVARIANCE STRUCTURE OF THE NORWEGIAN ARMY ABILITY TESTS. Personality and Individual Differences. 1988;9(4):791–799. [Google Scholar]
- Tucker-drob EM, Bates TC. Large Cross-National Differences in Gene × Socioeconomic Status Interaction on Intelligence. 2015 doi: 10.1177/0956797615612727. http://doi.org/10.1177/0956797615612727. [DOI] [PMC free article] [PubMed]
- Turkheimer E, Haley A, Waldron M, Onofrio BD, Gottesman II. SOCIOECONOMIC STATUS MODIFIES HERITABILITY OF IQ. Psychological Science. 2003;14(6):623–629. doi: 10.1046/j.0956-7976.2003.psci_1475.x. [DOI] [PubMed] [Google Scholar]
- Turkheimer E, Horn EE. Interactions Between Socioeconomic Status and Components of Variation in Cognitive Ability. 2012 http://doi.org/10.1007/978-1-4614-7447-0.
- van der Sluis S, Willemsen G, de Geus EJC, Boomsma DI, Posthuma D. Gene-environment interaction in adults’ IQ scores: Measures of past and present environment. Behavior Genetics. 2008;38(4):348–360. doi: 10.1007/s10519-008-9212-5. http://doi.org/10.1007/s10519-008-9212-5. [DOI] [PMC free article] [PubMed] [Google Scholar]
- Waller NG, Muthen BO. Genetic Tobit factor analysis. Quantitative genetic modelling with censored data. Behavioral Genetics. 1992;22(3):265–292. doi: 10.1007/BF01066662. [DOI] [PubMed] [Google Scholar]


