

Abstract
Currently, molecular markers are not used when determining the prognosis and treatment strategy for patients with hepatocellular carcinoma (HCC). In the present study, we proposed that the identification of common pro‐oncogenic pathways in primary tumors (PT) and adjacent non‐malignant tissues (AT) typically used to predict HCC patient risks may result in HCC biomarker discovery. We examined the genome‐wide mRNA expression profiles of paired PT and AT samples from 321 HCC patients. The workflow integrated differentially expressed gene selection, gene ontology enrichment, computational classification, survival predictions, image analysis and experimental validation methods. We developed a 24‐ribosomal gene‐based HCC classifier (RGC), which is prognostically significant in both PT and AT. The RGC gene overexpression in PT was associated with a poor prognosis in the training (hazard ratio = 8.2, P = 9.4 × 10⁻⁶) and cross‐cohort validation (hazard ratio = 2.63, P = 0.004) datasets. The multivariate survival analysis demonstrated the significant and independent prognostic value of the RGC. The RGC displayed a significant prognostic value in AT of the training (hazard ratio = 5.0, P = 0.03) and cross‐validation (hazard ratio = 1.9, P = 0.03) HCC groups, confirming the accuracy and robustness of the RGC. Our experimental and bioinformatics analyses suggested a key role for c‐MYC in the pro‐oncogenic pattern of ribosomal biogenesis co‐regulation in PT and AT. Microarray, quantitative RT‐PCR and quantitative immunohistochemical studies of the PT showed that DKK1 in PT is the perspective biomarker for poor HCC outcomes. The common co‐transcriptional pattern of ribosome biogenesis genes in PT and AT from HCC patients suggests a new scalable prognostic system, as supported by the model of tumor‐like metabolic redirection/assimilation in non‐malignant AT. The RGC, comprising 24 ribosomal genes, is introduced as a robust and reproducible prognostic model for stratifying HCC patient risks. The adjacent non‐malignant liver tissue alone, or in combination with HCC tissue biopsy, could be an important target for developing predictive and monitoring strategies, as well as evidence‐based therapeutic interventions, that aim to reduce the risk of post‐surgery relapse in HCC patients.
Keywords: adjacent non‐malignant tissue, co‐transcription, hepatocellular carcinoma, personalized prognostic biomarkers, primary tumor, ribosome gene
Abbreviations
- 1‐D DDg
one‐dimensional data‐driven grouping
- AFP
α fetal protein
- AT
adjacent non‐malignant tissue
- BCLC classification
Barcelona clinic liver cancer classification
- CI
confidence interval
- CPG
common prognostic gene(s)
- DEG
differentially expressed gene(s)
- FA/GO
Functional Annotation and Gene Ontology
- HBV
hepatitis B virus
- HCV
hepatitis C virus
- HCC
hepatocellular carcinoma
- IHC
immunohistochemistry
- LCI
Liver Cancer Institute
- OS
overall survival
- PT
primary tumor
- RGC
ribosomal gene classifier
- SVR
support vector regression
- SWVg
statistically weighted voting grouping
- TER
translation elongation and ribosomal
- TNM
tumor, node and metastasis
1. Introduction
Hepatocellular carcinoma (HCC) ranks fifth among solid tumors and causes 70 000 annual deaths worldwide. It is the third leading cause of cancer‐related mortality in males and is most prevalent in Asia and Africa. Unlike many solid tumors, the incidence and mortality of HCC have increased over the past decade (Ashtari et al., 2015). The absence or substantial progress of effective HCC therapies is indicated by the mortality rate, which is equivalent to the incidence rate in most countries (Bruix and Sherman, 2011).
Notable disease treatment challenges include the high heterogeneity of the primary tumor (PT) and the pathophysiological status of the adjacent non‐malignant tissue (AT), which affects 70% of patients after resection or local ablation (Llovet et al., 2005).
Recent studies of various cancers (including HCC) have incorporated global molecular profiling using various ‘omics’ platforms (Wang et al., 2015a). These studies have enabled the development of multiple multigene prognostic biomarkers for stratifying cancer patients into risk subgroups that are relevant for potential treatments (Hoshida et al., 2012). Compared to several other cancers (e.g. breast, prostate and hematological), the molecular markers are not used for the diagnosis or determination of prognosis and treatment for HCC patients. Thus, evidence‐based molecular markers that could accurately and reproducibly predict survival time and response to treatment must be identified (Bruix et al., 2016).
However, in this respect, significant challenges might reflect certain caveats: (a) poor clinical reproducibility (e.g. when a biomarker fails in an independent cohort validation) and/or poor genetic reproducibility (e.g. different enriched gene sets/deregulated pathways in an independent validation cohort), which limits or confounds the clinical and therapeutic utility of the biomarker, and (b) high diversity in the genetic status and high technical (e.g. different ‘omics’ platforms) and/or clinicopathological cross‐cohort variability from independent clinical centers. To overcome these obstacles, a workflow for biomarker selection that identifies the most etiologically and pathobiologically essential genes, gene products and biological processes with high reproducibility and prognostically confident molecular patterns is needed.
It has been reported that AT substantially contributes to HCC and has an independent prognostic value (Hoshida et al., 2008), presumably reflecting the de novo multicentric occurrence of HCC in cirrhotic tissue, which impacts late HCC recurrence (> 2 years recurrence‐free survival). Alternatively, PT cells that remain after resection can disseminate across the AT of specific HCC patients to contribute to early HCC recurrence (≤ 2 years of recurrence‐free survival) (Hoshida et al., 2008). However, the relationships between the PT and AT can be more complex.
A resurging interest in cancer cell and host tissue interactions, including metabolism, biogenesis and secreted metabolites, metabolic reprogramming in the systemic modulating of gene expression, and signaling pathways in joint cancer‐host tissue compartments, has been observed in recent years. According to the ‘field cancerization’ model (Vauthey et al., 2000), pathological and genetic changes in tissues peripheral to a tumor could result from ‘preconditioning’ of the affected organ by various carcinogenic agents. For example, most HCC arise in the background of chronic liver disease [e.g. hepatitis B virus (HBV) or hepatitis C virus (HCV) infection, hepatitis and cirrhosis]. After the surgical resection of PT in the absence of effective therapy of the background medical condition(s), the significant probability of the appearance and development of tumor(s) in field cancerization may be similar to those that prompt the primary HCC.
Alternatively, PT cell growth and progression can modulate the host tissue metabolic pathways and induce epigenetic reprogramming in AT (Skill et al., 2011). These changes often lead to tumor‐like functional modulations of the gene expression profiles in non‐malignant tissue cells (Lou et al., 2009). For example, the DNA methylation status of a tumor suppressor regulatory signal(s) in the AT can not only be distinct from that of the normal (Arai et al., 2009) and cirrhotic liver tissues of non‐HCC individuals, but also similar to that of the PT (Lou et al., 2009). In addition, multiple metabolic coupling between PT and AT has been described. Experimental models have been developed (Shapot and Potapova, 1986; Shapot et al., 1972) of tumor–host tissue metabolic relationships demonstrating the competition of the tumor and host tissues for RNA precursors and other metabolites. These studies also characterized a phenomenon of the tumor capacity to act as ‘a trap’ for nitrogen and glucose, leading to tumor‐like host cell metabolism and host tissue metabolic ‘assimilation’ peculiarities in glycolysis and RNA biosynthesis.
Cell–cell interactions, external regulatory signaling factors and the active transport of biomolecules that are secreted from PT via the exosomes/microvesicles may induce and maintain the specific tumor‐driven pro‐oncogenic biological processes and signaling pathways relevant to RNA biosynthesis and the ribosomal biogenesis in AT. We propose the presence of multiple tumor‐producing molecular signals, secreting factors and tumor‐induced external metabolite trapping processes that collectively establish tumor‐like common RNA biosynthesis and ribosome biogenesis patterns and specific steady‐state aberrant pathways in AT cells. The interactions between tumor and host tissue compartments assume the co‐microevolution of metabolic processes in AT and AT cell populations during the course of cancer cell metabolism, genetic and epigenetic alterations, cell growth, death and migration, clonal selection and other factors of tumor progression.
In an effort to identify HCC biomarkers, many studies have developed models of gene expression profiling to discover biomarkers either in PT or AT samples (Hoshida et al., 2012). Some studies have additionally used the differentially expressed genes (DEGs) between PT and AT as prognostic biomarkers at the prognostic variable pre‐selection step (Mah et al., 2014; Orimo et al., 2008). By contrast, in the present study, we hypothesize that the next‐generation prognostic biomarkers for HCC prognosis and prediction can be determined via the automatic selection of a subset(s) of co‐expressed survival significant genes in PT and AT pairs. This strategy uses the concepts of (a) field cancerization and (b) PT‐initiated biogenesis assimilation in AT compartments as systemically affected by aggressively growing PT compartments. To our knowledge, such an approach to tumor‐host tissue co‐evolution analysis has not been considered previously in the literature in the context of prognostic/predictive biomarker discovery and disease risk stratification.
We aimed to develop a prognostic biomarker discovery model that would (a) identify common pro‐oncogenic biological processes induced by aggressive PT growth in PT and AT and (b) select variables predicting HCC patient risks after curative resection. We suggested that the expression of potential prognostic genes pre‐selected in the cells of AT, as a non‐malignant cell population, was more genetically stable and less vulnerable to oncogenic reprogramming compared to the pre‐selected genes in the PT cell population. We also assumed that the identification of statistically enriched gene subsets/pathways/biological mechanisms consistent in AT and PT pairs is another important step toward further shortlisting the most biologically/pathologically essential gene candidates for biomarkers. We expected that the use of these two strict pathobiology‐based pre‐selection criteria would eliminate numerous indirectly correlated but non‐essential gene confounders with less or nonreproducible mechanistic functions and prognostic abilities.
In the present study, we specified both a genetic and metabolic preconditioning ‘field cancerization’ model in PT and AT and a PT‐like AT cell ribosomal biogenesis model. We analyzed the role of gene expression patterns in cancer predisposition and metabolism, coupling cancer and non‐malignant host tissues as an interconnected two‐compartmental tissue cell population system.
We developed a hypothesis‐driven HCC biomarker discovery and statistically‐based computationally prediction method. We selected a specific group of common prognostic genes (CPGs) co‐expressed in both PT and AT, generating HCC patient risk stratification into relatively favorable and unfavorable disease outcome subgroups. The CPG analysis enabled the identification of translation elongation and ribosomal (TER) gene subsets with common pro‐oncogenic prognostic patterns as the most over‐represented gene subsets in PT and AT. We showed how the data analysis, integrating paired PT and AT samples, identified the HCC prognostic ribosomal gene classifier (RGC). This prognostic classifier demonstrated high confidence, robustness and reproducibility across the studied cohorts and identified the clinically and pathobiologically reproducible low‐ and high‐risk patient subgroups with thoroughly characterized and druggable deregulated biological pathways. In summary, these results highlight the importance of the deregulation of the TER pathway in HCC, comprising the essential pathological feature common to PT and AT. We discuss the clinical perspectives of these findings and the potential applications of these tools and also propose a novel strategy for the identification of uniformly co‐regulated, pathway‐specific, statistically reliable and reproducible prognostic biomarkers.
2. Materials and methods
2.1. HCC patients and tissue samples
We retrospectively analyzed the hepatic tissue samples of HCC patients from Singapore, which were collected after surgical treatment with informed consent from the patients. The patients underwent radical resection and follow‐up between 2000 and 2013 at Singapore General Hospital, and their hepatic tissue samples were collected at the National Cancer Centre of Singapore/SingHealth Tissue Repository. HCC diagnosis and treatment for the HCC patients were based on established histological criteria (International Working Party, 1995). After surgical treatment, patients were followed up at least once every 3–6 months. Other post‐surgery patient treatments included imaging and α fetal protein (AFP) monitoring on each follow‐up. The Singapore HCC cohort (Singapore cohort) presented here included only HCC patients diagnosed with resectable HCC, with good liver function (Child status A or B), adequate future liver remnant and good general health. The HCC patients with unresectable lesions with poor liver function or general health (Chow et al., 2016) were excluded from the analysis. Linked clinical and histopathology data collected from the patient medical records were rendered anonymous. The study was approved by the SingHealth Institutional Review Board. Cost and practical issues restricted the primary sample size in the present study to 125 HCC patients. PT and AT liver samples obtained at the time of definitive surgery were snap‐frozen and preserved at –80 °C. The inclusion of matching AT samples in the study was based only on the availability of the samples from the SingHealth Tissue Repository and satisfactory results of RNA and microarray quality control. A paired sample design was used and clinical data were available for analysis only after re‐identification of the RNA samples and full completion of microarray profiling.
Median follow‐up in the Singapore cohort was 1.17 years. The detailed patient and tumor features of the Singapore and the Liver Cancer Institute (LCI) cohorts are presented in Tables 1 and S1.
Table 1.
Clinicopathological characteristics in HCC patients’ cohorts used in the present study
| Clinical characteristic | Singapore (training) (n = 115)a | LCI (validation) (n = 206)a | P‐value | |
|---|---|---|---|---|
| 1 | HBV infection (yes/no/–/%) | 53/43/19/46 | 187/4/15/91 | < 0.001d |
| 2 | HCV infection (yes/no/–/%) | 20/36/59/18 | – | – |
| 3 | Sex, male (yes/no/%) | 93/22/81 | 183/23/89 | 0.06d |
| 4 | Age (years) (≥50/<50/median) | 104/11/64 | 120/86/51 | < 0.001d |
| 5 | AFP (> 300 ng·mL−1/≤ 300 ng·mL−1/–/%) | 42/68/5/37 | 94/109/3/46 | 0.12 |
| 6 | Cirrhosis (yes/no/%) | 62/53/54 | 189/17/92 | < 0.001d |
| 7 | Multinodular/solitary tumors (yes/no/%) | 26/89/23 | 40/166/19 | 0.5d |
| 8 | Tumor size (> 5 cm/≤ 5 cm/%) | 65/50/57 | 71/134/34 | < 0.001d |
| 9 | Total nodules (yes/%)b | |||
| 1 | 89/77 | – | – | |
| 2–7 | 16/14 | – | – | |
| > 7 | 10/9 | – | – | |
| 10 | Microscopic vascular invasion (yes/no/%) | 45/70/39 | – | – |
| 11 | Albumin Child points (yes/%)c | |||
| 1 point | 74/64 | – | – | |
| 2 points | 34/30 | – | – | |
| 3 points | 7/6 | – | – | |
| 12 | Bilirubin Child points (yes/%)c | |||
| 1 point | 107/93 | – | – | |
| 2 points | 7/6 | – | – | |
| 3 points | 0/0 | – | – | |
| 13 | Child‐Pugh status (yes/%) | |||
| Child‐Pugh A | 101/88 | – | – | |
| Child‐Pugh B | 13/11 | – | – | |
| Child‐Pugh C | 1/1 | – | – | |
| 14 | Milan criteria (beyond/within/%) | 75/40/65 | ||
| 15 | Edmondson tumor grade (3, 4/1, 2/–/%)c | 62/50/3/53 | – | – |
| 16 | Platelets score (> 100/≤ 100/%) | 108/7/94 | – | – |
| 17 | Metastasis(imaging) (yes/no/–/%) | 2/110/3/2 | – | – |
| 18 | Presence of tumor capsule (yes/no/–/%) | 40/66/9/34 | – | – |
| 19 | Extra‐hepatic invasion(histology) (yes/no/%) | 1/114/1 | – | – |
| 20 | Portal vein invasion (yes/no/–/%) | 8/102/5/7 | – | – |
| 21 | Positive tumor margins (yes/no/%) | 12/103/10 | – | – |
| 22 | BCLC staging (yes/%) | |||
| 0 | 4/3 | 17/8 | 0.1d | |
| A | 75/65 | 133/65 | 0.8d | |
| B | 27/23 | 19/9 | < 0.001d | |
| C | 9/8 | 22/11 | 0.3d | |
| – | 0/0 | 15/7 | – | |
| 23 | TNM staging (II–IV/I/–/%) | 58/56/1/50 | 105/86/15/51 | 0.9d |
| 24 | Median follow‐up (OS), years (25–75th percentile) | 1.17 (0.45–3.12) | 4.36 (1.36–4.80) | < 0.001e |
| 25 | Overall death, n (%) | 25 (22) | 80 (39) | 0.002d |
Number of patients/percentage.
Total nodules, based on histology report, including satellite nodules.
Albumin Child points, Child‐Pugh Category score: 1 point = > 35 g·L−1; 2 points = 28–35 g·L−1; 3 points = < 28 g·L−1; Bilirubin Child points, Child‐Pugh Category score: 1 point = < 34.2 μmol·L−1; 2 points = 34.2–51.3 μmol·L−1; 3 points = > 51.3 μmol·L−1; Edmondson tumor grade: 1 = Grade 1; 2 = Grade 2; 3 = Grade 3; 4 = Grade 4. –, missing data.
Fisher's exact test (two‐sided).
Mann–Whitney test.
2.2. Study design and endpoint
The pressent study complied with the recommendations for reporting prognostic cancer biomarkers according to the REMARK statement (McShane et al., 2005) (Table S2) and the guidelines for evaluating prognostic biomarkers (Simon et al., 2009). The prognostic biomarker(s) demonstrated certain traits: (a) significant prognostic power in the training and validation sample sets; (b) statistically independent prognostic value in a multivariate analysis that included known clinicopathological predictive variables; and (c) significant predictive power confirmed in an external cohort reported by independent investigators using the same technology. The primary endpoint of the study was the patient overall survival (OS). OS was defined as the time between surgical resection and death of any cause at last follow‐up. Other measures of patient benefits from use of prognostic biomarkers, such as disease‐free or recurrence‐free survival, were not used because they are surrogate to OS and may not always translate to longer OS (Goh et al., 2016; Llovet et al., 2008a). Additionally, OS proved to be useful in large and successful targeted drug therapy trials of HCC (Llovet et al., 2008b).
2.3. Patient tissue sample processing, gene expression microarrays and quantitative RT‐PCR analysis methods
All tissue samples were uniformly homogenized using a TissueLyser LT from Qiagen (Germantown, MD, USA) in accordance with the manufacturer's instructions. RNA isolation was performed for all tissue lysates. Sample preparation and hybridization of labeled cRNA to the HumanHT‐12 v4 Expression BeadChip arrays (Illumina, Inc., San Diego, CA, USA) were conducted in accordance with the manufacturer's instructions. Data from 10 patients were excluded as a result of low RNA or microarray preparation quality (Kauffmann et al., 2009). Finally, we used 115 PT samples and 52 AT samples matched to 52 corresponding PT. After the completion of RNA and microarray quality control, the included samples were matched to corresponding clinical data and re‐identified before data analysis. The quantitative PCR experiments were conducted using a QuantStudio™ 6 Flex Real‐Time PCR system in accordance with the standard instructions for Power SYBR Green master mix from ABI systems (Applied Biosystems, Foster City, CA, USA). The qRT PCR signals were normalized with standard reference TBP and relative fold change abundances for desired genes were estimated.
The microarray data for the gene expression profiling of the HCC patient samples are publicly available at GEO: GSE76427. As a validation HCC cohort, we used publicly available data for the 206 HCC patients from the Liver Cancer Institute (the LCI HCC cohort, Fudan University, Shanghai, China, GSE14520) (Roessler et al., 2012) that passed the same microarray quality assessment (Kauffmann et al., 2009). We selected the LCI dataset for the Singapore data analysis validation because (a) the LCI group is a relatively large publicly available gene expression dataset (includes 206 paired PT–AT samples); (b) clinical data including patient survival data have been available for these 206 patients, allowing survival prediction analysis for the PT‐AT paired expression dataset to be carried out; (c) Singapore and LCI datasets include mostly Chinese/Asian patients; and (d) patients in both groups have a predominantly HBV‐driven ethology, which potentially could result in deregulated molecular pathways distinct from other available patients groups with predominantly HCV‐driven HCC.
2.4. Immunohistochemical staining of formalin‐fixed paraffin‐embedded samples
DKK1 protein expression was determined using a DKK1 antibody (ab61034; Abcam, Cambridge, MA, USA) in liver FFPE tumor sections from six HCC patients and the RGC risk subgroups (HRT and LRT) in accordance with a standard immunohistochemistry (IHC) protocol. Automated hematoxylin and diaminobenzidine staining (IHC DAB1 Leica Bond III) using a Leica Bond III Automated Stainer (Leica Biosystems, Wetzlar, Germany) was performed using the protocol: (a) dewaxing; (b) pretreatment; and (c) IHC staining. The dewaxing step was performed at 72 °C, followed by pretreatment (unmasking) with the Bond epitope retrieval 2 (ER2) solution, with washing steps being performed using absolute alcohol and Bond Wash Solution. IHC staining was performed using the primary antibody and the Bond™ Polymer Refine Detection kit (Leica Biosystems) was used for subsequent detection. After staining, the slides were dehydrated in absolute alcohol, cleaned with xylene and mounted with DEPEX mounting media (WVR International, Radnor, PA, USA).
2.5. Statistical and bioinformatics analyses
To select the survival significant genes and to stratify patients into the relatively LR and HR HCC subgroups, we used the one‐dimensional data‐driven grouping (1‐D DDg) method that was previously developed and successfully used for survival prognosis (Chan et al., 2012; Grinchuk et al., 2015; Motakis et al., 2009).
We defined the CPG as the 1‐D DDg‐defined survival significant gene, and the expression value was binarized using a 1‐D DDg cut‐off value, with patients being stratified into low‐risk (LR) or high‐risk (HR) subgroups for identical PT and AT samples (e.g. either exclusively tumor suppressor‐like or exclusively pro‐oncogenic in both tissue types from the same patient).
The statistically weighted voting grouping (SWVg) method is a variable selection and multivariate prediction statistically‐based voting prediction method (Kuznetsov et al., 2006) that uses the 1‐D DDg‐derived binary variables (predictors) of the patient risk groups (LR and HR) as an input dataset (Motakis et al., 2009). Following 1‐D DDg, the input file is used to obtain the statistical voting stratification of a patient from the grouping information generated using the binary variables. For each patient, the SWVg score is calculated based on an optimized number of statistically weighted votes of the binary variables (Chen et al., 2017). The estimated SWVg score cut‐off was determined by maximizing the significance of the patient separation into HR and LR subgroups. For each patient, the SWVg calculates the prognostic score quantifying the risk of disease development, rank orders the patients by their SWVg scores and separates the patients into the LR and HR subgroups according to the estimated cut‐off score.
DEGs were identified using the GenePattern portal (Reich et al., 2006) and the significance of the RGC subgroup similarity was estimated using the ‘SubMap’ module in the portal (Hoshida et al., 2007). For Functional Annotation and Gene Ontology (FA/GO) and Pathway Maps analyses, we used either david bioinformatics (da Huang et al., 2009a) or MetaCore (https://portal.genego.com/).
A support vector regression (SVR) analysis of the immunohistochemical section images from formalin‐fixed paraffin‐embedded PT was performed as described previously (Smola and Vapnik, 1997). Briefly, each of the six representative HCC patients (three from the HRT RGC subgroup and three from the LRT RGC subgroup) had 54 (6 × 9) sub‐images in the dataset. All sub‐images from the LRT and HRT patients were labeled ‘0’ and ‘1’, respectively. This dataset was labeled with RGB covariance matrix‐based features and used to train and test the SVR system. The image‐processing pipeline, covariance‐based feature extraction system and SVR system were implemented using imagej, OpenCV, C++ and r (see Supporting information: Image based analysis of immunohistochemistry slides). Categorical variables were analyzed using a two‐sided Fisher's exact test or the Freeman–Halton extension of Fisher's exact test. The Mann–Whitney U‐test was applied for continuous variables (cytelstudio, version 9; Cytel, Inc., Cambridge, MA, USA). Confidence intervals for the proportions of agreement were calculated according to the Wilson efficient‐score method (Newcombe, 1998). Univariate and multivariate analyses were performed using the Cox proportional hazards regression model and the r ‘survival’ package.
2.6. ChIP‐seq binding regions analysis in the proximal promoters of the RGC and other gene sets
To support the in silico prediction of the regulatory roles of MYC in the RGC and other gene sets, we used the publicly available ChIP‐seq data for MYC from the HepG2 hepatocellular carcinoma cell line (GEO ID GSM822291; see Supporting information: ChIP‐seq analysis).
3. Results
3.1. Identification of common prognostic genes in PT and AT samples and their specific biological characteristics
We retrospectively analyzed the clinical data and the hepatic tissue samples from 125 HCC patients (Singapore cohort) collected after surgical treatment. The clinicopathological characteristics of the HCC patients are presented in Tables 1 and S1.
Figure 1A shows a conventional data analysis schema to identify prognostic biomarkers when a subset of survival significant genes is selected only in either PT or AT to identify diagnostic and prognostic biomarkers. This method may also use DEGs in the analysis and preselection of candidate prognostic genes (Fig. 1B) (Mah et al., 2014; Orimo et al., 2008). By contrast, the predictor selection and prognostic method identifies the genes (represented by transcript isoforms) exhibiting common expression patterns in both the PT and AT samples termed PT‐AT co‐expressed CPGs (see 2). Here, we describe the procedure for selecting the CPGs used to construct the CPG‐based prognostic classifier to predict HCC patient risks after curative resection.
Figure 1.

Identification of CPG candidates for PT and AT as HCC prognostic biomarkers. (A, B) Traditional approaches previously used for identifying prognostic biomarkers in HCC. (B) Biomarker candidates may be pre‐selected using DEG analysis between PT and AT, followed by survival prognostic analysis. (C, D) Scheme for identification of tumor suppressor‐like and pro‐oncogenic CPGs in the Singapore HCC cohort using the 1‐D DDg method for survival prognostic analysis. Only the CPG subsets with identical 1‐D DDg design 1 (tumor suppressor‐like CPGs) or only with 1‐D DDg design 2 (pro‐oncogenic CPGs; see 2) in both PT and AT were selected. (E) An example of pro‐oncogenic CPG RPS3A identified in the Singapore HCC cohort. Kaplan–Meier survival curves were obtained using 1‐D DDg by fitting the expression values to survival data. Analyses were performed independently in PT and AT for each gene in the Singapore (n = 52) HCC cohort. Vertical bars and P‐values show the significant difference in the level of gene expression between the LR and HR patient subgroups (Mann–Whitney test). (F) FA/GO analysis of TER genes in two distinct biological contexts (david bioinformatics software). The results of the FA/GO enrichment analysis are presented for the pro‐oncogenic CPGs subset (1) 1‐D DDg design 2 [the top 1000 survival significant genes obtained according to the scheme shown in (D)] and for the subset of DEGs (2) significantly up‐regulated in PT compared to AT [the top 1000 significantly up‐regulated genes, obtained according the scheme shown in (B)]. Only significant representative FA/GO terms are shown; Fisher test P‐values (P < 0.05) are Benjamini corrected and –log10 transformed.
By definition, the tumor‐suppressor‐like gene has higher expression values in a tissue sample set (e.g. PT or AT) than the corresponding 1D‐DDg‐defined gene expression cut‐off value and the patient belongs to a LR subgroup (1‐D DDg design 1). The pro‐oncogenic gene has higher expression values in a tissue sample set than the 1D‐DDg‐defined gene expression cut‐off value and the patient belongs to the HR subgroup (1‐D DDg design 2).
Figure S1 shows the results of the 1‐D DDg method. We selected fructose‐1,6‐bisphosphatase 1, FBP1, encoding the gluconeogenesis regulatory enzyme, acting as a rate‐limiting enzyme in gluconeogenesis and a well‐known tumor suppressor in HCC (Hirata et al., 2016; Wang et al., 2014), and fibroblast growth factor 1, FGF1, encoding a well‐known pro‐oncogenic growth factor in HCC (Lee et al., 2015; Yang et al., 2017). Figure S1A shows the –loge P‐value distribution over the gene expression level domain, and Fig. S1B shows two Kaplan–Maier survival functions representing the relatively LR and HR subgroups derived from 1‐D DDg at the optimized gene expression cut‐off value of FBP1 indicated in Fig. S1A. As expected, FBP1 exhibited a tumor suppressor‐like expression pattern. In the case of FGF1, a pro‐oncogenic expression pattern was observed (Fig. S1C,D). Notably, the terms ‘pro‐oncogenic’ and ‘tumor suppressor‐like’ are used in the specific context of the survival prognosis analysis (Fig. S1). However, such gene classifications are useful and often correlated with the functional classification of many known tumor suppressors and oncogenes, which are respectively defined based on the pathobiological roles of the genes and gene products in malignant cells (Chen et al., 2017).
We designated the CPG as a survival‐significant gene, for which (a) gene expression was binarized according to the 1‐D DDg gene expression cut‐off value; (b) the gene expression cut‐off value was used to stratify the cohort into LR and HR patient subgroups; and (c) the patient survival pattern in the given cohort was identical for PT and AT samples (e.g. either exclusively tumor suppressor‐like or exclusively pro‐oncogenic in both tissue types) (Fig. 1E).
Figure S2 shows the main steps of the workflow, including descriptions of the input and output data sets and the analytical and experimental methods. We used the Singapore cohort to select CPGs observed in the 52 PT‐AT paired samples. We used a multicriteria approach.
In the first step of the CPG selection process, we used 1‐D DDg values as relatively weak selection criteria for the potential prognostic variables (Wald's statistics P ≤ 0.1), assuming that the next‐level filters for accuracy, robustness and reproducibility criteria will enable optimization of the number and combination of high‐confidence predictors composing the final prognostic signature. The Venn diagram analysis of the 1‐D DDg‐based whole transcriptome profile screen in PT and AT samples resulted in the identification of a large common gene subset (Fig. 1D) comprising 2390 unique (Hg19) gene IDs.
Next, we applied a FA/GO analysis using david, version 6.7 (da Huang et al., 2009a) to shortlist the most significantly enriched biological processes and pathways, probably related to the most biologically or pathologically essential CPG subsets (Fig. S2). We identified the gene subsets of the survival significant pro‐oncogenic (e.g. Figs 1E and S3A,B) and tumor suppressor‐like (e.g. Fig. S3C,D) CPGs. We intended to use a sample size‐balanced and multicriteria approach to select unbiased, specific and robust prognostic variables. The 1000 top most significant genes in each CPG subset have been selected. We did this because of a probable effect of sample disbalance: different gene list sizes may lead to a bias in the enrichment analysis test. This sample disbalance also may affect the ranking of large‐sized GO categories, making it difficult to compare gene categories in the gene lists (da Huang et al., 2009b).
For the pro‐oncogenic CPG subset, using david, version 6.7, we found that most confidence biological process GO terms are determined by the genes encoding translational elongation proteins (P = 2.8 × 10⁻²⁵) and ribosome (P = 5.2 × 10⁻¹⁹). We also found the moderately enriched term for mitochondrion (P = 0.01) (Fig. 1F). Figure 1E shows the results of the survival prediction analysis for the CPG RPS3A, the TER gene co‐expressed in PT and AT samples. In each tissue type, RPS3A showed a pro‐oncogenic prognostic pattern. The proportion of agreement between the PT and AT stratifications was 0.731 at the 95% confidence interval (CI) (0.587–0.84). Interestingly, no significant FA/GO terms were observed among the top 1000 survival significant tumor suppressor‐like CPGs. Figure S3 shows two examples of the pro‐oncogenic ribosomal CPG RPL3 and the tumor suppressor‐like SPOP CPG according to the 1‐D DDg analysis. Typically, the survival patterns predicted by CPG in PT‐AT pairs were significantly concordant. For example, the proportion of agreement between the PT and AT stratifications given by the 1‐D DDg SPOP classifier was 0.673 at the 95% CI (0.528–0.792) and that given by the 1‐D DDg RPL3 classifier was 0.67 at the 95% CI (0.492–0.767). These findings suggest the pathobiological importance of SPOP, RPL3 and other translational elongation and ribosome biogenesis CPGs in AT as a novel class of potential non‐malignant tissue clinical biomarkers for malignancy diagnostics, the prognosis of tumor aggressiveness and ‘anti‐cancerization’ tissue therapeutic targeting.
We also analyzed the top 1000 significantly DEGs up‐regulated in PT compared to AT (t‐test q < 0.05; 115 PT versus 52 AT samples, respectively) (Fig. 1B). By contrast to the pro‐oncogenic CPG subset, the list of the top 1000 DEGs up‐regulated in PT compared to AT, included, as expected, cell cycle, cell division and mitosis gene enrichment; the FA/GO terms essentially predominated over the other FA/GO terms, including TER gene terms (Fig. 1F) (i.e. the FA/GO terms ‘GO:0000278~mitotic cell cycle’ with P = 3.7 × 10−38 and ‘GO:0006414~translational elongation’ with P = 2.9 × 10⁻⁴). Independently, panther (Thomas et al., 2006) identified similar highly enriched and significant FA/GO terms (Fig. S4).
Thus, these findings suggest that, in AT, the genes encoding translation elongation, ribosome machinery components and ribosomal biogenesis in general might pre‐exist in malignant predisposition (e.g. pre‐cancer tissue initiated by mutations, viral, metabolic or epigenetic reprogramming) and/or PT‐activated ‘cancerization’ behaviors. In both cases, pro‐tumorigenic cellular/tissue behavior in AT may be the result of switching‐on/exerting cellular extra‐ribosomal functions (Coulouarn et al., 2006; Kim et al., 2004; Lindstrom, 2009; Wang et al., 2015b). In pathobiological and clinical contexts, the TER CPGs could be considered novel and perspective diagnostic factors of host–cancer interactions and prognostic biomarkers. The prognostic utility of TER CPGs is based on the detection of similar pathobiological alterations and disease outcome prediction patterns in PT and AT. The differences in the expression profiles between PT and AT, as expected, are predominantly defined by cell cycle/mitosis genes. As described below, we performed several basic computational and experimental analyses addressing the pathobiology characteristics of TER CPGs and their clinical significance.
3.2. RGC: identification, robustness and reproducibility across cohorts
Using Singapore cohort gene expression and patient's survival data, we tested the utility of the identified CPGs as multigene prognostic HCC biomarkers. Based on the previous steps of the workflow (Fig. S2), ‘GO:0006412~translational elongation’ displayed the strong term enrichment P‐values among the other CPG GO terms (Figs. 1F and S4). We used the 44 gene symbols under this term, referred to as ‘TER genes (Singapore)’ (Table S3). The 44 gene subset includes two translational elongation genes (EEF1A1 and EEF1B2); the other 42 genes were specified by cellular component category as ‘GO:0005840~ribosome’. By using the same method as we applied in Singapore cohort, we identified stratification cut‐off values of individual genes and selected pro‐oncogenic CPGs in the LGI cohort PT – AT paired samples. We also carried out GO enrichment analysis. As result, we identified 60 CPGs (Table S4) specified the highest enriched gene term ‘GO:0006412‐transcriptional elongation’ (Fig. S5A). The next most significant GO term was ‘GO:0005840~ribosome’. Remarkably, an independent identification of the pro‐oncogenic CPGs in the Singapore and LCI cohorts led to a highly significant overlapping between the CPGs identified in the LCI and Singapore cohorts (hypergeometric test, P = 1.5 × 1080; Fig. S5B). Next, we applied 1‐D DDg to the 115 available PT samples in Singapore cohort as a discovery dataset and selected the CPGs satisfying the Wald statistics cut‐off value at P < 0.05. As result of SWVg implementation (see Methods), the 24 most prognostically significant ribosome genes were selected from the PT TER genes (Singapore) and formed our HCC prognostic model (Table S5A). Table 2 provides an annotation of these 24 ribosomal genes. The integrated SWVg risk score was calculated for each individual patient. The SWVg scores for all patients were refitted to the survival data, and the optimal SWVg score cut‐off value for patient stratification was determined (cut‐off = 1.42; Fig. 2A). The classifier successfully stratified the Singapore HCC patients using either PT (Fig. 2C) or AT (Fig. 3A) microarray data sets: P = 9.3 × 10⁻⁶, hazard ratio = 8.20 (3.24–20.8) for PT‐based prognostic stratification and P = 0.03, hazard ratio = 4.97 (1.21–20.35) for AT‐based prognostic stratification. We referred to this new CPG‐based HCC classifier as the RGC.
Table 2.
Pro‐oncogenic ribosomal genes of the 24‐gene HCC prognostic classifier
| Number | Host gene symbol | Illumina probe ID | RNA ID | Host gene description (UCSC genome browser) | Chromosome band |
|---|---|---|---|---|---|
| 1 | RPL9 | ILMN_1750507 | NM_001024921 | Ribosomal protein L9 | 4p13 |
| 2 | RPL12 | ILMN_2116366 | NM_000976 | Ribosomal protein L12 | 9q34 |
| 3 | RPL26 | ILMN_1731546 | NM_000987 | Ribosomal protein L26 | 17p13 |
| 4 | RPL37 | ILMN_2191634 | NM_000997 | Ribosomal protein L37 | 5p13.1 |
| 5 | RPL31 | ILMN_1754195 | NM_000993 | Ribosomal protein L31 | 2q11.2 |
| 6 | RPL41 | ILMN_2331890 | NM_001035267 | Ribosomal protein L41 | 12q13 |
| 7 | RPL30 | ILMN_1754303 | NM_000989 | Ribosomal protein L30 | 8q22 |
| 8 | RPS9 | ILMN_1749447 | NM_001013 | Ribosomal protein S9 | 19q13.4 |
| 9 | RPS15A | ILMN_1787949 | NM_001030009 | Ribosomal protein S15a | 16p12.3 |
| 10 | RPS25 | ILMN_1746516 | NM_001028 | Ribosomal protein S25 | 11q23.3 |
| 11 | RPS11 | ILMN_1740587 | NM_001015 | Ribosomal protein S11 | 19q13.3 |
| 12 | RPS4X | ILMN_2166831 | NM_001007 | Ribosomal protein S4, X‐linked | Xq13.1 |
| 13 | RPL19 | ILMN_1701832 | NM_000981 | Ribosomal protein L19 | 17q12 |
| 14 | RPL32 | ILMN_2400143 | NM_001007073 | Ribosomal protein L32 | 3q13.3‐q21 |
| 15 | RPS5 | ILMN_1707810 | NM_001009 | Ribosomal protein S5 | 19q13.4 |
| 16 | RPL34 | ILMN_1706873 | NM_000995 | Ribosomal protein L34 | 4q25 |
| 17 | RPL3 | ILMN_2319994 | NM_001033853 | Ribosomal protein L3 | 22q13 |
| 18 | RPL36 | ILMN_1685088 | NM_033643 | Ribosomal protein L36 | 19p13.2 |
| 19 | RPS2 | ILMN_2218277 | NM_002952 | Ribosomal protein S2 | 16p13.3 |
| 20 | RPL15 | ILMN_1762747 | NM_002948 | Ribosomal protein L15 | 3p24.1 |
| 21 | RPS13 | ILMN_1777344 | NM_001017 | Ribosomal protein S13 | 11p |
| 22 | RPL18A | ILMN_2141452 | NM_000980 | Ribosomal protein l18a | 19p13.11 |
| 23 | RPS12 | ILMN_1782621 | NM_001016 | Ribosomal protein S12 | 6q23 |
| 24 | RPL17 | ILMN_1655422 | NM_000985 | Ribosomal protein L17 | 18q21 |
Figure 2.

Cross‐cohort validation of the RGC in PT. (A, B) The results of the SWV procedure for the selected 24 ribosomal genes in the Singapore (A) and LCI (B) HCC patient cohorts (see Results). Green: LR HCC patients (LRT subgroup); blue: HR HCC patients (HRT subgroup). (C, D) Kaplan–Meier survival curves for integrated patient partitions in the Singapore and LCI HCC cohorts, respectively. x‐axis: OS, years; y‐axis: patient survival probability. (E) Subclass association matrix obtained as a result summary of the SubMap analysis (see 3). The bottom left red quadrant indicates the significant similarity between the two LRT subgroups, the top right quadrant indicates the significant similarity between the two HRT subgroups (in the Singapore and LCI cohorts, respectively).
Figure 3.

RGC‐based stratification in AT and PT. (A, B) Training and cross‐cohort validation of the RGC in AT. Kaplan–Meier survival curves for integrated patient partitions in the Singapore and LCI HCC cohorts, correspondingly. (C) Contingency table for HCC patient stratification in PT and AT in the LCI cohort. The combined LR subgroup LRT &A included the patients stratified only as LR using gene expression information from PT and AT (blue). The HR subgroup HRT &A included the remaining patients (pink). (D) Combined stratification (cohort validation model) using information from PT and AT in the LCI cohort.
Next, to test the reproducibility and robustness of the RGC, we performed a validation analysis of the classifier using data from an independent HCC cohort (LCI cohort, 206 HCC patients, Methods). In the contexts of robustness and reproducibility of the potential RGC predictors, we carried out a comparison of the 1D DDg results obtained in Singapore and LGI datasets. Our results, presented in Table S5 suggest a high probability of occurrence of the same survival significant genes in PT of LGI cohort and ability to use Singapore PT data as a training set to develop multi‐gene prognostic signature(s) (see also Supporting information: Comparison of 1D DDg results obtained in the Singapore and LGI datasets). The individual stratification gene expression cut‐off values obtained from the 1‐D DDg and the SWVg risk score cut‐off value (cut‐off = 1.42) in the Singapore cohort were used for LCI patient stratification (Fig. 2B). The strict fixation of the pro‐oncogenic type of prognosis variables and parameter values in the 1‐D DDg and SWVg procedures in the Singapore cohort (training) enabled a prognosis prediction blinded to the survival data (defined by overall survival, OS) in the validation (LCI) cohort (at Wald P = 0.004) (Fig. 2D). The stratification results in two datasets Singapore and LCI (Fig. 2C,D) can be represented by the fractions of patients within each cohort of particular interest, such as HR. This event is represented in the Singapore and LCI cohorts with the proportions 38/115 = 0.33 and 53/206 = 0.26, respectively. We found that the 95% CI for the difference between these proportions was not significant, which suggests subpopulation similarity across different cohorts. Independently, the inter‐cohort subgroups agreement analysis using the SubMap algorithm (Hoshida et al., 2007) revealed that the ordered HRT and LRT subgroups based on the results of patient stratification displayed significant agreement between the Singapore and LCI cohorts (Fig. 2E).
Thus, these results suggest that the RGC enables the identification of the robust predicting system for HCC inter‐cohort prognosis.
Finally, we also addressed the question of whether the highly enriched DEGs differentiating PT and AT could provide a reproducible prognostic signature of HCC. Using Singapore data, we selected the DEG subset identified under the three most highly enriched FA/GO terms (‘GO:0000278~mitotic cell cycle’, ‘GO:0051301~cell division’ and ‘GO:0007067~mitotic nuclear division’) (Fig. 1F). These genes were further processed using 1‐D DDg, as described in the Materials and methods. We further selected the genes that displayed significant Wald P‐values (P < 0.05) in the Kaplan–Meier survival analysis (Table S6). Next, SWVg analysis generated a 41‐gene prognostic signature represented by mitosis/cell cycle genes (Table S6). The 41‐gene prognostic signature displayed significant HCC patient partitioning in the Singapore cohort (Fig. S6A). However, this signature failed in validation in the LCI cohort (using the same procedure as that used for the RGC described above) (Fig. S6B). Non‐significant result we also observed in AT of LCI cohort (Fig. S5D versus Fig. S5C). The lack of reproducibility could be explained by the relatively high inter‐cohort variation in the environmental, ethnic, clinical and pathological parameters that are relevant to cell cycle/mitotic gene expression and relevant pathways.
By contrast, the RGC signature (based on the CPG model; Table S5A) led to reproducible predictions and consistent results for individual predictor genes (see Tables 2 and S5A) and their multigene classifier (Fig. 2C,D; Table S5A).
Altogether, these results indicate the relatively high robustness of the prognostic model to inter‐cohort variations in environmental, ethnic, clinical and pathological parameters to CPGs expression and relevant pathways.
3.3. RGC is an independent prognostic factor for HCC progression
The list of clinicopathological parameters available for analysis in Singapore and LCI cohorts is presented in Table 1. For many of these parameters, we detected significant differences in distributions between Singapore and LCI cohorts (Table 1; see also the Supporting information: Comparison of standard clinicopathological parameters between the Singapore and LCI cohorts). Such differences between the cohorts could probably be explained by the differences in the environmental factors, healthcare systems and non‐identical study design between LCI (Roessler et al., 2010) and Singapore cohorts and/or various accepted HCC patient diagnoses and treatment guidelines between LCI and Singapore cohorts (Han et al., 2011). We used univariate and multivariate Cox regression analyses to compare the prognostic performance of the RGC with these clinical factors (Table 3).
Table 3.
Univariate and multivariate analyses of clinical, pathological and molecular variables for overall survival in the training, validation and overall cohorts
| Univariate analysis | Multivariate analysis | ||||||||
|---|---|---|---|---|---|---|---|---|---|
| Variables | Patients (n) | Hazard ratio | 95% CI | Wald P‐value | Variables | Patients (n) | Hazard ratio | 95% CI | Wald P‐value |
| Training cohort (Singapore) (n = 115) | |||||||||
| RGC (R1) | 115 | 8.2 | 3.23–20.8 | 9.4 × 10⁻⁶ | RGC (R1) | 115 | 6.4 | 2.38–17.19 | 0.0002 |
| Age (> 50 years) | 115 | 1.0 | 0.96–1.04 | 0.8 | – | – | – | – | – |
| Sex (female) | 115 | 0.81 | 0.18–3.54 | 0.8 | – | – | – | – | – |
| AFP (> 300 ng·mL−1) | 115 | 1.49 | 0.65–3.45 | 0.3 | – | – | – | – | – |
| HBV statusa | 96 | 1.74 | 0.71–4.27 | 0.23 | – | – | – | – | – |
| Tumor size (> 5 cm) | 115 | 1.33 | 0.75–3.31 | 0.5 | – | – | – | – | – |
| Multiple tumors | 115 | 1.71 | 0.69–4.20 | 0.24 | – | – | – | – | – |
| Total nodulesb | 115 | 1.36 | 0.80–2.30 | 0.25 | – | – | – | – | – |
| Microvascular invasion | 115 | 1.69 | 0.74–3.84 | 0.21 | – | – | – | – | – |
| Albumin child pointsb | 115 | 1.95 | 1.07–3.57 | 0.03 | Albumin child pointsb | 115 | 2.24 | 1.07–4.68 | 0.03 |
| Bilirubin Child pointsb | 115 | 0.68 | 0.095.05 | 0.70 | – | – | – | – | – |
| Cirrhosis | 115 | 1.55 | 0.66–3.66 | 0.32 | – | – | – | – | – |
| Child statusb | 115 | 2.02 | 0.58–6.96 | 0.26 | – | – | – | – | – |
| Milan criteriab | 115 | 0.81 | 0.29–2.24 | 0.68 | – | – | – | – | – |
| Edmondson tumor gradeb | 112 | 0.93 | 0.52–1.65 | 0.79 | – | – | – | – | – |
| Presence of tumor capsule | 106 | 1.03 | 0.41–2.57 | 0.9 | – | – | – | – | – |
| Portal vein invasion | 110 | 0.90 | 0.12–6.86 | 0.9 | – | – | – | – | – |
| Platelet score | 115 | 0.67 | 0.08–5.08 | 0.7 | – | – | – | – | – |
| Positive tumor margins | 115 | 3.07 | 0.98–9.51 | 0.05 | – | – | – | – | – |
| TNM stagingc | 115 | 1.72 | 1.16–2.56 | 0.007 | TNM staging | 115 | 1.21 | 0.62–2.40 | 0.66 |
| BCLC stagingd | 115 | 2.50 | 1.39–4.49 | 0.002 | BCLC staging | 115 | 1.73 | 0.66–4.58 | 0.26 |
| Validation cohort (LCI) (n = 206) | |||||||||
| RGC (R1) | 206 | 1.94 | 1.23–3.08 | 0.004 | RGC | 187 | 1.77 | 1.02–3.06 | 0.04 |
| Age (> 50 years) | 206 | 0.99 | 0.97–1.01 | 0.32 | – | – | – | – | – |
| Sex (female) | 206 | 0.95 | 0.55–1.68 | 0.8 | – | – | – | – | – |
| AFP (> 300 ng·mL−1) | 205 | 1.66 | 1.07–2.60 | 0.03 | AFP (> 300 ng·mL−1) | 187 | 1.01 | 0.58–1–68 | 0.97 |
| HBV statusa | 191 | 1.62 | 0.23–11.68 | 0.6 | – | – | – | – | – |
| Tumor size (> 5 cm) | 205 | 1.75 | 1.12–2.72 | 0.01 | Tumor size (> 5 cm) | 187 | 0.81 | 0.43–1.50 | 0.5 |
| Multiple tumors | 206 | 1.76 | 1.08–2.88 | 0.02 | Multiple tumors | 187 | 0.69 | 0.38–1.26 | 0.22 |
| Cirrhosis | 206 | 4.35 | 1.07–17.72 | 0.04 | Cirrhosis | 187 | 3.43 | 0.82–14.25 | 0.09 |
| TNM stagingc | 191 | 1.81 | 1.44–2.27 | 4.01 × 10⁻⁷ | TNM staging | 187 | 1.37 | 0.98–1.92 | 0.06 |
| BCLC stagingd | 191 | 2.14 | 1.65–2.79 | 1.4 × 10⁻⁸ | BCLC staging | 187 | 1.84 | 1.23–2.75 | 0.003 |
| Overall (Training + Validation cohorts) (n = 321) | |||||||||
| RGC | 321 | 2.63 | 1.77–3.92 | 1.6 × 10⁻⁶ | RGC | 302 | 2.48 | 1.59–3.85 | 5.5E–05 |
| Age (> 50 years) | 321 | 1.02 | 0.64–1.50 | 0.9 | Age (> 60 years) | – | – | – | – |
| Sex | 321 | 0.66 | 0.33–1.31 | 0.24 | Sex | – | – | – | – |
| AFP (> 300 ng·mL−1) | 318 | 1.44 | 1.06–1.96 | 0.02 | AFP (> 300 ng·mL−1) | 302 | 0.98 | 0.71–1.36 | 0.9 |
| HBV statusa | 287 | 1.48 | 0.71–3.08 | 0.3 | HBV statusa | – | – | – | – |
| HCV statusa | 56 | 0.61 | 0.13–2.90 | 0.5 | HCV statusa | – | – | – | – |
| Tumor size (> 5 cm) | 320 | 1.54 | 1.045–2.28 | 0.03 | Tumor size (> 5 cm) | 302 | 0.93 | 0.57–1.53 | 0.8 |
| Multiple tumors | 321 | 1.77 | 1.15–2.73 | 0.009 | Multiple tumors | 302 | 0.7 | 0.42–1.17 | 0.17 |
| Cirrhosis | 321 | 2.08 | 1.11–3.89 | 0.02 | Cirrhosis | 302 | 1.69 | 0.85–3.35 | 0.13 |
| TNM stagingc | 306 | 1.80 | 1.47–2.19 | 6.6 × 10⁻⁹ | TNM staging | 302 | 1.37 | 1.03–1.82 | 0.03 |
| BCLC stagingd | 306 | 2.19 | 1.72–2.78 | 2.1 × 10⁻¹⁰ | BCLC staging | 302 | 1.70 | 1.20–2.42 | 0.003 |
HBV and HCV status was based on serology and/or documented history.
Total nodules, based on histology report, including satellite nodules; total nodules are binned as: 1 = 1 nodule; 2 = 2–7 nodules; 3 = 7 or more nodules. Albumin Child points were binned according to Child‐Pugh Category score: 1 point = > 35 g·L−1; 2 points = 28–35 g·L−1; 3 points = < 28 g·L−1; Bilirubin Child points, Child‐Pugh Category score: 1 point = < 34.2 μmol·L−1; 2 points = 34.2–51.3 μmol·L−1; 3 points = > 51.3 μmol·L−1; Edmondson tumor grade binning: 1 = Grade 1; 2 = Grade 2; 3 = Grade 3; 4 = Grade 4; Child status binning: 1 = Child A; 2 = Child B; 3 = Child C; Platelets score binning: 1 = ≤ 100; 2 = > 100; Milan criteria binning: 1 = beyond; 2 = within.
TNM staging binning: 1 = Stage I (T1, N0, M0); 2 = Stage II (T2, N0, M0); 3 = Stage IIIA (T3a, N0, M0); 4 = Stage IIIb (T3b, N0, M0), Stage IIIc (T4, N0, M0), Stage IVa (Any T, N1, M0), Stage IVb (Any T, Any N, M1).
BCLC staging binning: 1 = Stage 0; 2 = Stage A; 3 = Stage B; 4 = Stage C. NA, data not available. –, excluded from the analysis. OS was used as the endpoint in all analyses.
In the Singapore cohort, the parameters metastasis and extra‐hepatic invasion were excluded from the analysis as a result of their low informativeness. HCV status was excluded because of a substantial amount of missing data in the Singapore and LCI cohorts (Table 1).
Univariate analysis shows that in addition to albumin expression (P = 0.03), tumor, node and metastasis (TNM) staging (P = 0.007) and Barcelona clinic liver cancer (BCLC) staging (P = 0.002), the RGC classification was a significant indicator for OS (P = 9.4 × 10⁻⁶) in the Singapore cohort. In the LCI cohort, significant prognostic powers were observed for the RGC (P = 0.004), tumor size (P = 0.01), multiple/solitary tumor formation (P = 0.02) and cirrhosis status (P = 0.04). The TNM and BCLC staging displayed the best prognostic performances (P = 4.0 × 10⁻⁷ and P = 1.4 × 10⁻⁸, respectively). In the univariate analysis, combining the overall data for the training and validation cohorts revealed the following prognostically significant variables: AFP level (P = 0.02), tumor size (P = 0.03), multiple/solitary tumors (P = 0.009), liver cirrhosis status (P = 0.02), TNM staging (P = 6.6 × 10⁻⁹), BCLC staging (P = 2.1 × 10⁻¹⁰) and the RGC (P = 1.6 × 10⁻⁶). Interestingly, in additional association analyses of RGC with clinical phenotypes (Table S7), we detected its significant association with AFP levels (P = 1.8 × 10⁻⁷) and BCLC classification (P = 0.004) in the LCI cohort and with AFP level (P = 1.0 × 10⁻³), multinodular tumors (P = 0.03) and BCLC staging (P = 0.005) in the overall cohort (Table S7). However, in the multivariate analysis (Table 3), the RGC classification retained its independent prognostic value (P = 0.0002 in Singapore cohort, P = 0.04 in the LCI cohort and P = 5.5 × 10⁻⁵ compared to TNM staging (P = 0.03) and BCLC staging (P = 0.003), in the overall cohort) (Table 3). These analyses suggest that the RGC could be considered an independent prognostic factor for HCC.
3.4. The PT RGC prognostic pattern is reproducible in AT data
We tested the performance of the RGC using the AT expression data of the Singapore (training) and LCI cohorts (validation). For prognosis using AT data, we implemented the same stratification algorithm as implemented for the discovery of RGC in the analysis of PT data (Fig. 2). The use of AT data for RGC training resulted in a significant Singapore HCC patient stratification (the HRA and LRA subgroups, Wald P < 0.05) (Fig. 3A). Additionally, the difference between the agreement scores of the HR proportions between PT and AT was not significant, suggesting a similarity of stratification between the PT and AT using RGCs in the Singapore cohort. The strict fixation of the pro‐oncogenic type of prognosis variables and parameter values in the 1‐D DDg and SWVg procedures in the Singapore cohort (training) enabled a prognosis prediction blinded to the survival data in the validation (LCI) cohort (at Wald P = 0.03) (Fig. 3B).
Notably, the 41‐gene signature based on cell cycle genes generated from DEGs between PT and AT (Table S6) failed in cross‐cohort validation in AT (Fig. S6C,D) and would have questionable clinical utility.
3.5. RGC power can be improved by combining PT and AT gene expression data
Next, we proposed that the grouping of common LR patients from relatively low‐risk LRT and LTA prognosis subgroups identified in PT and AT could improve the stratifying power of the RGC. We combined personalized RGC data from the PT and AT datasets and constructed HRT&A and LRT&A subgroups (Fig. 3C). Using LCI data as an example, we observed a positive interaction effect. The Wald P‐value in the combined classifier was P = 1.2 × 10⁻⁴ (Fig. 3D) compared to P = 0.003 and P = 0.03 in the PT‐based (Fig. 2D) and AT‐based (Fig. 3B) stratification prognostic models, respectively. We also tested the other combination scenario, alternative to that shown in Fig. 3C, stratifying common HR patients from HRA and HRT subgroups as a combined HRT&A patient subgroup. However, an imbalanced stratification into risk subgroups (i.e. n = 196 in the LR subgroup and n = 10 in the HR subgroup) was observed that limits predictive power (not shown data). We concluded that the prognostic power of the original PT‐based RGC can be improved using RGC obtained from AT.
3.6. The RGC‐based stratification of HCC patients reveals deregulated pathways in PT and AT
The deregulated pathway associated with RGC‐defined HCC patient risk subgroups might be useful for designing new molecular targets and developing therapies for RGC‐stratified HCC patients. Using david software, the FA/GO enrichment analysis of the up‐regulated DEGs observed in the HR subgroups (HRT and HRA) revealed FA/GO terms related to ribosomes, translation and the cell cycle in both the PT and AT, although the high enrichment of terms related to cytoplasmic vesicles was only observed in AT (Fig. 4A). The DEGs down‐regulated in the HRT and HRA subgroups displayed various common enriched terms, including deregulated liver metabolism [FA/GO terms ‘lipid metabolism,’ ‘carboxylic acid metabolic process’ (SP_PIR_KEYWORDS)] and mitochondrial dysfunction [e.g. FA/GO terms ‘GO:0005739~ mitochondrion’ and ‘oxidoreductase’ (SP_PIR_KEYWORDS)] (Fig. 4A).
Figure 4.

Comparison of biological pathways between the RGC‐derived HCC patient subgroups in PT and AT (david and MetaCore software). (A) david FA/GO heat map analysis (excluding 24 genes comprising the RGC) for the DEG subsets. Up‐regulated and down‐regulated DEGs in HR subgroups (HRT and HRA) after RGC‐stratification in PT and AT and common for the Singapore and LCI cohorts. (B) Venn diagram and MetaCore cellular compartments heatmap analysis of tissue‐specific and common prognostic DEGs for PT and AT up‐regulated in HRT and HRA subgroups in the two studied cohorts. Gray cells: nonsignificant FA/GO terms. Color gradient: significant FA/GO terms [Benjamini corrected Fisher test –log10 P‐values (P < 0.05)].
Exclusively in PT (Fig. S7A), MetaCore Pathway Maps Analysis identified the deregulation of the genes involved in the WNT pathway (Fig. S7B). DKK1, DVL3, β‐catenin (CTNNB1), casein kinase II (CSNK2A and CSNK2A2) and LEF1 were significantly up‐regulated, whereas GSK3‐β (GSK3B) was significantly down‐regulated (Fig. S8). These gene expression alterations are characteristic of WNT pathway deregulation (Tannock and Hill, 2013).
TGFBR2 and MYC were significantly overexpressed in the up‐regulated DEGs of both HRT and HRA patient subgroups (Tables S8 andS9). Our results, shown in Fig. 5 and Supporting information (section: MYC as a key regulator of ribosomal pathway in HCC PT and AT), provide the evidences that MYC is a key positive transcription regulator of the RGC and TER genes in PT and AT. MetaCore identified MYC as the most significant transcription factor interactor among the DEGs in the both PT and AT (Fig. 5D and Tables S8 and S9). Furthermore, combining gene expression correlation, FA/GO and ChIP‐seq analyses revealed that MYC might be the primary positive transcription regulator of the genes involved in the TER pathway (Fig. 5; Tables S3 and S10) in both PT and AT cells (Figs 5C and S9; see also the Supporting information: MYC as a key regulator of ribosomal pathway in HCC PT and AT).
Figure 5.
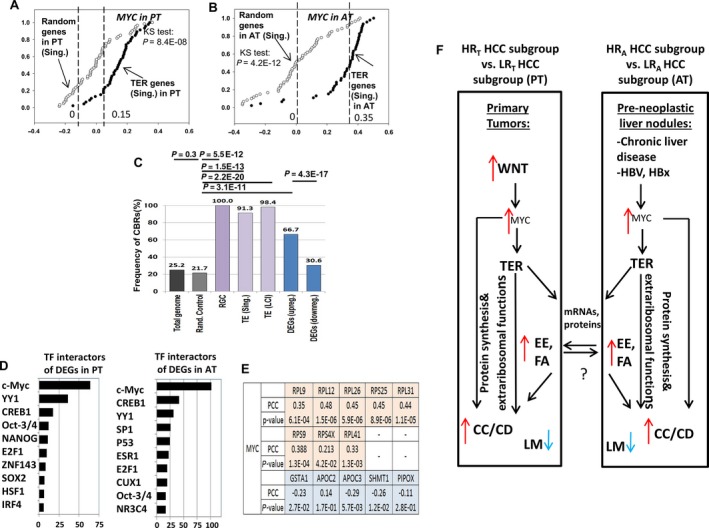
The computational analyses and hypothetical data‐driven model suggest the role of the TER pathway in PT and AT of HCC patients. (A, B) Correlation analyses of MYC in the Singapore and LCI cohorts in PT, AT. x‐axis: Kendall's Tau correlation coefficient; y‐axis: cumulative relative frequency. Black circles: correlation coefficients for TER gene sets (‘TER gene set (Singapore)’ and ‘TER gene set (LCI)’; white circles: correlation coefficients for random control gene set (see also the Supporting information: MYC as a key regulator of ribosomal pathway in HCC PT and AT). Dashed lines indicate medians for correlation coefficients distributions. (C) Frequencies of MYC ChIP‐seq binding regions in HepG2 cells in the vicinity of proximal promoters (+200/−500 bp) in TER gene sets and DEGs up‐regulated in HRT subgroups. x‐axis: various gene sets; y‐axis: frequency of ChIP‐seq binding regions (%). Differences in the frequencies assessed using Fisher's exact test (see the Supporting information: MYC as a key regulator of ribosomal pathway in HCC PT and AT). (D) MetaCore transcription factors interactors significantly enriched for the DEGs after RGC stratification in PT and AT. x‐axis: −log10 transformation of FDR‐corrected P‐values (P < 0.05); y‐axis: MetaCore terms for transcription factor (TF) interactors. (E) Correlation analysis of MYC with eight representative TER genes and five genes involved in liver metabolism based on quantitative RT‐PCR data from 92 PT samples from the Singapore cohort. PCC, Pearson's correlation coefficient. (F) Hypothetical data‐driven model of the TER pathway in PT and AT of HCC patients. Red and blue arrows: genes up‐regulated and genes down‐regulated in HR HCC patient subgroups, respectively. TER, translation elongation/ribosomal genes; CC/CD, cell cycle/cell division genes; EE and FA, extracellular exosome and focal adhesion genes, respectively. LM, genes involved in liver metabolism.
MetaCore Pathway Map analysis suggested that DNA double‐strand break repair was characteristic of the PT but not AT (Fig. S7B). In both PT and AT, we identified the enrichment for cell cycle, cytoskeleton remodeling, and vascular endothelial growth factor and transforming growth factor‐β receptor signaling. The ‘GO localization’ category identified common GO terms for PT and AT for extracellular vesicles and exosomes, cell adherence junctions, focal adhesions and ribosomes (Fig. 4B), which suggested a deregulation of extracellular exosomal transport in the HRT and HRA HCC subgroups. For the PT‐specific gene subset, we found no association with extracellular vesicles. However, the AT‐specific subset was additionally associated with extracellular exosomes and endosomes. In the common PT and AT gene subset, 15 RGC genes were annotated under the MetaCore term ‘extracellular exosome’ (Fig. S7C). In the AT‐specific subset, at least eleven genes annotated under the term ‘endosome’ have previously been associated with endosome‐specific functions (Fig. S7C and Table S11). Within the up‐regulated AT‐specific DEGs subset, we identified multiple enriched Pathway Maps, indicating an activated immune response in the AT (Fig. S7B).
Importantly, the comparison between nonstratified PT and AT in the Singapore and LCI cohorts revealed global systematic differences in the gene expression profiles between these tissue types for common PT and AT prognostic pathways (Fig. 6A,B). However, after RGC‐based stratification, the representative common prognostic pathways (TER, cell cycle/cell division, extracellular exosome, focal adhesion and liver metabolism) (Table S12) displayed distinct characteristic gene expression patterns within the PT and AT (Fig. 6C,D).
Figure 6.

Gene expression heatmap for representative genes of common prognostic pathways in the nonstratified and RGC‐stratified PT and AT. The heatmap before (A, B) and after (C, D) stratification of HCC patients using the RGC. (A, C) Singapore cohort. (B, D) LCI HCC cohort. The pathways for the up‐regulated or down‐regulated DEGs in HR subgroups were selected as gene sets enriched under the specific FA/GO terms (Table S12). TER, genes enriched under the FA/GO term ‘GO:0006414~translational elongation’ in PT; CC/CD: cell cycle/cell division genes enriched under the FA/GO terms ‘GO:0007049~cell cycle’ and ‘cell division’ (SP_PIR_KEYWORDS); EE and FA, extracellular exosome and focal adhesion genes enriched under the ‘GO localization’ terms (MetaCore) ‘extracellular exosome’ and ‘focal adhesion’, respectively. LM, representative mitochondrial and oxidoreductase DEGs down‐regulated in HR subgroups in both PT and AT and enriched under the FA/GO terms ‘GO:0005739~mitochondrion’ and ‘oxidoreductase’. Mitochondria is known as an integrative energy hub of diverse liver metabolism pathways (Degli Esposti et al., 2012). Heat map spectrum displays log2 transformed gene expression values.
3.7. Validation of the RGC and RGC‐associated genes using quantitative RT‐PCR in the Singapore cohort
We assessed the reproducibility of the gene expression measurements in the microarray platform with quantitative RT‐PCR experiments using RNA samples from the Singapore cohort. We selected eight representative ribosomal genes from the RGC, seven representative up‐regulated WNT pathway genes and five representative down‐regulated genes involved in liver metabolism in the HRT subgroups in both cohorts. For the eight tested RGC genes (RPL9, RPL12, RPL26, RPL31, RPL41, RPS9, RPS25 and RPS4X) and four tested up‐regulated WNT pathway genes (MYC, ENC1, CTNNB1 and LEF1), we observed a strong and significant correlation with the microarray results (Fig. S10). We also tested the consistency in differential gene expression in these samples by comparing patients from the HRT and LRT subgroups originally classified using microarray gene expression data (Fig. S11). The quantitative RT‐PCR analysis indicated that the 15 up‐regulated genes from the HRT subgroup (based on the microarray data, Fig. S11A,B) were up‐regulated in randomly selected patients from the HRT subgroup compared to the LRT subgroup (Fig. S11D); the five down‐regulated genes from the HRT subgroup (based on the microarray data) (Fig. S11C) were down‐regulated in randomly selected patients from the HRT subgroup compared to the LRT subgroup (Fig. S11D).
Finally, the RGC stratification power using the quantitative RT‐PCR expression data was comparable to that of the microarray expression data (Fig. S11E versus Fig. 2C). In total, we analyzed PT from 92 HCC patients from Singapore cohort. The patients were selected at random. Patient's stratification was carried out according to the microarray identified RGC genes, detected in PT samples by the qRT‐PCR (Fig. 2C). The quantitative RT‐PCR based risk stratification analysis results (Fig. S11E) suggest the applicability of our prognostic model for quantitative stratification of the LR and HR HCC patients.
3.8. DKK1 is a potential prognostic factor and drug target
DKK1 was found to be the most up‐regulated gene in the HRT subgroups after whole transcriptome screening. We thus also tested whether DKK1 gene expression was associated with the RGC‐based classification at the protein level in the Singapore HCC cohort. First, we selected six representative HCC patients from the Singapore cohort (three from HRT and three from LRT subgroups). Second, we analyzed liver tumor FFPE section images (Methods, Supporting information: Image based analysis of immunohistochemistry slides) using a training and cross‐validation protocol for the SVR system (Smola and Vapnik, 1997). We tested all possible pairs of the HRT versus LRT patients (nine pairs) by measuring the SVR scores of the corresponding tumor tissue images. As expected, the average predicted DKK1 SVR score of the LRT patient images was significantly less than that of the HRT patient images of the nine pairs (Fig. S12). We proposed DKK1 as a potential prognostic factor and drug target for a preclinical study of anti‐DKK1 therapy in HCC.
3.9. RGC‐based HCC stratification outperformed several known multigene HCC classifiers
The validation analyses of RGC in PT or AT HCC samples and univariate and multivariate analyses of the RGC suggest its robustness and reproducibility across HCC patient cohorts. We compared the prognostic power, robustness and reproducibility of the RGC with those of several published prognostic HCC multigene signatures. The comparison of the RGC with the 65‐gene risk signature (Kim et al., 2012), the 16‐gene G1–G6 signature (Boyault et al., 2007), the vascular invasion gene signature (Minguez et al., 2011) and the 186‐gene survival signature proposed for the analysis in AT (Hoshida et al., 2008) revealed the prognostic outperformance of the RGC in PT or AT in the cohorts under investigation (see Supporting information: RGC‐based HCC stratification performance). Briefly, in the combined overall HCC group, the first three gene signatures displayed nonsignificant prognostic power: 65‐gene risk signature, P = 0.12, hazard ratio = 0.73 (95% CI = 0.50–1.09); the 16‐gene G1–G6 signature, P = 0.3, hazard ratio = 1.24 (95% CI = 0.84–1.84); vascular invasion gene signature, P = 0.3, hazard ratio = 1.27 (95% CI = 0.86–1.87) (not shown). The 5‐gene risk score signature proposed by Nault et al. (2013) was the only gene signature showing a significant prognostic value in PT, comparable with the RGC: 5‐gene risk score, P = 3.1 × 10⁻⁶, hazard ratio = 2.57 (95% CI = 1.73–3.81) versus RGC, P = 1.6 × 10⁻⁶, hazard ratio = 2.63 (95% CI = 1.77–3.92), respectively (Fig. S13A,B). Comparison of the patients stratified in the RGC‐derived HRT subgroups with the HR patients, identified using the 5‐gene score signature in the two HCC groups, revealed substantial differences in their stratification: more than 50% of patients from HRT subgroup were stratified using the 5‐gene score signature as a LR subgroup (Fig. S13C).
The RGC displayed stronger prognostic power compared to the 186‐gene survival signature in AT [RGC: P = 4.7 × 10⁻³, hazard ratio = 2.01 (95% CI = 1.24–3.26); 186‐gene signature: P = 0.01, hazard ratio = 1.77 (95% CI = 1.13–2.77)] (Fig. S13D,E). Interestingly, the combined use of the 186‐gene signature with the RGC substantially improved the prognostic power [Wald P = 8.6 × 10⁻⁴, hazard ratio = 2.43 (95% CI = 1.42–3.87)] (Fig. S13F).
Finally, the RGC retained its prognostic power in multivariate analysis in PT compared to the 5‐gene risk score [RGC, P = 3.2 × 10⁻⁴, hazard ratio = 2.15 (95% CI = 1.42–3.25] versus 5‐gene risk score signature [P = 5.7 × 10⁻⁴, hazard ratio = 2.07 (95% CI = 1.37–3.14)] and in AT compared with the 186‐gene survival signature [RGC, P = 0.02, hazard ratio = 1.80 (95% CI = 1.10–2.95)] versus 186‐gene survival signature [P = 0.04, hazard ratio = 1.62 (95% CI = 1.02–2.56)] (Fig. S13G).
These results showed the superiority or independent prognostic power of the RGC compared to other proposed multigene prognostic signatures.
4. Discussion
Previous studies have identified the pathobiological pathways and clinically relevant HCC prognostic classifiers that utilized PT; PT with the AT serving as a negative control; or AT alone (Hoshida et al., 2008). However, increasing evidence indicates the presence of common co‐regulatory processes, signaling pathways and molecular mechanisms that drive PT and AT compartments (Polyak et al., 2009), resulting in their interconnection and complex regulatory patterns.
In the present study, we developed a prognostic stratification approach to identify common oncogenic pathways and survival significant prognostic variables in the PT and AT of HCC patients with resectable PT. This methodological approach revealed common co‐expression patterns for multiple PT‐ and AT‐associated TER pathway genes that are reproducibly associated with aggressive HCC. Further analysis suggested that this might reflect the pathophysiological mechanics of the TER pathway in HCC progression.
We identified 24‐ribosomal gene classifier (termed RGC) that displayed the significant PT‐associated prognostic power in the studied HCC patient cohorts. The RGC was clinically (Fig. 2C,D) and genetically (i.e. identical enriched biological gene sets) (Fig. 2E) reproducible in a large independent HCC patient dataset. The RGC retained its significant and independent prognostic power in a multivariate analysis compared to the traditional clinicopathological parameters of HCC (Table 3). A comparison of RGC with the 65‐gene risk signature (Kim et al., 2012), the 16‐gene G1–G6 signature (Boyault et al., 2007) and the vascular invasion gene signature (Minguez et al., 2011), previously proposed for prognosis in PT, demonstrated the outperforming prognostic power of the RGC. The RGC displayed comparable and independent prognostic potential (i.e. clinical reproducibility) compared to the 5‐gene score signature of Nault et al. (2013) (Fig. S13A–C), which was also developed for HCC patients with curative resection. However, in contrast to the RGC, the genetic reproducibility of the 5‐gene score signature remains unclear because it has not been tested (Nault et al., 2013). Notably, the alternative proliferative 41‐gene cell cycle gene signature generated from DEGs between PT and AT failed in cross‐cohort validation (Fig. S6), indicating the limitations of cell cycle‐based DEG approach(s) for generating a reproducible HCC prognostic classifier.
RGC could be considered for prognosis using gene expression information not only from PT, but also from AT in the same HCC patients (Fig. 4A–B). Comparison of the RGC with the 186‐gene survival signature, previously developed for prognosis in AT (Hoshida et al., 2008), revealed a stronger and independent prognostic value for the RGC in the studied cohorts (see 2; Fig. S13; see also the Supporting information: RGC‐based HCC stratification performance). Thus, the RGC could potentially be used for pre‐surgery prognostic patient stratification using AT biopsy tissue samples. The AT‐based RGC stratification could minimize the risks of post‐biopsy tumor dissemination and intrahepatic metastasis. Interestingly, the combined use of the RGC with the 186‐gene survival signature (Fig. S13F) or the RGC alone in both PT and AT (Fig. 3D) can significantly improve the post‐surgical prognostic power of the RGC.
The tumor suppressor genes FBP1 and SPOP and their products acting as CPGs in HCC livers may also be important diagnostic and prognostic biomarkers and therapeutic targets.
The data analysis of DEGs in the RGC‐derived HR patient subgroups in the PT revealed the deregulation of key WNT pathway‐associated genes, including DKK1, MYC, CTNNB1 and LEF1. Therefore, the RGC prognostic stratification in the PT reflects the deregulation of the upstream regulatory molecular machinery towards the WNT‐β‐catenin‐MYC axis.
DKK1 has previously been demonstrated as a promising diagnostic and prognostic factor of HCC (Shen et al., 2012; Yu et al., 2009). After RGC‐based stratification, DKK1 was the most up‐regulated DEG between the HRT and LRT subgroups (PT) in both LCI and Singapore cohorts (Table S8) and was found to be a pro‐oncogenic prognostic factor (Fig. S12A,B). This finding was validated using quantitative RT‐PCR (Fig. S11), strongly confirming the results of previous reports. Additionally, quantitative DKK1 immunostaining demonstrated a significant association between DKK1 overexpression and the RGC classification (Fig. S12; see the Supporting information: Image based analysis of immunochemistry slides). Because DKK1 has been demonstrated to be a pathologically essential and strong prognostic factor in several studies, including ours, DKK1 could be a potential candidate for a future preclinical study of anti‐DKK1 therapy in HCC, as described for myeloma (Fulciniti et al., 2009) and osteosarcoma (Goldstein et al., 2016).
The results of the present study suggest that the subset of TER pathway genes (including the RGC genes) and multiple DEGs associated with alterations of this pathway might simultaneously be controlled by MYC in the PT and AT cells of HCC patients (Fig. 5A–E). By contrast to PT, we did not observe a significant enrichment of deregulated WNT pathway genes in AT (Fig. S7B), indicating that other factors, such as progression of viral HBV and/or chronic liver disease (Chan et al., 2004), may deregulate AT‐associated MYC expression and TER pathway genes during HCC progression. Interestingly, the HBx HBV viral protein can cooperate with MYC to support ribosome biogenesis in HCC cell lines (Shukla and Kumar, 2012).
CPG‐based prognostic biomarker preselection resulted in the detection of enriched FA/GO terms, where the enrichment for TER genes substantially predominated over the enrichment for cell cycle/cell division genes (Figs 1F and S4; see also the Supporting information: MYC as a key regulator of ribosomal pathway in HCC PT and AT).
Furthermore, we found that HR patient HCC subgroups after RGC stratification were characterized by a predominance of up‐regulated TER genes and a subset of down‐regulated liver metabolism genes (Fig. 4). In this respect, an interesting study (Coulouarn et al., 2006) described a comparison of the global gene expression profiles of liver pre‐neoplastic nodules in three transgenic mouse models with the over‐expression of c‐Myc alone, E2f1 alone, and both E2f1/c‐Myc, respectively. Interestingly, the gene expression profiles for the liver pre‐neoplastic nodules detected in the c‐Myc over‐expression mouse model were specifically characterized by induction of the genes involved in protein synthesis and the repression of the genes regulating liver metabolism. Noteworthy, the gene expression patterns observed in HRT and HRA subgroups (Fig. 4) displayed a remarkable similarity with that of the transgenic Myc mouse model of pre‐neoplastic liver nodules. We suggest that the results and RGC‐based prognostic model developed in the present study probably reflect the essential pathobiological processes in early‐stage MYC‐driven malignization in AT liver cells, which consequently affect tumor progression and poor OS of HCC patients.
Recent studies support this notion, highlighting many examples of the tumorigenic extra‐ribosomal functions of the genes involved in translation (Kim et al., 2004; Wang et al., 2015b) and their active and important roles in cell cycle regulation and apoptosis (Stumpf et al., 2013). At certain stages of tumorigenesis, TER pathway genes could play a role in pro‐oncogenic dysregulation, malignization and cancer progression in liver tissue. In this context, uncontrolled cell cycle and cell division, as major features of malignancy and progression drivers distinguishing PT from AT (Fig. 1F), may be considered just as another component of the entire pathobiology process.
Details of the molecular mechanisms underlying the co‐expression of pro‐oncogenic TER genes in PT and AT are not understood; this could be the subject of future studies. However, this does not exclude the possibility that the TER (and many other RGC‐associated genes, some of which were described and considered in the present study) is responsible for the cross‐tissue interactions between PT and AT during HCC progression. For example, TGFBR2, a key extracellular signaling regulator in multiple cancers (Morris et al., 2012), was significantly overexpressed in the HR RGC subgroups in both the PT and AT. The TER pathway genes were significantly associated with genes encoding extracellular vesicular and exosomal components, focal adhesions and adherence junctions (Fig. 4), assuming the hypothetical transfer of ribosomal mRNAs and proteins between the PT and AT as the potential cellular reprogramming/malignization factors. Notably, the mRNAs of multiple TER pathway‐associated genes and rRNAs are often abundant in microvesicles/exosomes secreted by cancer cells (Jenjaroenpun et al., 2013; Van Deun et al., 2014).
Thus, we propose the HCC‐liver tissue interaction model (Fig. 5F) in which the up‐regulation of ribosomal CPGs expression could support tumor cell growth and proliferation in PT by enhancing protein synthesis and additionally inducing similar ribosome biogenesis pathways in AT via the extra‐ribosomal functions. In addition, CPG products could be involved in tumorigenic signaling pathways through activated extracellular exosomal trafficking (Fig. 5F).
The HR patient subgroups identified using the RGC in PT and AT (Figs 2 and 3) would have wide‐ranging targeted treatment options throughout a single molecular cascade (Figs 4 and S8), thus enabling the further identification of novel and efficient drugs for patient subgroups with poor clinical outcomes (see also the Supporting information: Potential therapeutic intervention strategies after RGC‐based HCC risk stratification). Finally, the simultaneous targeting of common prognostic genes and pathways in PT and AT may be considered as an alternative approach for potentially reducing post‐surgery disease relapse.
The RGC stratification is comparatively simple (24 prognostic genes) and robust, yielding biologically consistent and reproducible patient stratification (Fig. 2) with a thoroughly characterized pathway deregulation (Figs 4 and S8) for use as a practical HCC prognostic assay.
There are limitations associated with the present study. First, the tissues and clinical data were collected retrospectively. Thus, this prognostic model needs further validation in a prospective study. Second, the present study only included HCC patients who underwent surgical resection; they are a selected group and some of our results may be not automatically extrapolated to other clinical HCC groups. For example, the RGC was cross‐cohort validated in the LCI cohort, which predominantly includes HBV‐related HCC patients (91%) with liver cirrhosis (92%); the RGC prognostic utility for non‐HBV‐related HCC patients and/or those without liver cirrhosis needs to be confirmed in another study.
In summary, our predictor selection and survival prediction analysis identified the ribosome biogenesis genes co‐expressed in PT and AT from 321 HCC patients. The 44 TER CPGs could be considered as perspective HCC malignancy and prognostic biomarkers and targets for therapeutic implementations. We proposed that the PT‐inducted ribosomal biogenesis associated with the activation of TER pathways leads to extracellular signaling and ‘assimilation’ of a pro‐tumorigenic state in AT cells. In PT and AT, we introduced the 24‐ribosome gene‐based prognostic classifier suggesting a pathophysiological role of the ribosome biogenesis in both tissues.
Author contributions
VAK, PC, OG and SPY were responsible for the study concept and design. PC and KL were responsible for acquisition of clinical and immunohistochemistry data. PC was responsible for liver tissue samples. KHL was responsible for quality control and verification of histological data. MS, HKL, SPY, OG and VAK were responsible for immunohistochemistry quantitative image analysis and its interpretation. OG and VAK were responsible for statistical and bioinformatics analyses. VAK, OG, SPY and PC were responsible for experimental design. SPY and RI were responsible for RNA sample collection, microarrays production and the wet‐lab study. OG, SPY, HKL, PC and VAK were responsible for the discussion of the experimental results and their interpretation. OG, VAK, SPY and MS were responsible for the drafting of the article. OG and VAK were responsible for the final version of the manuscript submitted for publication.
Ethics statement
SingHealth has approved this study centralized Institutional Review Board. Protocol title: An integrative genomic approach for molecular classification of HCC and correlations with the clinical outcomes. Institutional Review Board Ref: 2013/788/B.
Data accessibility
Research data pertaining to this article have been deposited at figshare.com: https://dx.doi.org/10.6084/m9.figshare.5616250.
Supporting information
Fig. S1. 1D‐DDg method stratifies patients onto LR and HR subgroups based on ‘tumor suppressor‐like’ and ‘pro‐oncogenic’ prognostic gene expression patterns.
Fig. S2. Workflow of data analysis and validation.
Fig. S3. Survival analysis for RPL3 (ribosomal protein L3) and SPOP (speckle‐type POZ protein) CPGs.
Fig. S4. FA/GO analysis of TER genes using panther bioinformatics software.
Fig. S5. Identification of TER gene set in the LCI cohort and comparison with the TER gene set from the Singapore cohort.
Fig. S6. Training and cross‐cohort validation of the 41‐gene cell cycle gene signature.
Fig. S7. Up‐regulated DEGs after RGC‐stratification: MetaCore Pathway Maps and GO localization analyses.
Fig. S8. Deregulated WNT pathway in HRT subgroups revealed after the RGC stratification of HCC patients in Singapore and LCI cohorts.
Fig. S9. MYC as a key regulator of genes involved in TER pathway in HCC PT and AT.
Fig. S10. Concordance analysis between expression data from microarray and quantitative RT‐PCR experiments in 12 representative genes.
Fig. S11. Quantitative RT‐PCR validation of 20 representative genes either involved in the RGC or genes differentially expressed in HRT and LRT subgroups.
Fig. S12. Results of the testing of DKK1 relative expression in IHC liver tumor tissue images (PT) in six representative HCC patients using the SVR approach.
Fig. S13. Comparison of RGC prognostic power with other prognostic gene signatures.
Table S1. The flow of HCC patients and variables used in the present study.
Table S2. Checklist of REMARK guidelines in the present study.
Table S3. GO term ‘Translational elongation’ genes and their prognostic characteristics in Singapore dataset.
Table S4. GO term ‘Translational elongation’ genes and their prognostic characteristics in LCI dataset.
Table S5. The 24‐ribosome gene prognostic classifier and the 1‐D DDg‐derived characteristics used in validation analysis.
Table S6. 41‐gene prognostic signature defined by the cell cycle genes differentiating PT and AT samples. Data include Illumina and Affymetrix microarray probes annotation support.
Table S7. Clinical phenotypes associated with the RGC clinical subgroups in PT.
Table S8. The common differentially expressed genes between HRT and LRT prognostic subgroups derived by the RGC in PT.
Table S9. Common differentially expressed genes between HRA and LRA prognostic subgroups derived by the RGC in AT.
Table S10. Unique overlaps of ChIP‐seq binding regions with gene proximal promoters in various gene sets.
Table S11. Literature support of the selected genes involved in endosome functions.
Table S12. Common differentially expressed genes in HR RGC prognostic subgroups in both PT and AT.
Table S13. Oligoprimers used for quantitative RT‐PCR validation of the selected genes.
Acknowledgements
We thank Dr Antonis Giannakakis and Professor John Carson Allen Jr for critical comments and discussions, as well as Dr Sergey Pintus for assistance with the microarray data normalization. OG thanks Dr Igor Kurochkin for fruitful discussions concerning the results and also for guidance with the experimental design. We thank intern students Ms Jacqueline Tai Fei Li and Mr Liu Chong for help with the bioinformatics analysis. This work was supported by the Biomedical Research Council of A*STAR (Agency for Science, Technology and Research), Singapore. The funding agency had no role in the study design, data collection and analysis, preparation of the manuscript or the decision to publish.
Contributor Information
Pierce Kah‐Hoe Chow, Email: pierce.chow.k.h@singhealth.com.sg.
Vladamir A. Kuznetsov, Email: vladimirk@bii.a-star.edu.sg
References
- Arai E, Ushijima S, Gotoh M, Ojima H, Kosuge T, Hosoda F, Shibata T, Kondo T, Yokoi S, Imoto I et al (2009) Genome‐wide DNA methylation profiles in liver tissue at the precancerous stage and in hepatocellular carcinoma. Int J Cancer 125, 2854–2862. [DOI] [PubMed] [Google Scholar]
- Ashtari S, Pourhoseingholi MA, Sharifian A and Zali MR (2015) Hepatocellular carcinoma in Asia: prevention strategy and planning. World J Hepatol 7, 1708–1717. [DOI] [PMC free article] [PubMed] [Google Scholar]
- Boyault S, Rickman DS, de Reynies A, Balabaud C, Rebouissou S, Jeannot E, Herault A, Saric J, Belghiti J, Franco D et al (2007) Transcriptome classification of HCC is related to gene alterations and to new therapeutic targets. Hepatology 45, 42–52. [DOI] [PubMed] [Google Scholar]
- Bruix J, Reig M and Sherman M (2016) Evidence‐based diagnosis, staging, and treatment of patients with hepatocellular carcinoma. Gastroenterology 150, 835–853. [DOI] [PubMed] [Google Scholar]
- Bruix J and Sherman M (2011) Management of hepatocellular carcinoma: an update. Hepatology 53, 1020–1022. [DOI] [PMC free article] [PubMed] [Google Scholar]
- Chan KL, Guan XY and Ng IO (2004) High‐throughput tissue microarray analysis of c‐myc activation in chronic liver diseases and hepatocellular carcinoma. Hum Pathol 35, 1324–1331. [DOI] [PubMed] [Google Scholar]
- Chan XH, Nama S, Gopal F, Rizk P, Ramasamy S, Sundaram G, Ow GS, Ivshina AV, Tanavde V, Haybaeck J et al (2012) Targeting glioma stem cells by functional inhibition of a prosurvival oncomiR‐138 in malignant gliomas. Cell Rep 2, 591–602. [DOI] [PubMed] [Google Scholar]
- Chen L, Jenjaroenpun P, Pillai AM, Ivshina AV, Ow GS, Efthimios M, Zhiqun T, Tan TZ, Lee SC, Rogers K et al (2017) Transposon insertional mutagenesis in mice identifies human breast cancer susceptibility genes and signatures for stratification. Proc Natl Acad Sci U S A 114, E2215–E2224. [DOI] [PMC free article] [PubMed] [Google Scholar]
- Chow PK, ChooSP Ng DC, Lo RH, Wang ML, Toh HC, Tai DW, Goh BK, Wong JS, Tay KH et al (2016) National cancer centre Singapore consensus guidelines for hepatocellular carcinoma. Liver Cancer 5, 97–106. [DOI] [PMC free article] [PubMed] [Google Scholar]
- Coulouarn C, Gomez‐Quiroz LE, Lee JS, Kaposi‐Novak P, Conner EA, Goldina TA, Onishchenko GE, Factor VM, Thorgeirsson SS (2006) Oncogene‐specific gene expression signatures at preneoplastic stage in mice define distinct mechanisms of hepatocarcinogenesis. Hepatology 44, 1003–1011. [DOI] [PubMed] [Google Scholar]
- Degli Esposti D, Hamelin J, Bosselut N, Saffroy R, Sebagh M, Pommier A, Martel C and Lemoine A (2012) Mitochondrial roles and cytoprotection in chronic liver injury. Biochem Res Int 2012, 387626. [DOI] [PMC free article] [PubMed] [Google Scholar]
- Fulciniti M, Tassone P, Hideshima T, Vallet S, Nanjappa P, Ettenberg SA, Shen Z, Patel N, Tai YT, Chauhan D et al (2009) Anti‐DKK1 mAb (BHQ880) as a potential therapeutic agent for multiple myeloma. Blood 114, 371–379. [DOI] [PMC free article] [PubMed] [Google Scholar]
- Goh BK, Teo JY, Chan CY, Lee SY, Jeyaraj P, Cheow PC, Chow PK, Ooi LL and Chung AY (2016) Importance of tumor size as a prognostic factor after partial liver resection for solitary hepatocellular carcinoma: implications on the current AJCC staging system. J Surg Oncol 113, 89–93. [DOI] [PubMed] [Google Scholar]
- Goldstein SD, Trucco M, Bautista W, Hayashi M and Loeb DM (2016) A monoclonal antibody against the Wnt signaling inhibitor dickkopf‐1 inhibits osteosarcoma metastasis in a preclinical model. Oncotarget 7, 21114–21123. [DOI] [PMC free article] [PubMed] [Google Scholar]
- Grinchuk OV, Motakis E, Yenamandra SP, Ow GS, Jenjaroenpun P, Tang Z, Yarmishyn AA, Ivshina AV and Kuznetsov VA (2015) Sense‐antisense gene‐pairs in breast cancer and associated pathological pathways. Oncotarget 6, 42197–42221. [DOI] [PMC free article] [PubMed] [Google Scholar]
- Han KH, Kudo M, Ye SL, Choi JY, Poon RT, Seong J, Park JW, Ichida T, Chung JW, Chow P et al (2011) Asian consensus workshop report: expert consensus guideline for the management of intermediate and advanced hepatocellular carcinoma in Asia. Oncology 81 (Suppl. 1), 158–164. [DOI] [PubMed] [Google Scholar]
- Hirata H, Sugimachi K, Komatsu H, Ueda M, Masuda T, Uchi R, Sakimura S, Nambara S, Saito T, Shinden Y et al (2016) Decreased expression of fructose‐1,6‐bisphosphatase associates with glucose metabolism and tumor progression in hepatocellular carcinoma. Cancer Res 76, 3265–3276. [DOI] [PubMed] [Google Scholar]
- Hoshida Y, Brunet JP, Tamayo P, Golub TR and Mesirov JP (2007) Subclass mapping: identifying common subtypes in independent disease data sets. PLoS One 2, e1195. [DOI] [PMC free article] [PubMed] [Google Scholar]
- Hoshida Y, Moeini A, Alsinet C, Kojima K and Villanueva A (2012) Gene signatures in the management of hepatocellular carcinoma. Semin Oncol 39, 473–485. [DOI] [PubMed] [Google Scholar]
- Hoshida Y, Villanueva A, Kobayashi M, Peix J, Chiang DY, Camargo A, Gupta S, Moore J, Wrobel MJ, Lerner J et al (2008) Gene expression in fixed tissues and outcome in hepatocellular carcinoma. N Engl J Med 359, 1995–2004. [DOI] [PMC free article] [PubMed] [Google Scholar]
- da Huang W, Sherman BT and Lempicki RA (2009a) Systematic and integrative analysis of large gene lists using DAVID bioinformatics resources. Nat Protoc 4, 44–57. [DOI] [PubMed] [Google Scholar]
- da Huang W, Sherman BT and Lempicki RA (2009b) Bioinformatics enrichment tools: paths toward the comprehensive functional analysis of large gene lists. Nucleic Acids Res 37, 1–13. [DOI] [PMC free article] [PubMed] [Google Scholar]
- International Working Party (1995) Terminology of nodular hepatocellular lesions. Hepatology 22, 983–993. [DOI] [PubMed] [Google Scholar]
- Jenjaroenpun P, Kremenska Y, Nair VM, Kremenskoy M, Joseph B and Kurochkin IV (2013) Characterization of RNA in exosomes secreted by human breast cancer cell lines using next‐generation sequencing. PeerJ 1, e201. [DOI] [PMC free article] [PubMed] [Google Scholar]
- Kauffmann A, Gentleman R and Huber W (2009) arrayQualityMetrics–a bioconductor package for quality assessment of microarray data. Bioinformatics 25, 415–416. [DOI] [PMC free article] [PubMed] [Google Scholar]
- Kim SM, Leem SH, Chu IS, Park YY, Kim SC, Kim SB, Park ES, Lim JY, Heo J, Kim YJ et al (2012) Sixty‐five gene‐based risk score classifier predicts overall survival in hepatocellular carcinoma. Hepatology 55, 1443–1452. [DOI] [PMC free article] [PubMed] [Google Scholar]
- Kim JH, You KR, Kim IH, Cho BH, Kim CY and Kim DG (2004) Over‐expression of the ribosomal protein L36a gene is associated with cellular proliferation in hepatocellular carcinoma. Hepatology 39, 129–138. [DOI] [PubMed] [Google Scholar]
- Kuznetsov VA, Senko OV, Miller LD and Ivshina AV (2006) Statistically weighted voting analysis of microarrays for molecular pattern selection and discovery cancer genotypes. Int J of Comput Sci Netw Secur 6, 73–83. [Google Scholar]
- Lee HJ, Kang HJ, Kim KM, Yu ES, Kim KH, Kim SM, Kim TW, Shim JH, Lim YS, Lee HC et al (2015) Fibroblast growth factor receptor isotype expression and its association with overall survival in patients with hepatocellular carcinoma. Clin Mol Hepatol 21, 60–70. [DOI] [PMC free article] [PubMed] [Google Scholar]
- Lindstrom MS (2009) Emerging functions of ribosomal proteins in gene‐specific transcription and translation. Biochem Biophys Res Commun 379, 167–170. [DOI] [PubMed] [Google Scholar]
- Llovet JM, Di Bisceglie AM, Bruix J, Kramer BS, Lencioni R, Zhu AX, Sherman M, Schwartz M, Lotze M, Talwalkar J et al (2008a) Design and endpoints of clinical trials in hepatocellular carcinoma. J Natl Cancer Inst 100, 698–711. [DOI] [PubMed] [Google Scholar]
- Llovet JM, Ricci S, Mazzaferro V, Hilgard P, Gane E, Blanc JF, de Oliveira AC, Santoro A, Raoul JL, Forner A et al (2008b) Sorafenib in advanced hepatocellular carcinoma. N Engl J Med 359, 378–390. [DOI] [PubMed] [Google Scholar]
- Llovet JM, Schwartz M and Mazzaferro V (2005) Resection and liver transplantation for hepatocellular carcinoma. Semin Liver Dis 25, 181–200. [DOI] [PubMed] [Google Scholar]
- Lou C, Du Z, Yang B, Gao Y, Wang Y and Fang S (2009) Aberrant DNA methylation profile of hepatocellular carcinoma and surgically resected margin. Cancer Sci 100, 996–1004. [DOI] [PMC free article] [PubMed] [Google Scholar]
- Mah WC, Thurnherr T, Chow PK, Chung AY, Ooi LL, Toh HC, Teh BT, Saunthararajah Y and Lee CG (2014) Methylation profiles reveal distinct subgroup of hepatocellular carcinoma patients with poor prognosis. PLoS One 9, e104158. [DOI] [PMC free article] [PubMed] [Google Scholar]
- McShane LM, Altman DG, Sauerbrei W, Taube SE, Gion M and Clark GM (2005) Reporting recommendations for tumor marker prognostic studies (REMARK). J Natl Cancer Inst 97, 1180–1184. [DOI] [PubMed] [Google Scholar]
- Minguez B, Hoshida Y, Villanueva A, Toffanin S, Cabellos L, Thung S, Mandeli J, Sia D, April C, Fan JB et al (2011) Gene‐expression signature of vascular invasion in hepatocellular carcinoma. J Hepatol 55, 1325–1331. [DOI] [PMC free article] [PubMed] [Google Scholar]
- Morris SM, Baek JY, Koszarek A, Kanngurn S, Knoblaugh SE and Grady WM (2012) Transforming growth factor‐beta signaling promotes hepatocarcinogenesis induced by p53 loss. Hepatology 55, 121–131. [DOI] [PMC free article] [PubMed] [Google Scholar]
- Motakis E, Ivshina AV and Kuznetsov VA (2009) Data‐driven approach to predict survival of cancer patients: estimation of microarray genes’ prediction significance by Cox proportional hazard regression model. IEEE Eng Med Biol Mag 28, 58–66. [DOI] [PubMed] [Google Scholar]
- Nault JC, De Reynies A, Villanueva A, Calderaro J, Rebouissou S, Couchy G, Decaens T, Franco D, Imbeaud S, Rousseau F et al (2013) A hepatocellular carcinoma 5‐gene score associated with survival of patients after liver resection. Gastroenterology 145, 176–187. [DOI] [PubMed] [Google Scholar]
- Newcombe RG (1998) Two‐sided confidence intervals for the single proportion: comparison of seven methods. Stat Med 17, 857–872. [DOI] [PubMed] [Google Scholar]
- Orimo T, Ojima H, Hiraoka N, Saito S, Kosuge T, Kakisaka T, Yokoo H, Nakanishi K, Kamiyama T, Todo S et al (2008) Proteomic profiling reveals the prognostic value of adenomatous polyposis coli‐end‐binding protein 1 in hepatocellular carcinoma. Hepatology 48, 1851–1863. [DOI] [PubMed] [Google Scholar]
- Polyak K, Haviv I and Campbell IG (2009) Co‐evolution of tumor cells and their microenvironment. Trends Genet 25, 30–38. [DOI] [PubMed] [Google Scholar]
- Reich M, Liefeld T, Gould J, Lerner J, Tamayo P and Mesirov JP (2006) GenePattern 2.0. Nat Genet 38, 500–501. [DOI] [PubMed] [Google Scholar]
- Roessler S, Jia HL, Budhu A, Forgues M, Ye QH, Lee JS, Thorgeirsson SS, Sun Z, Tang ZY, Qin LX et al (2010) A unique metastasis gene signature enables prediction of tumor relapse in early‐stage hepatocellular carcinoma patients. Cancer Res 70, 10202–10212. [DOI] [PMC free article] [PubMed] [Google Scholar]
- Roessler S, Long EL, Budhu A, Chen Y, Zhao X, Ji J, Walker R, Jia HL, Ye QH, Qin LX et al (2012) Integrative genomic identification of genes on 8p associated with hepatocellular carcinoma progression and patient survival. Gastroenterology 142(957–966), e912. [DOI] [PMC free article] [PubMed] [Google Scholar]
- Shapot VS and Potapova GI (1986) Methodological approaches to the study of tumor and body tissue metabolism in vitro and in vivo. Eksp Onkol 8, 3–9. [PubMed] [Google Scholar]
- Shapot VS, Vornovitskaya GI, Gorozhanskaya EG, Davidova SY, Zhubanova AA, Krechetova GD and Chudinova IA (1972) Notes on some peculiarities of enzymic processes in malignant tumours and tissues of the host. Neoplasma 19, 335–340. [PubMed] [Google Scholar]
- Shen Q, Fan J, Yang XR, Tan Y, Zhao W, Xu Y, Wang N, Niu Y, Wu Z, Zhou J et al (2012) Serum DKK1 as a protein biomarker for the diagnosis of hepatocellular carcinoma: a large‐scale, multicentre study. Lancet Oncol 13, 817–826. [DOI] [PubMed] [Google Scholar]
- Shukla SK and Kumar V (2012) Hepatitis B virus X protein and c‐Myc cooperate in the upregulation of ribosome biogenesis and in cellular transformation. FEBS J 279, 3859–3871. [DOI] [PubMed] [Google Scholar]
- Simon RM, Paik S and Hayes DF (2009) Use of archived specimens in evaluation of prognostic and predictive biomarkers. J Natl Cancer Inst 101, 1446–1452. [DOI] [PMC free article] [PubMed] [Google Scholar]
- Skill NJ, Scott RE, Wu J and Maluccio MA (2011) Hepatocellular carcinoma associated lipid metabolism reprogramming. J Surg Res 169, 51–56. [DOI] [PubMed] [Google Scholar]
- Smola A and Vapnik V (1997) Support vector regression machines. Adv Neural Inf Process Syst 9, 155–161. [Google Scholar]
- Stumpf CR, Moreno MV, Olshen AB, Taylor BS and Ruggero D (2013) The translational landscape of the mammalian cell cycle. Mol Cell 52, 574–582. [DOI] [PMC free article] [PubMed] [Google Scholar]
- Tannock IF and Hill RP (2013) The basic science of oncology, 5th ed. McGraw‐Hill, New York, NY. [Google Scholar]
- Thomas PD, Kejariwal A, Guo N, Mi H, Campbell MJ, Muruganujan A and Lazareva‐Ulitsky B (2006) Applications for protein sequence‐function evolution data: mRNA/protein expression analysis and coding SNP scoring tools. Nucleic Acids Res 34, W645–W650. [DOI] [PMC free article] [PubMed] [Google Scholar]
- Van Deun J, Mestdagh P, Sormunen R, Cocquyt V, Vermaelen K, Vandesompele J, Bracke M, De Wever O and Hendrix A (2014) The impact of disparate isolation methods for extracellular vesicles on downstream RNA profiling. J Extracell Vesicles 3, 24858. [DOI] [PMC free article] [PubMed] [Google Scholar]
- Vauthey JN, Walsh GL, Vlastos G and Lauwers GY (2000) Importance of field cancerisation in clinical oncology. Lancet Oncol 1, 15–16. [DOI] [PubMed] [Google Scholar]
- Wang C, Cigliano A, Jiang L, Li X, Fan B, Pilo MG, Liu Y, Gui B, Sini M, Smith JW et al (2015b) 4EBP1/eIF4E and p70S6K/RPS6 axes play critical and distinct roles in hepatocarcinogenesis driven by AKT and N‐Ras proto‐oncogenes in mice. Hepatology 61, 200–213. [DOI] [PMC free article] [PubMed] [Google Scholar]
- Wang J, Su H, Han X and Xu K (2014) Inhibition of fibroblast growth factor receptor signaling impairs metastasis of hepatocellular carcinoma. Tumour Biol 35, 11005–11011. [DOI] [PubMed] [Google Scholar]
- Wang J, Zuo Y, Man YG, Avital I, Stojadinovic A, Liu M, Yang X, Varghese RS, Tadesse MG and Ressom HW (2015a) Pathway and network approaches for identification of cancer signature markers from omics data. J Cancer 6, 54–65. [DOI] [PMC free article] [PubMed] [Google Scholar]
- Yang J, Jin X, Yan Y, Shao Y, Pan Y, Roberts LR, Zhang J, Huang H and Jiang J (2017) Inhibiting histone deacetylases suppresses glucose metabolism and hepatocellular carcinoma growth by restoring FBP1 expression. Sci Rep 7, 43864. [DOI] [PMC free article] [PubMed] [Google Scholar]
- Yu B, Yang X, Xu Y, Yao G, Shu H, Lin B, Hood L, Wang H, Yang S, Gu J et al (2009) Elevated expression of DKK1 is associated with cytoplasmic/nuclear beta‐catenin accumulation and poor prognosis in hepatocellular carcinomas. J Hepatol 50, 948–957. [DOI] [PubMed] [Google Scholar]
Associated Data
This section collects any data citations, data availability statements, or supplementary materials included in this article.
Supplementary Materials
Fig. S1. 1D‐DDg method stratifies patients onto LR and HR subgroups based on ‘tumor suppressor‐like’ and ‘pro‐oncogenic’ prognostic gene expression patterns.
Fig. S2. Workflow of data analysis and validation.
Fig. S3. Survival analysis for RPL3 (ribosomal protein L3) and SPOP (speckle‐type POZ protein) CPGs.
Fig. S4. FA/GO analysis of TER genes using panther bioinformatics software.
Fig. S5. Identification of TER gene set in the LCI cohort and comparison with the TER gene set from the Singapore cohort.
Fig. S6. Training and cross‐cohort validation of the 41‐gene cell cycle gene signature.
Fig. S7. Up‐regulated DEGs after RGC‐stratification: MetaCore Pathway Maps and GO localization analyses.
Fig. S8. Deregulated WNT pathway in HRT subgroups revealed after the RGC stratification of HCC patients in Singapore and LCI cohorts.
Fig. S9. MYC as a key regulator of genes involved in TER pathway in HCC PT and AT.
Fig. S10. Concordance analysis between expression data from microarray and quantitative RT‐PCR experiments in 12 representative genes.
Fig. S11. Quantitative RT‐PCR validation of 20 representative genes either involved in the RGC or genes differentially expressed in HRT and LRT subgroups.
Fig. S12. Results of the testing of DKK1 relative expression in IHC liver tumor tissue images (PT) in six representative HCC patients using the SVR approach.
Fig. S13. Comparison of RGC prognostic power with other prognostic gene signatures.
Table S1. The flow of HCC patients and variables used in the present study.
Table S2. Checklist of REMARK guidelines in the present study.
Table S3. GO term ‘Translational elongation’ genes and their prognostic characteristics in Singapore dataset.
Table S4. GO term ‘Translational elongation’ genes and their prognostic characteristics in LCI dataset.
Table S5. The 24‐ribosome gene prognostic classifier and the 1‐D DDg‐derived characteristics used in validation analysis.
Table S6. 41‐gene prognostic signature defined by the cell cycle genes differentiating PT and AT samples. Data include Illumina and Affymetrix microarray probes annotation support.
Table S7. Clinical phenotypes associated with the RGC clinical subgroups in PT.
Table S8. The common differentially expressed genes between HRT and LRT prognostic subgroups derived by the RGC in PT.
Table S9. Common differentially expressed genes between HRA and LRA prognostic subgroups derived by the RGC in AT.
Table S10. Unique overlaps of ChIP‐seq binding regions with gene proximal promoters in various gene sets.
Table S11. Literature support of the selected genes involved in endosome functions.
Table S12. Common differentially expressed genes in HR RGC prognostic subgroups in both PT and AT.
Table S13. Oligoprimers used for quantitative RT‐PCR validation of the selected genes.
Data Availability Statement
Research data pertaining to this article have been deposited at figshare.com: https://dx.doi.org/10.6084/m9.figshare.5616250.