Abstract
Both cyclooxygenase (COX)-1 and COX-2, encoded by Ptgs1 and Ptgs2, function coordinately during inflammation. But the relative contributions and compensations of COX-1 and COX-2 to inflammatory responses remain unanswered. We used three engineered mouse lines where the Ptgs1 and Ptgs2 genes substitute for one another to discriminate the distinct roles and interchangeability of COX isoforms during systemic inflammation. In macrophages, kidneys, and lungs, “flipped” Ptgs genes generate a “reversed” COX expression pattern, where the knock-in COX-2 is expressed constitutively and the knock-in COX-1 is lipopolysaccharide inducible. A panel of eicosanoids detected in serum and kidney demonstrates that prostaglandin (PG) biosynthesis requires native COX-1 and cannot be rescued by the knock-in COX-2. Our data further reveal preferential compensation of COX isoforms for prostanoid production in macrophages and throughout the body, as reflected by urinary PG metabolites. NanoString analysis indicates that inflammatory networks can be maintained by isoform substitution in inflamed macrophages. However, COX-1>COX-2 macrophages show reduced activation of inflammatory signaling pathways, indicating that COX-1 may be replaced by COX-2 within this complex milieu, but not vice versa. Collectively, each COX isoform plays a distinct role subject to subcellular environment and tissue/cell-specific conditions, leading to subtle compensatory differences during systemic inflammation.
Keywords: eicosanoid; prostaglandin, gene targeting; animal model; macrophage; lipopolysaccharide; cyclooxygenase
Two prostaglandin (PG) H synthase isoforms, commonly known as cyclooxygenase (COX)-1 and COX-2, are encoded by Ptgs1 and Ptgs2, respectively. COX-derived prostanoids are an important family of autocrine and paracrine lipid mediators that are involved in various physiological and pathophysiological processes (1–3). The COX enzymes are targeted by the widely prescribed nonsteroidal anti-inflammatory drugs, known for their analgesic, antipyretic, and anti-inflammatory actions (4), and have been intensely studied for this reason. Scientists have pondered over the unique roles these two COX isoforms play during inflammation, and how the generated PGs mediate their inflammation-evoking effects. Combined data from several murine inflammation models support a complex regulatory network in eicosanoid signaling (5), showing that both isoforms may function coordinately during inflammation (6). However, the relative contributions and possible compensations of COX-1 and COX-2 to inflammatory responses are incompletely resolved.
In simplistic terms, COX-1 is cast as the primary source of “housekeeping” PGs for general homeostatic regulation throughout the body, whereas COX-2 is more readily induced and is the dominant source of PGs mediating inflammation (7). This hypothesis afforded a long line of experiments to delve deeper into COX-2 selective inhibitors (Coxibs) with the promise of blocking the deleterious actions of PGs in chronic inflammation, pain, and fever (8). However, several studies show that prostanoids formed via COX-1 are also involved (9, 10). Mice with Ptgs1 gene disruption showed decreased ear edema induced by arachidonic acid (AA) (10, 11). In contrast, mice with Ptgs2 disruption display a normal inflammatory response to treatments with AA, but are susceptible to peritonitis (12, 13). Further studies demonstrated the differential contribution of the two COX isoforms in inflammatory settings, such as tetradecanoyl phorbol acetate-triggered ear edema (10, 12, 14) and carrageenan-induced air pouch and paw edema models (15, 16). Additional evidence showed that elimination of COX-1 alone was not sufficient to cause gastric ulcers and that the combined inhibition of both COX isoforms could lead to gastric toxicity (17). These mixed messages ratify the concept that individual COX isoforms may act independently, but most likely interdependently, to generate a variety of lipid mediators within the context of a complex milieu of inflammation.
There is also a temporal sequence of events in acute inflammation, governed by eicosanoid profile switching (18). Thus, the eicosanoids made during the initial phase, dependent on COX-1, may be replaced by other lipid mediators, derived mainly from COX-2 (5), and potentially by specialized pro-resolving mediators in the resolution phase (19, 20). One unanswered question, before the initiation of the resolution phase, is which COX isoform plays a dominant role during a systemic inflammatory event. Some data are consistent with COX-1 being more important than COX-2 with respect to prostanoid-mediated pathophysiological consequences in severe systemic inflammation (21). However, other researchers provided several lines of evidence demonstrating that COX-2 is a more critical component associated with endotoxemia (22). Very recent data showed that inflammatory pain is preferentially dependent on PGE2 generated by COX-2 in neural cells (23). Conflicting results have been obtained regarding the compensatory mechanism of COX-1 when COX-2 function is disrupted (24) or replaced (25). To date, there has been no report on the possible interchangeability of these two isoforms during systemic inflammation.
Using our novel mouse strains (COX-1>COX-2, COX-2>COX-1, and Reversa), in which one or two COX isoforms are exchanged (26), we carried out the current study to investigate the distinct roles and compensatory possibilities of the two COX isoforms in host responses to bacterial endotoxemia. Using gene arrays and lipidomic assays, we scanned the effect of flipping the two COX isoforms on inflammatory gene expression and a panel of eicosanoids, and captured a possible interchangeability between these two isoforms in terms of eicosanoid synthesis along with some altered cytokine and chemokine gene expression profiles.
MATERIALS AND METHODS
Mice
A COX-1>COX-2 mouse strain on a mixed C57BL/6×129/Sv genetic background was established previously by replacing most of exons 1–9 of Ptgs2 with the entire Ptgs1 cDNA (13). These mice were backcrossed with the C57BL/6 strain for 10 generations. A COX-2>COX-1 mouse strain on the C57BL/6 background was established by partial replacement of the coding region of Ptgs1 (exons 3–10) with Ptgs2 exons 2–10, while leaving the Ptgs1 promoter region intact (26). Cross-breeding of COX-1>COX-2 and COX-2>COX-1 mice produces “Reversa” mice. Genotyping was performed routinely by PCR on DNA isolated from tail biopsies. All procedures for animal experimentation were undertaken in accordance with the principles and guidelines of the Canadian Council on Animal Care and were approved by the Queen’s University Animal Care Committee.
Lipopolysaccharide-induced systemic inflammation
Lipopolysaccharide (LPS) (1.5–5 mg/kg body weight) induces systemic inflammation in rodents (27–29); however, low-dose LPS (0.01 mg/kg) is not sufficient to increase PGE2 levels in serum or peritoneal lavage fluid of mice (30). Systemic inflammation was induced via injection of a single dose of Escherichia coli LPS (serotype O111:B4; Sigma-Aldrich). We confirmed that 2 mg/kg of LPS challenge was sufficient to induce gene expression of pro-inflammatory interleukin (IL)-6 and monocyte chemotactic protein 1 (MCP-1, CCL2) (data not shown). Thus, a dose of 2 mg/kg LPS (body weight), diluted in sterile PBS, was injected intraperitoneally into WT, COX-2>COX-1, COX-1>COX-2, and Reversa mice (12–16 weeks of age; n = 6 each group). An equivalent volume of PBS alone was given to another group of WT mice (control group). No endotoxemic mortality was observed during the course of the experiment.
Urine samples were collected between 3 and 6 h postinjection. At 6 h, blood was collected from the submandibular vein into heparinized capillary tubes, and then plasma was obtained via centrifugation prior to euthanization by CO2 asphyxiation. Additional blood was drawn by cardiac puncture for serum analysis. Urine, plasma, and serum were all frozen at −80°C until PG profiling. The peritoneal cavities were initially washed with 0.5 ml cold PBS. The peritoneal lavage fluids were then centrifuged and saved for measurement of PG profiles by negative ion ESI LC-MS/MS), normalized to the protein concentration (see details below) (13). The cell pellet (mainly macrophages) was pooled with a subsequent 5 ml lavage. After removal of the nonadherent cells, as described (31), the remaining cells were harvested for RNA or protein extraction.
Western blot analysis
Whole-cell or various tissue lysates were prepared with RIPA lysis buffer (Millipore Corporation, Billerica, MA) or T-PER protein extraction reagent (Thermo Scientific) plus a protease inhibitor cocktail (Roche Diagnostics, Indianapolis, IN). Western blot analysis was carried out as outlined previously (26).
Quantitative real-time PCR
Total RNA was extracted from LPS-elicited macrophages using the RNeasy mini kit (#74104; Qiagen) and quantitative real-time PCR was performed using a thermal cycler (Applied Biosystems Model 7500) with SYBR Green PCR master mix (Bio-Rad) (32). The 18S rRNA was used as a control housekeeping gene and data were expressed as mRNA expression relative to 18S rRNA expression. Oligonucleotide primers were acquired from Eurofins MWG Operon (Huntsville, AL) and are listed in supplemental Table S1.
PG metabolite analyses
The previously described protocol was used with a few modifications (26). The analysis was performed on a Waters ACQUITY ultra-performance LC system in-line with a Waters Xevo TQ-S triple quadrupole mass spectrometer. The ultra-performance LC system directly interfaced with the negative-mode ESI source of the mass spectrometer using multiple reaction monitoring. Peritoneal lavage (100 μl per sample) was extracted and analyzed. Data were normalized to the amount of protein (milligrams) in the lavage. To adjust for rates of urine production and sample collection, data were normalized to creatinine levels and expressed as nanograms of metabolite per milligram of creatinine.
Six hours after LPS injection, kidneys were dissected and frozen for PG profiling. Kidney medullar PG extraction and measurement was carried out as previously described (33). Briefly, slices of inner medulla were carefully dissected and homogenized in 1 ml of ice-cold PBS containing 100 μM indomethacin. Residual tissue was separated by centrifugation and the supernatant was collected and 50 μl per sample of the kidney tissue were extracted and analyzed. Data were normalized to the protein content in the kidney preparation.
AA-mediated ear inflammation
AA (2 mg in 10 μl acetone) was applied to the inside of the left ear and the same amount of vehicle was applied to the right ear of 8-week-old mice. Ear punches (8 mm) were taken and weighed after 1 h treatment (11).
NanoString analysis
Peritoneal macrophages from mice challenged with either LPS (2 mg/kg body weight; WT, COX-2>COX-1, COX-1>COX-2, and Reversa mice) or PBS (control, WT mice) were pelleted and stored at −80°C until further analysis. RNA was extracted as described earlier and the quality of the isolated RNA was checked with Agilent RNA 6000 nano assay kit reagents using an Agilent 2100 bioanalyzer (Agilent Technologies, Santa Clara, CA). Samples with a RNA integrity number of 7.0 or higher were used for NanoString analysis. The RNA samples were quantified using a standard Nanodrop ND-1000 spectrophotometer (Nanodrop, Wilmington, DE). The RNA concentrations were then adjusted to 20 ng/μl.
RNA (100 ng) was used to determine the levels of gene expression. Prebuilt mouse inflammation v2 panels (XT-CSO-MIN2-12) were distributed by NanoString Technologies. The CodeSets consisted of 248 endogenous genes, 6 internal reference genes, 8 negative control genes, and 6 positive control genes. Procedures were performed according to the manufacturer’s protocol (NanoString Technologies, Seattle, WA). In brief, reactions were hybridized for about 18 h at 65°C, after which the products were run through the nCounter preparation station for removal of excess probes. Raw data were generated with the nCounter digital analyzer by counting individual barcodes. Collected data were imported into nSolver 3.0 software (NanoString Technologies). Annotated genotypes (WT, COX-2>COX-1, COX-1>COX-2, and Reversa; n = 6 each) and treatments (control or LPS) were used to group the data. Grouped data were then normalized to the geometric means of spiked-in positive controls (controls for assay efficiency) and spiked-in negative controls (normalized for background). The data were further normalized to the housekeeping genes (34).
NanoString gene expression counts were then analyzed with the nSolver 3.0 software to identify significantly regulated probes. A minimum threshold of 2-fold change was set to select the differentially regulated probes/genes, relative to the control group. Significantly regulated probes were sorted by using a Venn diagram generator (http://bioinfogp.cnb.csic.es/tools/venny). Heat maps representing the expression of probes across groups were generated and hierarchically clustered based on the default parameters of the software. Differentially expressed genes were functionally annotated and analyzed via nCounter Advanced Analysis (version 1.1.4). Pathway scores were fitted using the first principal component of each gene set’s data based on the default Pathway Modules in the nCounter Advanced Analysis. The data discussed in this publication have been deposited in NCBI’s Gene Expression Omnibus (GEO) and are accessible through GEO series accession number GSE102735.
To further analyze networks and pathways involved in the genes in four different groups of mice challenged by LPS, the genes were analyzed using Ingenuity Pathway Analysis (IPA) (Qiagen, version 31813283), as previously described (35). The following settings were used for the analysis: network analysis, direct and indirect relationship; molecules per network, 35; networks per analysis, 25; data sources, all; confidence, experimentally observed; species, mouse; and tissues and cells lines, all. IPA uses Fisher’s exact test to determine which canonical pathways or biological functions are significantly linked to the input gene set compared with the whole Ingenuity knowledge base.
Data analysis
Data are expressed as mean ± SEM. The Kolmogorov-Smirnov test was used as a normality test. One-way ANOVA analysis was used for normally distributed variables and the Dunnett T3 post hoc comparisons were conducted when the ANOVA indicated a significant difference among the compared means. Nonparametric Kruskal-Wallis tests were used for nonnormally distributed variables. Tests were two-tailed and values of P < 0.05 were considered statistically significant. The statistical analysis was performed with GraphPad Prism 7 software (GraphPad, San Diego, CA).
RESULTS
COX expression in inflamed tissues
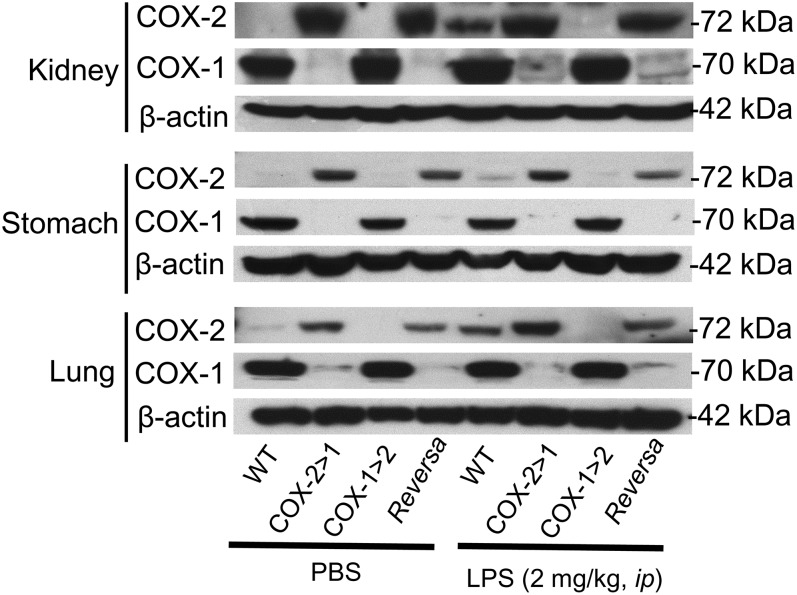
Western blot analysis (Fig. 1) shows that COX-1 (70 kDa) is completely knocked-out in all COX-2>COX-1 and Reversa tissues tested, as expected, in the absence of LPS. However, COX-2 (72 kDa) expression in both COX-2>COX-1 and Reversa mice under basal conditions is detectable even without LPS stimulation. In LPS-stimulated tissues, endogenous COX-2 expression was significantly induced in the kidney and lung of WT mice. Ptgs1-driven COX-2 expression in Reversa mice was not induced by LPS; the level was more comparable with that of nonstimulated COX-2>COX-1 and Reversa tissues. On the other hand, Ptgs2-driven COX-1 expression in Reversa mice was weakly induced by LPS in the kidney and lung. Endogenous COX-1 expression in WT remained the same level, regardless of the presence of LPS. These data indicate that during systemic inflammation, native COX-2 is induced throughout the body in several tissues: resident macrophages, kidney, and lung.
Fig. 1.
COX expression in the kidney, stomach, and lung of Ptgs gene-exchanged mice. Western blot analysis of COX-1 and COX-2 expression in tissues of mice challenged either with LPS for 6 h or with an equivalent volume of PBS alone. Images are representative of two separate experiments.
COX exchange reveals differential compensation for prostanoid biosynthesis in macrophages
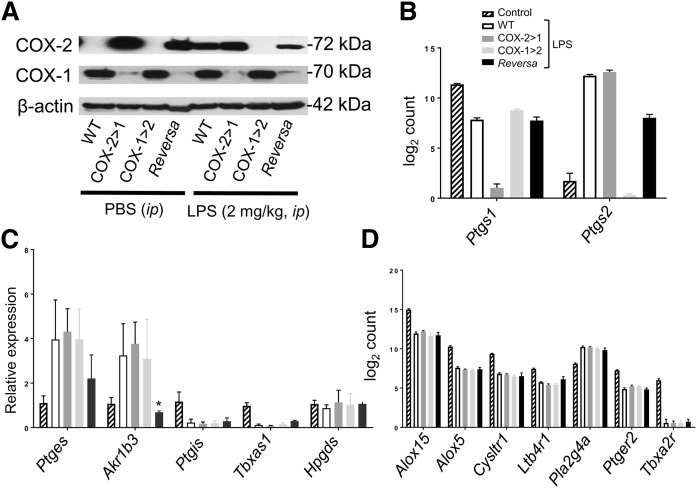
We used peritoneal macrophages to analyze relative COX-1 and COX-2 expression with or without LPS stimulation (Fig. 2A). COX protein expression patterns observed in macrophages from mice when challenged with LPS in vivo were similar to patterns in ex vivo isolated resident macrophages (26). In non-LPS-stimulated macrophages, expression of the COX-1 isoform was evident in WT and COX-1>COX-2 mice, but not in COX-2>COX-1 and Reversa mice. Moreover, Ptgs1-driven COX-2 was constitutively expressed in both COX-2>COX-1 and Reversa mice even without LPS stimulation. In LPS-stimulated macrophages, endogenous COX-2 expression was dramatically induced in WT mice, but not in the COX-1>COX-2 mice, where endogenous COX-2 was knocked out completely. Ptgs1-driven COX-2 expression in Reversa mice was not LPS-inducible; in contrast, Ptgs2-driven COX-1 expression in Reversa mice could be induced weakly by LPS.
Fig. 2.
Effects of Ptgs gene exchange on AA metabolism signaling pathways in macrophages from mice with systemic inflammation. A: Western blot analysis of COX isoforms in peritoneal macrophages harvested from mice either challenged in vivo with LPS (2 mg/kg, ip) or an equivalent volume of PBS for 6 h. Images are representative of two separate experiments. B: RNA counts from NanoString analysis of Ptgs1 and Ptgs2 expression in macrophages. Note that NanoString Ptgs1 probe (exon 11) and Ptgs2 probe (exon 5) can detect both native Ptgs and knock-in Ptgs. Data are presented as mean ± SEM, n = 6. C: Quantitative PCR for prostanoid synthases (mPGES-1, PGIS, AKR1B3, TBXAS1, and H-PGDS) in macrophages. Data are expressed as relative mRNA expression to 18S rRNA (mean ± SEM, n = 3). *P < 0.05 versus WT. D: RNA counts from NanoString analysis of Alox15, Alox5, Cysltr1, Ltb4r1, Pla2g4a, Ptger2, and Tbxa2r expression in macrophages. Data are presented as mean ± SEM, n = 6.
Using NanoString technology, we also demonstrated Ptgs gene exchange in peritoneal macrophages (Fig. 2B). Further quantitative (q)PCR analysis revealed the effects of gene exchange on the downstream eicosanoid-producing enzymes in an inflammatory context (Fig. 2C). Expression of two prostanoid synthases, microsomal PGE synthase-1 (mPGES-1) for PGE2 synthesis and aldo-keto reductase-1 B3 subtype (AKR1B3) for PGF2α synthesis, are enhanced, with decreased expression of PGI synthase (PGIS) and thromboxane (Tx)A synthase 1 (TBXAS1). Reversa mice showed relatively low expression of mPGES-1 and AKR1B3, which may also cause less PGE2 and PGF2α production. Hematopoietic PGD synthase (H-PGDS), a major enzyme for PGD2 synthesis in macrophages (36), is stably expressed in the presence or absence of LPS, in agreement with earlier studies (37). There is no distinguishable change in PGIS, TBXAS1, and H-PGDS resulting from Ptgs gene exchange. Another form of PGDS, lipocalin-type PGDS, mainly located in the brain (38), is barely detected in macrophages (data not shown).
Pla2g4a, encoding for type IV cytosolic phospholipase A2 (cPLA2), the key player for AA liberation and consequent eicosanoid production (39), is one of the upregulated genes upon LPS challenge and is not affected by Ptgs gene exchange (Fig. 2D). Interestingly, the expression of genes encoding enzymes/receptors in the leukotriene pathway (Alox15, Alox5, Cysltr1, and Ltb4r1) and prostanoid receptors (e.g., Ptger2 and Tbxa2r) are all negatively regulated in all four LPS-challenged groups of mice (Fig. 2D). This might help mitigate inflammatory reactions and restore systemic homeostasis. On the other hand, lowering of Alox15 and Alox5 expression may shunt AA metabolism toward the COX/PG pathway.
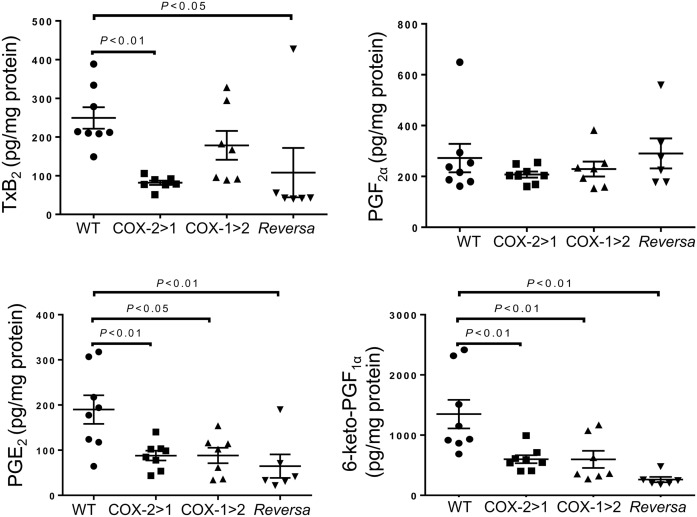
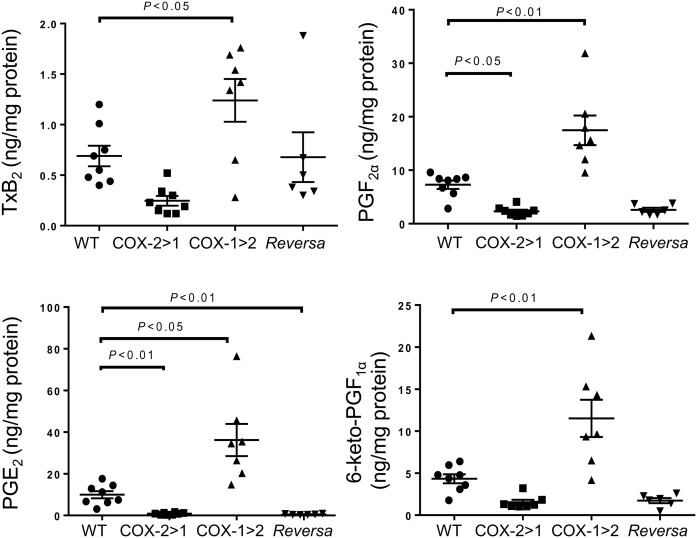
Prostanoid production, as detected in the peritoneal lavage, shows differential compensation across the three genotypes (Fig. 3). Elevated levels of TxB2 were observed in samples from WT and COX-1>COX-2 mice. Due to a lack of constitutive endogenous COX-1 function, COX-2>COX-1 and Reversa mice produce much less Tx. PGF2α production from all three types of macrophages was comparable with that from WT mice. However, PGE2 and 6-keto-PGF1α production from COX-2>COX-1, COX-1>COX-2, and Reversa mice was significantly less than that of WT counterparts, indicating that both COX-2 and COX-1 contribute to PGE2 and 6-keto-PGF1α production in these cells and that the exchanged genes may not be functioning sufficiently during systemic inflammation.
Fig. 3.
Prostanoid profiles in peritoneal lavage from mice challenged with LPS in vivo. Peritoneal lavage was harvested after 6 h of LPS peritoneal administration, and then subjected to LC-MS/MS assays. Data are presented as mean ± SEM, n = 6–8.
Flipping COX isoforms identifies differential interchangeability for prostanoid production
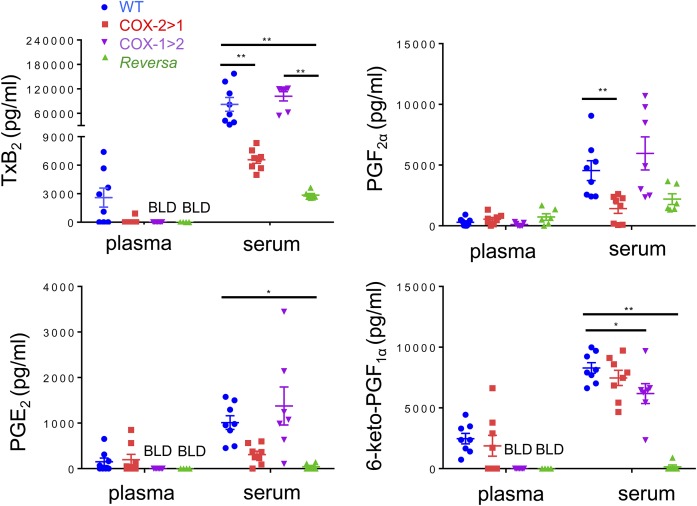
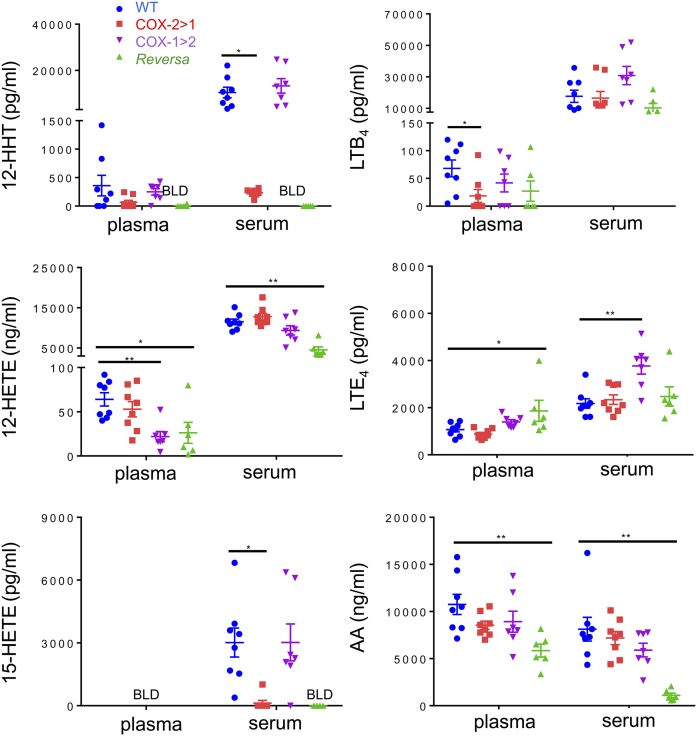
Eicosanoids in plasma, serum, and urine were profiled to reveal the effect of flipping the two COX isoforms on potential interchangeability between the two COX isoforms to produce downstream prostanoids. Levels of TxB2, PGF2α, PGE2, and 6-keto-PGF1α in plasma were very low (at detection limits or below the limit of detection). When challenged with LPS intraperitoneally for 6 h, WT mice produced and released more PGs, especially after platelet activation and blood coagulation (serum samples). PG levels of COX-1>COX-2 mice are comparable with those of WT mice. However, this PG profile was not observed in COX-2>COX-1 and Reversa mice. There was one exception, COX-2>COX-1 mice could efficiently catalyze prostacyclin synthesis (measured as 6-keto-PGF1α in serum; Fig. 4).
Fig. 4.
Prostanoid profiles in mice challenged with LPS in vivo. Serum or plasma were obtained after 6 h of LPS peritoneal administration, and then subjected to LC-MS/MS assays. BLD, below the limit of detection. Data are presented as mean ± SEM, n = 6–8. *P < 0.05 and **P < 0.01.
Additional analysis of AA-associated metabolites revealed that the capacity of COX-2>COX-1 and Reversa mice to make 12-HHT (a Tx pathway byproduct) and 15-HETE (a COX pathway byproduct, especially in mice where there are no specific 15-lipoxygenase enzymes) (40) was also nearly abolished, whereas leukotriene pathways appeared to function properly in all four genotypes (Fig. 5). Surprisingly, AA levels in Reversa mice were significantly lower than the other three strains of mice, whether measured in plasma or serum. These alterations in AA supply through endogenous routes appear to significantly affect the coupling between COXs and terminal PG synthases (41). This may, to some extent, account for the severely impaired capacity to generate PGs tested in the Reversa mice where both COXs are substituted.
Fig. 5.
AA and downstream eicosanoid profiles of mice challenged with LPS in vivo. Serum or plasma were obtained after 6 h of LPS peritoneal administration, and then subjected to LC-MS/MS assays. BLD, below the limit of detection. Data are presented as mean ± SEM, n = 6–8. *P < 0.05 and **P < 0.01.
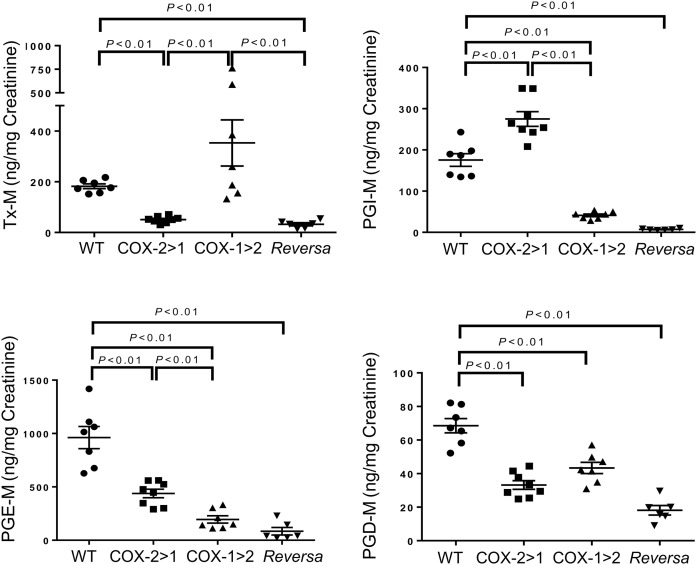
We examined the urinary PG profile to determine differential alterations in the three strains of mice with systemic LPS challenge (Fig. 6). As expected, the Tx-M metabolite in COX-1>COX-2 mice was remarkably higher than the other three strains of mice, resulting from native COX-1 and “induced” COX-1. In contrast, Tx-M metabolite from COX-2>COX-1 and Reversa mice was decreased substantially relative to WT and COX-1>COX-2 mice. COX-2>COX-1 mice produced the most PGI-M derived from either inducible COX-2 or “constitutive” COX-2, compared with the other three groups. In addition to the serum PG profile, these findings agree with the concept that PGI2 biosynthesis initiates preferentially from COX-2 (33, 42, 43) and TxA2 biosynthesis relies on COX-1 (10, 44). Both isoforms contribute to PGE2 and PGD2 biosynthesis in an inflammatory setting.
Fig. 6.
Total urinary prostanoid biosynthesis in mice. Urinary prostanoid metabolites were measured in urine samples collected over 3 h from mice challenged with LPS intraperitoneally. Data are presented as mean ± SEM, n = 6–11.
Medullar COX-1 makes irreplaceable contributions to renal PG synthesis
During endotoxin-induced inflammatory responses, damage to kidneys and lungs often contributes to the associated morbidity and mortality. PG synthesis in renal medullary homogenates is quite distinct from estimation of systemic PG biosynthesis (45). Our data show that the medullar capacity to synthesize PGs is primarily dependent on COX-1, either in the presence or absence of native COX-2 (Fig. 7). Disruption of native COX-1 in either COX-2>COX-1 or Reversa mice led to the suppressed capacity to produce all detected PGs. Unlike the AA levels in blood, as mentioned above, medullar endogenous AA released at the same level across all four strains of mice. Each group had a similar ability to synthesize HETEs and LTB4 (supplemental Fig. S1).
Fig. 7.
Prostanoid profiles in the renal medulla. Dissected inner renal medulla was homogenized and then subjected to LC-MS/MS assays. Data are presented as mean ± SEM, n = 6–8.
Differential inflammatory signaling pathway of COX isoforms
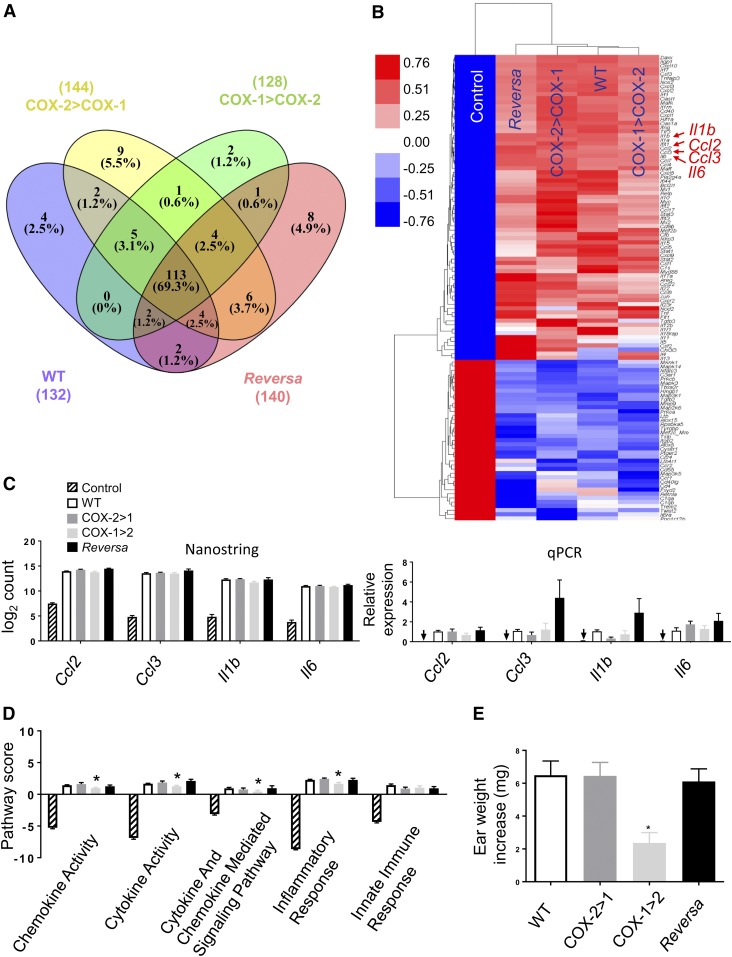
To directly address the role of the two COX isoforms in host responses to bacterial endotoxemia, we assessed the impact of Ptgs gene exchange on the systemically induced inflammatory response triggered by E. coli-derived LPS. Using NanoString technology and a group of 248 classic inflammatory genes, Venn diagram analysis showed 113 of them (69%) changed more than 2-fold in all four genotype groups (Fig. 8A, supplemental Table S2) in response to systemic LPS challenge. LPS may trigger negative feedback mechanisms to protect the host from excessive inflammatory damage (46). Seventy-four genes involved in inflammation were upregulated and 39 genes downregulated upon LPS challenge. Hierarchical clustering analysis performed on the 113 LPS-induced transcripts showed similar overlapping gene expression patterns among the four genotypes of mice versus control mice (Fig. 8B). Four upregulated genes were further confirmed by NanoString analysis and quantitative RT-PCR (Fig. 8C). However, advanced inflammatory pathway analysis reveals that significant components of the inflammatory pathways in the peritoneal macrophages are influenced by the gene exchange. COX-1>COX-2 mice are predicted to respond less robustly to inflammatory challenges than the other three strains, with lower pathway scores in cytokine activity, cytokine- and chemokine-mediated signaling, and inflammatory responses (Fig. 8D). We further examined these pathways using other analyses (IPA) and obtained similar predictions (supplemental Fig. S2). To test this experimentally, ear inflammation was induced by topical application of AA. COX-1>COX-2 mice exhibited a significantly reduced inflammatory response to AA, measured as an increase in ear weight compared with WT littermates (P < 0.05) (Fig. 8E). Thus, loss of COX-2 in COX-1>COX-2 mice results in the reduced activation of inflammatory signaling pathways in inflamed peritoneal macrophages and ear tissue, consistent with previous findings in the brain (23, 25). Collectively, both COX isoforms may contribute to PG production during acute inflammation (5, 17, 47) and COX-2 is able to, at least in an inflammatory context, compensate for COX-1, but not vice versa.
Fig. 8.
Differential gene expression and inflammatory signaling pathway of COX isoforms in macrophages. Peritoneal macrophages were harvested from mice either challenged in vivo with LPS (2 mg/kg, ip) or an equivalent volume of PBS (Control) for 6 h. A: Venn diagram showing the number of differentially expressed (fold change >2 vs. Control) genes induced by LPS in WT (132), in COX-2>COX-1 (144), in COX-1>COX-2 (128), and in Reversa (140) mice. Of the 248 genes represented in the array, 113 (69%) changed more than 2-fold in all four LPS-challenged genotypes of mice. B: Heat map of the results of hierarchical clustering analysis for the 113 genes. Each row represents a transcript and the column represents grouped and normalized signals for different treatments and different genotypes of mice (n = 6). Red and blue represent up- and down-regulation, respectively. C: Comparison of NanoString count analysis and qPCR-determined relative expression for Ccl2, Ccl3, Il1b, and Il6. Arrows indicate near absence of gene expression in Control mice detected under these conditions. D: nSolver 3.0-generated pathway score analysis for cytokine, chemokine, and associated inflammatory responses. Data are presented as mean ± SEM, n = 6 except for the qPCR data, n = 4. *P < 0.05 versus WT. E: Evaluation of ear inflammatory responses. Data are expressed as ear weight increase of an 8 mm diameter biopsy after AA treatment (left ear) compared with vehicle treatment (right ear). *P < 0.05 versus WT (n = 8).
DISCUSSION
Since the discovery of a second isoform of COX (48–50), there has been considerable interest in the questions as to why there are two isoforms with identical activities and what distinct roles they might play during inflammation. We previously engineered three mouse lines (13, 26) where the Ptgs1 and Ptgs2 genes substitute for one another to discriminate the distinct roles and functional interchangeability of the two COX isoforms. Using a systemic inflammatory mouse model, our current study reveals differential capability of COX isoforms to compensate for each other in macrophage prostanoid synthesis. Also, new insights into the interchangeability between COX isoforms to generate prostanoids are provided. While PG biosynthesis in platelets and kidneys requires native COX-1, which cannot be compensated by the knock-in COX-2, the inflammatory networks can be differentially rescued by isoform substitution. COX-2 is able to compensate for COX-1 in this complex inflammatory context, but not vice versa, as shown in peritoneal macrophages.
Several previous studies used mice deficient in COX-1 or COX-2 to identify the distinct roles for the respective COX isoforms (9–11, 15) by topical application of an inflammation inducer (e.g., AA, tetradecanoyl phorbol acetate, or carrageenan). However, these models do not reflect the systemic inflammation commonly found in acute infectious disease (51) and represent a limitation for the interpretation of the unique roles for each COX isoform. Intraperitoneal administration of LPS activates Toll-like receptor 4 and initiates a cascade of inflammatory events characterized by the release of pro-inflammatory cytokines, chemokines, and eicosanoids (52). Our results confirm these findings. Most significantly, in the NanoString analysis, regulated expression is not changed due to the gene exchanges, but overall signaling pathways reveal that macrophages from COX-1>COX-2 mice respond less robustly to inflammatory challenges than the other three strains. PGE2, a major PG involved in inflammation and pain, can be maintained in serum by native COX-1, and production can be enhanced by “inducible” COX-1 in renal medulla. However, levels of PGE-M from peritoneally derived tissues and whole-body urinary production depend on both native COX isoforms; loss of either isoform resulting in severe systemic impairment of PGE2 production. These findings are consistent with a previous study in COX-1>COX-2 mice in which the mice showed a complete lack of fever and inflammation-induced anorexia, as well as an impaired response to inflammatory pain (25). Ear edema data further confirm that loss of COX-2 leads to weaker topical responses, without resulting in a compensatory increase in COX-1-dependent PG function. Similar results are also found in adipose tissues deficient in COX-2 (53) and in another systemic inflammatory study (22). These data indicate that the knock-in COX-2 driven by the Ptgs1 gene promoter can rescue the inflammatory response in peritoneal macrophages, but not vice versa.
The two COX isoforms demonstrate differential interchangeability to maintain the capacity of prostanoid synthesis in an inflammatory context. Gene array data demonstrate that upstream cytosolic phospholipase A2 (cPLA2), liberating AA from membranes (54), is significantly upregulated by LPS (54) and is metabolically and nonpreferentially coupled with both COX isoforms upon systemic inflammatory challenges. However, the lipidomic profile identifies preferential interchangeability between COX isoforms to produce terminal prostanoids. COX-1>COX-2 mice could synthesize comparable levels of Tx in all analytes tested, including peritoneal lavage, serum, urine, and renal medulla, indicating that COX-1 is the main source of this prostanoid, which cannot be compensated by COX-2. Our data show that ablation of the native COX-2 (COX-1>COX-2 and Reversa) causes severe impairment in prostacyclin biosynthesis, detected as urinary metabolite PGI-M, parallel to the serum 6-keto-PGF1α level in the inflammatory setting. Moreover, the remaining COX-1, even with the help of knock-in COX-1 in COX-1>COX-2 mice, is not able to compensate for COX-2 deficiency to generate prostacyclin. In an environment of systemic inflammation, Ptgs gene exchange has no significant impact on the upregulation of mPGES-1, and deficiency of either isoform (COX-1>COX-2 or COX-2>COX-1) decreases the systemic PGE2 biosynthesis detected in urine and peritoneal lavage. A similar profile can be found relating to PGD2 metabolism, suggesting that both COX isoforms generate PGE2 and PGD2 in a reciprocal manner.
Unpredicted findings of the current study included the disability of Reversa mice to make PGs and the relatively normal inflammatory responses in these mice. These mice appear healthy (data not shown), although we have not perturbed the phenotype other than by LPS administration. Unlike the two “precursor” lines of Reversa mice, COX-1>COX-2 and COX-2>COX-1 mice, which show changes in PG formation that might be expected (measured in peritoneal lavage, platelets, and urine; Fig. 3, Fig. 4, and Fig. 6, respectively), the Reversa mice barely make PGs. Elevated LPS-induced PG production in vitro was only observed for cells expressing endogenous COX-2, whereas PGE2 and 6-keto-PGF1α are practically undetectable in the cell culture medium from Reversa macrophages [Fig. 5 in (26)]. In the present study, when LPS was injected intraperitoneally, PG levels from Reversa mice in the peritoneal fluid (but not the cells) were also somewhat elevated (Fig. 3), possibly derived from other cell types in the peritoneal cavity. Additionally, the PG profile from peritoneal fluid is not as drastically altered compared with the urinary metabolites, where PGE-M and PGI-M are decreased nearly to the detection limits in Reversa mice (Fig. 6). Neither knock-in COX-1 nor COX-2 protein expression level fully mimics the native protein, which was similar to that found in the brain of COX-1>COX-2 mice in a previous study (25). If knock-in Ptgs2 is completely under endogenous Ptgs1 control, or vice versa, the knock-in COX expression should be equivalent to that of native COX. We have shown that knock-in mRNA transcripts are not always equal to the WT mRNA transcripts, varying in a tissue-specific context, as we discussed in a companion study (26). Another explanation is that an efficient coupling between the enzymes in the PG biosynthetic pathway can be dramatically affected by the amounts of available AA released in subcellular contexts (55–57). Surprisingly, AA levels measured in plasma or serum of Reversa mice were significantly lower than for the other three strains of mice. Perturbed arachidonate (AA) substrate availability may disturb the coupling between COXs and terminal PG synthases (41), consequently accounting for the severely impaired capacity to generate PGs in Reversa mice. Besides COX/PG pathway involvement in inflammatory responses, lipoxygenases/leukotrienes also coordinate the pro-inflammatory cascade (58). However, proper function of leukotriene pathways, as detected by LTB4 and LTE4 in serum, combined with fairly normal pro-/anti-inflammatory gene expression in Reversa mice yields a conundrum that will require further study.
In the present study, we have attempted to better understand the distinct roles of the two COX isoforms in host responses to bacterial endotoxemia by determining the effects of Ptgs gene exchange. While COX exchange did not alter the LPS-initiated expression of pro- and anti-inflammatory genes, it was predicted that loss of COX-2 in COX-1>COX-2 mice reduced signaling pathway scores in cytokine activity, cytokine- and chemokine-mediated signaling, and inflammatory responses and this was further strengthened by a marked reduction in an ear edema model. COX-2 is able, at least in an inflammatory context, to compensate for COX-1, but COX-1 cannot replace COX-2. In addition, analysis of eicosanoids reveals a differential interchangeability between these two isoforms in terms of PG production after Ptgs gene exchange in an inflammatory context. Results from our experiments provide several lines of evidence demonstrating that one isoform may compensate functionally for the other, but this is characterized in an isoform-specific fashion. Both isoforms function coordinately, but not fully interchangeably during a systemic inflammatory insult.
Supplementary Material
Acknowledgments
The authors thank Brooke Ring-Snetsinger, Queen’s University, for the technical assistance in NanoString analysis.
Footnotes
Abbreviations:
- AA
- arachidonic acid
- AKR1B3
- aldo-keto reductase-1 B3 subtype
- COX
- cyclooxygenase
- H-PGDS
- hematopoietic prostaglandin D synthase
- IL
- interleukin
- IPA
- Ingenuity Pathway Analysis
- LPS
- lipopolysaccharide
- mPGES-1
- microsomal prostaglandin E synthase-1
- PG
- prostaglandin
- PGDS
- prostaglandin D synthase
- PGIS
- prostaglandin I synthase
- TBXAS1
- thromboxane A synthase 1
- Tx
- thromboxane
This work was supported by National Heart, Lung, and Blood Institute Grant U54 HL117798. C.D.F. holds a Tier 1 Canada Research Chair in Molecular, Cellular, and Physiological Medicine. G.A.F. is the McNeil Professor of Translational Medicine and Therapeutics. The content is solely the responsibility of the authors and does not necessarily represent the official views of the National Institutes of Health.
The online version of this article (available at http://www.jlr.org) contains a supplement.
REFERENCES
- 1.Smith W. L., DeWitt D. L., and Garavito R. M.. 2000. Cyclooxygenases: structural, cellular, and molecular biology. Annu. Rev. Biochem. 69: 145–182. [DOI] [PubMed] [Google Scholar]
- 2.Simmons D. L., Botting R. M., and Hla T.. 2004. Cyclooxygenase isozymes: the biology of prostaglandin synthesis and inhibition. Pharmacol. Rev. 56: 387–437. [DOI] [PubMed] [Google Scholar]
- 3.Smith W. L., Urade Y., and Jakobsson P. J.. 2011. Enzymes of the cyclooxygenase pathways of prostanoid biosynthesis. Chem. Rev. 111: 5821–5865. [DOI] [PMC free article] [PubMed] [Google Scholar]
- 4.Vane J. R. 1971. Inhibition of prostaglandin synthesis as a mechanism of action for aspirin-like drugs. Nat. New Biol. 231: 232–235. [DOI] [PubMed] [Google Scholar]
- 5.Tilley S. L., Coffman T. M., and Koller B. H.. 2001. Mixed messages: modulation of inflammation and immune responses by prostaglandins and thromboxanes. J. Clin. Invest. 108: 15–23. [DOI] [PMC free article] [PubMed] [Google Scholar]
- 6.Smith W. L., and Langenbach R.. 2001. Why there are two cyclooxygenase isozymes. J. Clin. Invest. 107: 1491–1495. [DOI] [PMC free article] [PubMed] [Google Scholar]
- 7.Vane J. R., Bakhle Y. S., and Botting R. M.. 1998. Cyclooxygenases 1 and 2. Annu. Rev. Pharmacol. Toxicol. 38: 97–120. [DOI] [PubMed] [Google Scholar]
- 8.FitzGerald G. A., and Patrono C.. 2001. The coxibs, selective inhibitors of cyclooxygenase-2. N. Engl. J. Med. 345: 433–442. [DOI] [PubMed] [Google Scholar]
- 9.Choi S. H., Langenbach R., and Bosetti F.. 2008. Genetic deletion or pharmacological inhibition of cyclooxygenase-1 attenuate lipopolysaccharide-induced inflammatory response and brain injury. FASEB J. 22: 1491–1501. [DOI] [PMC free article] [PubMed] [Google Scholar]
- 10.Langenbach R., Morham S. G., Tiano H. F., Loftin C. D., Ghanayem B. I., Chulada P. C., Mahler J. F., Lee C. A., Goulding E. H., Kluckman K. D., et al. 1995. Prostaglandin synthase 1 gene disruption in mice reduces arachidonic acid-induced inflammation and indomethacin-induced gastric ulceration. Cell. 83: 483–492. [DOI] [PubMed] [Google Scholar]
- 11.Yu Y., Cheng Y., Fan J., Chen X. S., Klein-Szanto A., Fitzgerald G. A., and Funk C. D.. 2005. Differential impact of prostaglandin H synthase 1 knockdown on platelets and parturition. J. Clin. Invest. 115: 986–995. [DOI] [PMC free article] [PubMed] [Google Scholar]
- 12.Morham S. G., Langenbach R., Loftin C. D., Tiano H. F., Vouloumanos N., Jennette J. C., Mahler J. F., Kluckman K. D., Ledford A., Lee C. A., et al. 1995. Prostaglandin synthase 2 gene disruption causes severe renal pathology in the mouse. Cell. 83: 473–482. [DOI] [PubMed] [Google Scholar]
- 13.Yu Y., Fan J., Hui Y., Rouzer C. A., Marnett L. J., Klein-Szanto A. J., FitzGerald G. A., and Funk C. D.. 2007. Targeted cyclooxygenase gene (Ptgs) exchange reveals discriminant isoform functionality. J. Biol. Chem. 282: 1498–1506. [DOI] [PubMed] [Google Scholar]
- 14.Dinchuk J. E., Car B. D., Focht R. J., Johnston J. J., Jaffee B. D., Covington M. B., Contel N. R., Eng V. M., Collins R. J., Czerniak P. M., et al. 1995. Renal abnormalities and an altered inflammatory response in mice lacking cyclooxygenase II. Nature. 378: 406–409. [DOI] [PubMed] [Google Scholar]
- 15.Wallace J. L., Bak A., McKnight W., Asfaha S., Sharkey K. A., and MacNaughton W. K.. 1998. Cyclooxygenase 1 contributes to inflammatory responses in rats and mice: implications for gastrointestinal toxicity. Gastroenterology. 115: 101–109. [DOI] [PubMed] [Google Scholar]
- 16.Langenbach R., Loftin C. D., Lee C., and Tiano H.. 1999. Cyclooxygenase-deficient mice. A summary of their characteristics and susceptibilities to inflammation and carcinogenesis. Ann. N. Y. Acad. Sci. 889: 52–61. [DOI] [PubMed] [Google Scholar]
- 17.Loftin C. D., Tiano H. F., and Langenbach R.. 2002. Phenotypes of the COX-deficient mice indicate physiological and pathophysiological roles for COX-1 and COX-2. Prostaglandins Other Lipid Mediat. 68–69: 177–185. [DOI] [PubMed] [Google Scholar]
- 18.Levy B. D., Clish C. B., Schmidt B., Gronert K., and Serhan C. N.. 2001. Lipid mediator class switching during acute inflammation: signals in resolution. Nat. Immunol. 2: 612–619. [DOI] [PubMed] [Google Scholar]
- 19.Serhan C. N. 2014. Pro-resolving lipid mediators are leads for resolution physiology. Nature. 510: 92–101. [DOI] [PMC free article] [PubMed] [Google Scholar]
- 20.Skarke C., Alamuddin N., Lawson J. A., Li X., Ferguson J. F., Reilly M. P., and FitzGerald G. A.. 2015. Bioactive products formed in humans from fish oils. J. Lipid Res. 56: 1808–1820. [DOI] [PMC free article] [PubMed] [Google Scholar]
- 21.Reddy R. C., Chen G. H., Tateda K., Tsai W. C., Phare S. M., Mancuso P., Peters-Golden M., and Standiford T. J.. 2001. Selective inhibition of COX-2 improves early survival in murine endotoxemia but not in bacterial peritonitis. Am. J. Physiol. Lung Cell. Mol. Physiol. 281: L537–L543. [DOI] [PubMed] [Google Scholar]
- 22.Ejima K., Layne M. D., Carvajal I. M., Kritek P. A., Baron R. M., Chen Y. H., Vom Saal J., Levy B. D., Yet S. F., and Perrella M. A.. 2003. Cyclooxygenase-2-deficient mice are resistant to endotoxin-induced inflammation and death. FASEB J. 17: 1325–1327. [DOI] [PubMed] [Google Scholar]
- 23.Singh A. K., Zajdel J., Mirrasekhian E., Almoosawi N., Frisch I., Klawonn A. M., Jaarola M., Fritz M., and Engblom D.. 2017. Prostaglandin-mediated inhibition of serotonin signaling controls the affective component of inflammatory pain. J. Clin. Invest. 127: 1370–1374. [DOI] [PMC free article] [PubMed] [Google Scholar]
- 24.Islam A. B., Dave M., Amin S., Jensen R. V., and Amin A. R.. 2016. Genomic, lipidomic and metabolomic analysis of cyclooxygenase-null cells: eicosanoid storm, cross talk, and compensation by COX-1. Genomics Proteomics Bioinformatics. 14: 81–93. [DOI] [PMC free article] [PubMed] [Google Scholar]
- 25.Björk Wilhelms D., Mirrasekhian E., Zajdel J., Kumar Singh A., and Engblom D.. 2016. Cyclooxygenase isoform exchange blocks brain-mediated inflammatory symptoms. PLoS One. 11: e0166153. [DOI] [PMC free article] [PubMed] [Google Scholar]
- 26.Li X., Mazaleuskaya L. L., Yuan C., Ballantyne L. L., Meng H., Smith W. L., FitzGerald G. A., and Funk C. D.. 2018. Flipping the cyclooxygenase (Ptgs) genes reveals isoform-specific compensatory functions. J. Lipid Res. 59: 89–101. [DOI] [PMC free article] [PubMed] [Google Scholar]
- 27.Yang R., Miki K., Oksala N., Nakao A., Lindgren L., Killeen M. E., Mennander A., Fink M. P., and Tenhunen J.. 2009. Bile high-mobility group box 1 contributes to gut barrier dysfunction in experimental endotoxemia. Am. J. Physiol. Regul. Integr. Comp. Physiol. 297: R362–R369. [DOI] [PubMed] [Google Scholar]
- 28.Hanssen L., Alidousty C., Djudjaj S., Frye B. C., Rauen T., Boor P., Mertens P. R., van Roeyen C. R., Tacke F., Heymann F., et al. 2013. YB-1 is an early and central mediator of bacterial and sterile inflammation in vivo. J. Immunol. 191: 2604–2613. [DOI] [PubMed] [Google Scholar]
- 29.Aziz M., Jacob A., Matsuda A., Wu R., Zhou M., Dong W., Yang W. L., and Wang P.. 2011. Pre-treatment of recombinant mouse MFG-E8 downregulates LPS-induced TNF-alpha production in macrophages via STAT3-mediated SOCS3 activation. PLoS One. 6: e27685. [DOI] [PMC free article] [PubMed] [Google Scholar]
- 30.Barberà-Cremades M., Baroja-Mazo A., Gomez A. I., Machado F., Di Virgilio F., and Pelegrin P.. 2012. P2X7 receptor-stimulation causes fever via PGE2 and IL-1beta release. FASEB J. 26: 2951–2962. [DOI] [PubMed] [Google Scholar]
- 31.Seta F., Chung A. D., Turner P. V., Mewburn J. D., Yu Y., and Funk C. D.. 2009. Renal and cardiovascular characterization of COX-2 knockdown mice. Am. J. Physiol. Regul. Integr. Comp. Physiol. 296: R1751–R1760. [DOI] [PubMed] [Google Scholar]
- 32.Li X., Yu Y., and Funk C. D.. 2013. Cyclooxygenase-2 induction in macrophages is modulated by docosahexaenoic acid via interactions with free fatty acid receptor 4 (FFA4). FASEB J. 27: 4987–4997. [DOI] [PubMed] [Google Scholar]
- 33.Yu Y., Stubbe J., Ibrahim S., Song W. L., Smyth E. M., Funk C. D., and FitzGerald G. A.. 2010. Cyclooxygenase-2-dependent prostacyclin formation and blood pressure homeostasis: targeted exchange of cyclooxygenase isoforms in mice. Circ. Res. 106: 337–345. [Erratum. 2010. Circ. Res. 107: e19.] [DOI] [PMC free article] [PubMed] [Google Scholar]
- 34.Peloquin J. M., Goel G., Kong L., Huang H., Haritunians T., Sartor R. B., Daly M. J., Newberry R. D., McGovern D. P., Yajnik V., et al. 2016. Characterization of candidate genes in inflammatory bowel disease-associated risk loci. JCI Insight. 1: e87899. [DOI] [PMC free article] [PubMed] [Google Scholar]
- 35.Quinn M. A., and Cidlowski J. A.. 2016. Endogenous hepatic glucocorticoid receptor signaling coordinates sex-biased inflammatory gene expression. FASEB J. 30: 971–982. [DOI] [PMC free article] [PubMed] [Google Scholar]
- 36.Gandhi U. H., Kaushal N., Ravindra K. C., Hegde S., Nelson S. M., Narayan V., Vunta H., Paulson R. F., and Prabhu K. S.. 2011. Selenoprotein-dependent up-regulation of hematopoietic prostaglandin D2 synthase in macrophages is mediated through the activation of peroxisome proliferator-activated receptor (PPAR) gamma. J. Biol. Chem. 286: 27471–27482. [DOI] [PMC free article] [PubMed] [Google Scholar]
- 37.Xiao L., Ornatowska M., Zhao G., Cao H., Yu R., Deng J., Li Y., Zhao Q., Sadikot R. T., and Christman J. W.. 2012. Lipopolysaccharide-induced expression of microsomal prostaglandin E synthase-1 mediates late-phase PGE2 production in bone marrow derived macrophages. PLoS One. 7: e50244. [DOI] [PMC free article] [PubMed] [Google Scholar]
- 38.Urade Y., Kitahama K., Ohishi H., Kaneko T., Mizuno N., and Hayaishi O.. 1993. Dominant expression of mRNA for prostaglandin D synthase in leptomeninges, choroid plexus, and oligodendrocytes of the adult rat brain. Proc. Natl. Acad. Sci. USA. 90: 9070–9074. [DOI] [PMC free article] [PubMed] [Google Scholar]
- 39.Evans J. H., Spencer D. M., Zweifach A., and Leslie C. C.. 2001. Intracellular calcium signals regulating cytosolic phospholipase A2 translocation to internal membranes. J. Biol. Chem. 276: 30150–30160. [DOI] [PubMed] [Google Scholar]
- 40.Rauzi F., Kirkby N. S., Edin M. L., Whiteford J., Zeldin D. C., Mitchell J. A., and Warner T. D.. 2016. Aspirin inhibits the production of proangiogenic 15(S)-HETE by platelet cyclooxygenase-1. FASEB J. 30: 4256–4266. [DOI] [PMC free article] [PubMed] [Google Scholar]
- 41.Ueno N., Murakami M., Tanioka T., Fujimori K., Tanabe T., Urade Y., and Kudo I.. 2001. Coupling between cyclooxygenase, terminal prostanoid synthase, and phospholipase A2. J. Biol. Chem. 276: 34918–34927. [DOI] [PubMed] [Google Scholar]
- 42.McAdam B. F., Catella-Lawson F., Mardini I. A., Kapoor S., Lawson J. A., and FitzGerald G. A.. 1999. Systemic biosynthesis of prostacyclin by cyclooxygenase (COX)-2: the human pharmacology of a selective inhibitor of COX-2. Proc. Natl. Acad. Sci. USA. 96: 272–277. [DOI] [PMC free article] [PubMed] [Google Scholar]
- 43.Yu Y., Ricciotti E., Scalia R., Tang S. Y., Grant G., Yu Z., Landesberg G., Crichton I., Wu W., Pure E., et al. 2012. Vascular COX-2 modulates blood pressure and thrombosis in mice. Sci. Transl. Med. 4: 132ra54. [DOI] [PMC free article] [PubMed] [Google Scholar]
- 44.Patrignani P., Sciulli M. G., Manarini S., Santini G., Cerletti C., and Evangelista V.. 1999. COX-2 is not involved in thromboxane biosynthesis by activated human platelets. J. Physiol. Pharmacol. 50: 661–667. [PubMed] [Google Scholar]
- 45.FitzGerald G. A., Pedersen A. K., and Patrono C.. 1983. Analysis of prostacyclin and thromboxane biosynthesis in cardiovascular disease. Circulation. 67: 1174–1177. [DOI] [PubMed] [Google Scholar]
- 46.Lee M. S., Kim B., Lee S. M., Cho W. C., Lee W. B., Kang J. S., Choi U. Y., Lyu J., and Kim Y. J.. 2013. Genome-wide profiling of in vivo LPS-responsive genes in splenic myeloid cells. Mol. Cells. 35: 498–513. [DOI] [PMC free article] [PubMed] [Google Scholar]
- 47.Langenbach R., Loftin C., Lee C., and Tiano H.. 1999. Cyclooxygenase knockout mice: models for elucidating isoform-specific functions. Biochem. Pharmacol. 58: 1237–1246. [DOI] [PubMed] [Google Scholar]
- 48.Xie W. L., Chipman J. G., Robertson D. L., Erikson R. L., and Simmons D. L.. 1991. Expression of a mitogen-responsive gene encoding prostaglandin synthase is regulated by mRNA splicing. Proc. Natl. Acad. Sci. USA. 88: 2692–2696. [DOI] [PMC free article] [PubMed] [Google Scholar]
- 49.Kujubu D. A., and Herschman H. R.. 1992. Dexamethasone inhibits mitogen induction of the TIS10 prostaglandin synthase/cyclooxygenase gene. J. Biol. Chem. 267: 7991–7994. [PubMed] [Google Scholar]
- 50.O’Banion M. K., Winn V. D., and Young D. A.. 1992. cDNA cloning and functional activity of a glucocorticoid-regulated inflammatory cyclooxygenase. Proc. Natl. Acad. Sci. USA. 89: 4888–4892. [DOI] [PMC free article] [PubMed] [Google Scholar]
- 51.Saper C. B., Romanovsky A. A., and Scammell T. E.. 2012. Neural circuitry engaged by prostaglandins during the sickness syndrome. Nat. Neurosci. 15: 1088–1095. [DOI] [PMC free article] [PubMed] [Google Scholar]
- 52.Bode J. G., Ehlting C., and Haussinger D.. 2012. The macrophage response towards LPS and its control through the p38(MAPK)-STAT3 axis. Cell. Signal. 24: 1185–1194. [DOI] [PubMed] [Google Scholar]
- 53.Ghoshal S., Trivedi D. B., Graf G. A., and Loftin C. D.. 2011. Cyclooxygenase-2 deficiency attenuates adipose tissue differentiation and inflammation in mice. J. Biol. Chem. 286: 889–898. [DOI] [PMC free article] [PubMed] [Google Scholar]
- 54.Clark J. D., Schievella A. R., Nalefski E. A., and Lin L. L.. 1995. Cytosolic phospholipase A2. J. Lipid Mediat. Cell Signal. 12: 83–117. [DOI] [PubMed] [Google Scholar]
- 55.Swinney D. C., Mak A. Y., Barnett J., and Ramesha C. S.. 1997. Differential allosteric regulation of prostaglandin H synthase 1 and 2 by arachidonic acid. J. Biol. Chem. 272: 12393–12398. [DOI] [PubMed] [Google Scholar]
- 56.Shitashige M., Morita I., and Murota S.. 1998. Different substrate utilization between prostaglandin endoperoxide H synthase-1 and -2 in NIH3T3 fibroblasts. Biochim. Biophys. Acta. 1389: 57–66. [DOI] [PubMed] [Google Scholar]
- 57.Chen W., Pawelek T. R., and Kulmacz R. J.. 1999. Hydroperoxide dependence and cooperative cyclooxygenase kinetics in prostaglandin H synthase-1 and -2. J. Biol. Chem. 274: 20301–20306. [DOI] [PubMed] [Google Scholar]
- 58.Funk C. D. 2001. Prostaglandins and leukotrienes: advances in eicosanoid biology. Science. 294: 1871–1875. [DOI] [PubMed] [Google Scholar]
Associated Data
This section collects any data citations, data availability statements, or supplementary materials included in this article.


