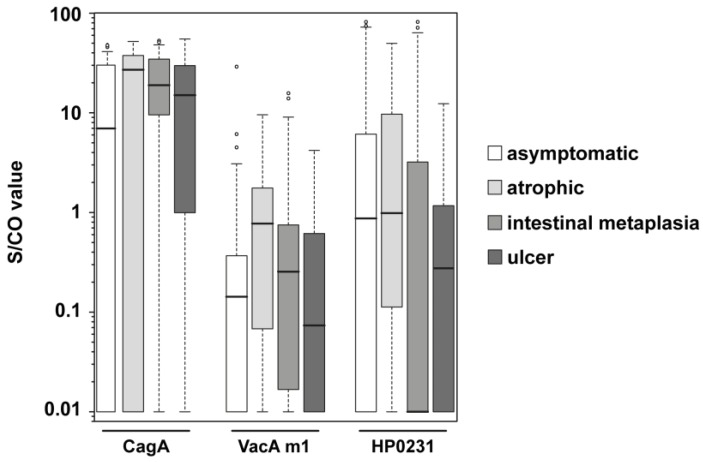
Figure 3.
Boxplots of S/CO values of CagA, VacA m1 and HP0231 in different subgroups of HP positive samples. Every box represents the interquartile range and the horizontal line inside the box is the median. Whiskers show the 5th and the 95th percentiles. Outliers are plotted as circles. S/CO values of IgG responses towards CagA, VacA m1, and HP0231 are shown for H. pylori positive asymptomatic samples (n = 66; white boxes), H. pylori positive atrophic samples (n = 18; light gray boxes), H. pylori positive intestinal metaplasia samples (n = 41; gray boxes) and H. pylori positive ulcer samples (n = 14; dark gray boxes).

