Abstract
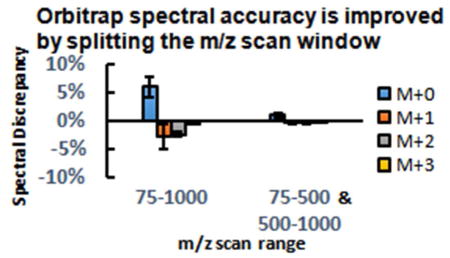
Orbitraps are high-resolution ion-trap mass spectrometers that are widely used in metabolomics. While the mass accuracy and resolving power of orbitraps have been extensively documented, their spectral accuracy—i.e. accuracy in measuring the abundances of isotopic peaks—remains less studied. In analyzing spectra of unlabeled metabolites, we discovered a systematic under representation of heavier natural isotopic species, especially for high molecular weight metabolites (~20% underestimation of [M+1]/[M+0] ratio at m/z 600). We hypothesize that these discrepancies arise for metabolites far from lower limit of the mass scan range, due to the weaker containment in the C-trap that results in suboptimal trajectories inside the Orbitrap analyzer. Consistent with this, spectral fidelity was restored by dividing the mass scan range (initially 75 m/z to 1000 m/z) into two scan events, one for lower molecular weight and the other for higher molecular weight metabolites. Having thus obtained accurate mass spectra at high resolution, we found that natural isotope correction for high-resolution labeling data requires more sophisticated algorithms than typically employed: the correction algorithm must take into account whether isotopologues with the same nominal mass are resolved. We present an algorithm and associated open-source code, named AccuCor, for this purpose. Together, these improvements in instrument parameters and natural isotope correction enable more accurate measurement of metabolite labeling and thus metabolic flux.
Graphical Abstract
INTRODUCTION
High-resolution mass spectrometry, when coupled to chromatographic separation, allows simultaneous identification and quantification of many metabolites. Together with the use of stable isotope tracers, it can provide quantitative information on metabolic activity.1–3 For this purpose, the fractional labeling of metabolites must be measured accurately. Accurate measurement of fractional abundance of an analyte’s different isotopologues is referred to as spectral accuracy.
Isotopologues can arise both due to incorporation of isotope-labeled nutrients and due to natural isotope abundances. The most common natural isotope in biological molecules is 13C at 1.07%. Other isotope atoms are rarer but can nevertheless have a significant impact. 18O abundance is 0.2%. For the primary cellular energy carrier ATP (C10H16N5O13P3), the natural abundance of 13C accounts for most of the M+1 peak, whereas 18O is the largest contributor to M+2.
Due to the presence of natural heavy isotopes, less labeled fractions may become heavier fractions, according to binomial probability. The measured mass fractions must be deconvoluted to get the isotope tracer labeling fractions, a process known as isotope natural abundance correction (INAC). This has become a routine step in tracer studies and there are a number of software tools available for this purpose.4–6 These tools assume unit mass resolution. In high resolution instruments, however, sometimes peaks at the same nominal mass can be separated, even though they contain the same number of protons and neutrons. For example, 13C and 15N give rise to M+1 peaks whose masses differ by 0.006 m/z. Whether peaks of the same nominal mass but different exact mass can be separated depends on the mass difference between the species, the resolving power of the mass spectrometer (M/ΔM), and the mass of the metabolite, where a small difference in mass is easier to resolve for lower molecular weight species. The existing tools for correcting high resolution data unrealistically assume infinite resolution7.
One commonly used high resolution mass spectrometer is the orbitrap, an ion trap mass analyzer based on Fourier deconvolution of electric field-induced metabolite oscillations along the axis of a spindle-shaped electrode. Orbitraps are more economical and sensitive than magnetic field-based instruments, while offering higher mass resolving power than time-of-flight instruments.8–10 This combination of attributes is well-suited for metabolomics9, 11. The mass resolving power of orbitraps is often sufficient to separate different isotopic peaks of the same nominal mass, especially at low mass range.
Compared to mass resolving power and mass accuracy, the spectral accuracy of orbitrap has been less extensively studied. In proteomics, the potential for systematic error in spectral patterns due to trap overfilling (space-charge effect) was recently reported. These errors were rectified by reducing trap loading by decreasing the instrument’s automatic gain control (AGC) setting.12 Here we identified a different source of spectral error that substantially impacts metabolite labeling measurements, related to ion loss during the long scan time (~ 1 s) required for high-resolution measurements. This error can be minimized by lower resolution scans with shorter scan time or, without compromising resolving power, by limiting the width of the mass scan range. We then provide a natural isotope abundance correction algorithm that properly takes into account at the high but finite mass resolution of the orbitrap.
EXPERIMENTAL SECTION
Materials
HPLC-grade methanol (646377), ammonium sulfate, D-glucose and the cofactor NAD were purchased from Sigma-Aldrich (St. Louis, MO). Yeast nitrogen base was purchased from Fisher Scientific (Pittsburgh, PA). 15N-ammonium sulfate, (15NH4)2SO4, was from Cambridge Isotope Laboratories (Tewksbury, MA).
Preparation and extraction of 15N labeled metabolites
Yeast cells (FY4 strain) were grown in yeast nitrogen base (commercial preparation without ammonium sulfate) + 1% glucose + 0.5% ammonium sulfate that was partially 15N-labeled (14N:15N 80:20). Each sample was harvested from 4 mL of yeast cell culture when the OD600 reached 0.6. Cells were collected by fast filtration and the filter paper was immediately transferred to 1.3 mL extraction solvent (40:40:20 acetonitrile:methanol:water at −20°C). The filter paper was rinsed with the extraction solvent to dislodge the cells and then discarded. The extracted sample was transferred to a clean eppendorf tube and centrifuged at 16,000g for 10 min. The supernatant was then transferred to a clean tube.
LC-MS analysis
The LC–MS method involved hydrophilic interaction chromatography (HILIC) coupled with negative mode electrospray ionization to the Q Exactive PLUS hybrid quadrupole-orbitrap mass spectrometer (Thermo Scientific). The LC separation was performed on a XBridge BEH Amide column (150 mm × 2.1 mm, 2.5 μm particle size, Waters, Milford, MA) using a gradient of solvent A (95%:5% H2O:Acetonitrile with 20 mM Ammonium Bicarbonate), and solvent B (100% Acetonitrile). The gradient was 0 min, 85% B; 2 min, 85% B; 3 min, 80% B; 5 min, 80% B; 6 min, 75% B; 7 min, 75% B; 8 min, 70% B; 9 min, 70% B; 10 min, 50% B; 12 min, 50% B; 13 min, 25% B; 16 min, 25% B; 18 min, 0% B; 23 min, 0% B; 24 min, 85% B; 30 min, 85% B. The flow rate was 150 μl min−1. Injection volume was 5 μL and column temperature 25 °C. The MS scans were in negative ion mode with a resolution of 140,000 at m/z 200 unless specified otherwise. The automatic gain control (AGC) target was 5e5 unless specified otherwise. The maximum injection time was 30 ms. Scan range was 75–1000 unless specified otherwise.
Isotope natural abundance correction
Spectra simulation was done using Thermo Xcalibur Qual Browser, Isotope Distribution Calculator (Scientific Instrument Services, http://www.sisweb.com/mstools/isotope.htm) and ChemCalc13 (Ecole Polytechnique Federale de Lausanne). All gave consistent results within 0.1%. Metabolite features were extracted in MAVEN14, 15, with the labeled isotope specified and a mass accuracy window of 10 ppm. The natural isotope abundance correction code was written in R. The matrix inversion and solving was done using the non-negative least squares (NNLS) package to avoid negative fractions. The AccuCor code is freely available in three versions for 13C, 2H, and 15N labeling studies (https://github.com/XiaoyangSu/Isotope-Natural-Abundance-Correction).
RESULTS AND DISCUSSION
Impact of spectral accuracy on metabolic flux analysis
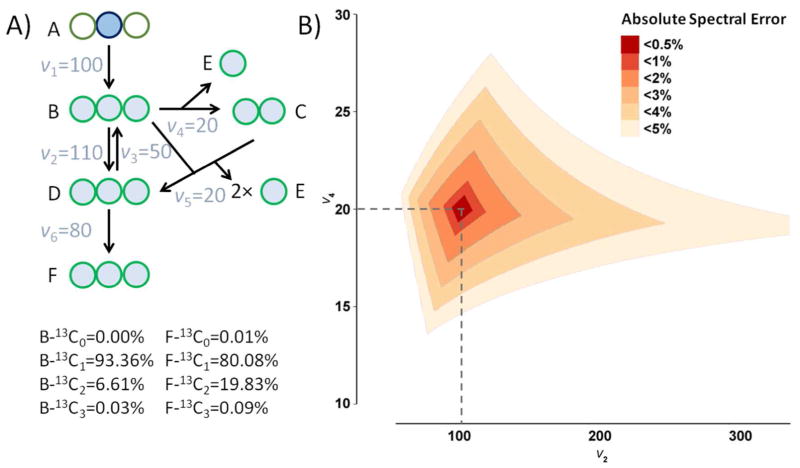
Isotope labeling patterns are the primary input for metabolic flux analysis. In an exemplary metabolic network (such as Fig. 1A), knowing the labeling of selected metabolites is sufficient, in the absence of error, to determine precisely all the steady-state fluxes16,17. The presence of random or systematic spectral measurement error leads to error in flux measurement, and possible false conclusions about flux. To give a sense of the spectral accuracy requirements for effective flux determination, Fig. 1B shows the feasible range of fluxes as a function of spectral mismeasurement. Both absolute and relative error in measuring isotopologues are of practical importance. Here, for simplicity, we focus on the absolute measurement error, as defined by the maximum absolute mismeasurement of any particular isotopic form:
Figure 1.
Impact of spectral accuracy on metabolic flux analysis. A) Simplified metabolic network (similar to glycolysis and pentose phosphate pathway) used to illustrate relationship between spectral accuracy and fluxes. The circles represent carbon atoms. A is 100% 2-13C labeled, which is colored in blue. B–F are partially labeled, which are colored in green. Given the fluxes v1–v6 in the network, the steady-state labeling patterns of B and F can be determined as shown below. These labeling patterns also uniquely determine v2–v6, relative to v1. B) The plot shows possible flux combinations given certain spectral error ranges. v2 and v6 are shown on the two axes, due to the fact that these are the two free fluxes in the network, which at steady state determine v3, v4, and v5 by flux balance. The dash lines show the true fluxes v2=110 and v4=20.
For absolute error up to 2%, fluxes can be fairly accurately determined (within ±20%; orange diamond region on Fig. 1B). Note that absolute spectral error of 2% corresponds to substantial relative error (± 10% in the critical M+2 form). On the other hand, as absolute spectral error increases towards 5%, the uncertainty in v2 increases dramatically, precluding accurate flux estimation. While the relationship between spectral error and flux error depends on the network and tracer, it is critical to avoid large systematic error in spectral measurements.
Spectral accuracy of metabolite measurements using orbitrap
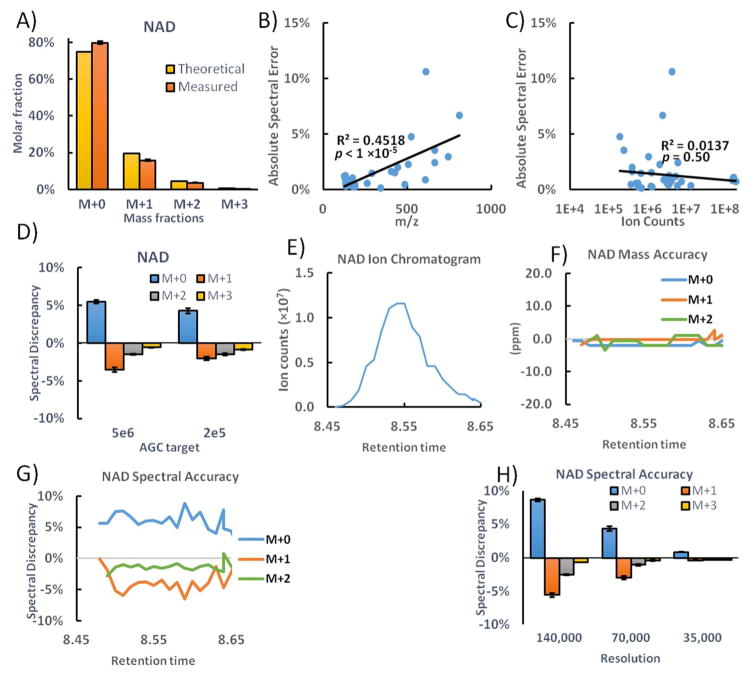
In evaluating our data obtained during routine metabolomics analyses, we were surprised to observe substantial systematic under-measurement of heavier isotopic forms. Exemplary data for the redox cofactor NAD is shown in Fig. 2A. Absolute spectral error is greatest for M+0, due to systematic under measurement of all heavier forms, with the relative error greatest for M+2 (−29%). For glutathione, which is about half the mass of NAD, we also observe systematic spectral error, albeit of substantially smaller magnitude. For serine, which is about 1/6 the mass of glutathione, no systematic spectral error is observed (Fig. S1). Overall, the extent of the systematic deviation roughly linearly correlated with metabolite mass (Fig. 2B, R2=0.4518, p<10−5) and was independent of signal intensity (Figure 2C, R2=0.0137, p=0.50). The lack of relationship between spectral error and signal intensity suggests that the error is not due exclusively to trouble measuring small isotopic peaks, nor exclusively due to excessive trap filling.
Figure 2.
Spectral accuracy of NAD. A) The measured mass distribution of unlabeled NAD is compared to the theoretical mass distribution due to isotope natural abundance. B) The correlation between absolute spectral error and metabolite m/z. C) The correlation between absolute spectral error and metabolite ion counts. D) The spectral discrepancies of NAD under two AGC target settings. E) The extracted ion chromatogram of NAD. F) The scan-by-scan mass accuracy of NAD. G) The scan-by-scan spectral discrepancy of NAD. H) The spectral accuracy of NAD under different resolution. The bars represent mean of n=4 and the error bars represent s.d.
Because space-charge effects resulting from trap overfilling have been shown to cause systematic spectral error in proteomics, we nevertheless further investigated this possibility. Too many ions in the trap cause mass peak shifting and broadening, a phenomenon called ion coalescence.8, 18 A simple way to avoid trap overfilling is to lower the automatic gain control (AGC) target setting. Reducing the AGC, while known to fix spectral error in proteomics, did not improve the spectral accuracy of metabolites including NAD (Figure 2D). The NAD measurements are free of ion coalescence, as the mass accuracy of M+0, M+1 and M+2 peaks are consistently within +/− 2ppm throughout the chromatographic peak (i.e. at low NAD abundance in the front and back of the peak and high abundance in the middle of the peak) (Figure 2E,F). The spectral accuracy, on the other hand, is poor regardless of the NAD abundance (Figure 2G). From the center to the tail of the NAD chromatogram peak, the ion counts decreased 10-fold, but the spectra shows the same systematic error throughout, suggesting NAD ion abundance is not the cause of under-measurement of the isotopic forms.
To further explore the origins of the under-measurement of metabolite isotopic forms, we tested the impact of changing the mass resolving power. Decreasing the resolving power increases the spectral accuracy (Figure 2H). The ion counts remained the same; thus, the improved spectral accuracy is not due to better signal-to-noise (Fig. S2). We also saw no evidence that the greater signal for isotopic peaks is due to the inclusion of unrelated ions (Fig. S3). In orbitraps, higher resolving power is achieved by increasing scan time (i.e. increasing the number of oscillations used to measure m/z). However, long scan time causes more significant dissipation of ion signal.19 We hypothesize that the scan time-dependent loss of signal (decay rate) is greater for lower abundance isotopologues than for the parent metabolite, resulting in substantial spectral errors. Another possible contributor to the systematic spectral error involves isotopic fine structure (e.g. in NAD, 13C1, 15N1, 2H1 and 17O1 are all nominal M+1 and cannot be adequately resolved at the resolution of 140,000). Ions of almost identical mass oscillate at very close frequencies, and accordingly deconstructive interference can cause apparent loss of intensity selectively in the isotopic peaks.20, 21. With shorter scan time and less oscillation in the trap, the phase difference is smaller and hence the deconstructive interference is reduced. Bottom line, longer high-resolution scans contribute to the systematic spectral error.
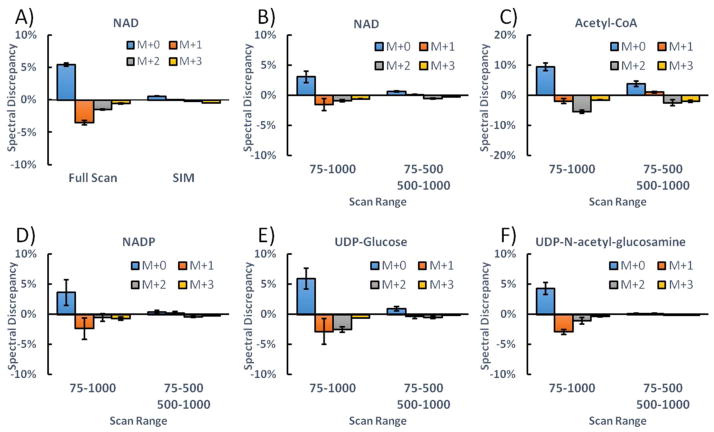
Even though spectral accuracy is rescued by decreasing resolution, this is hardly an ideal solution, as high resolution is valuable for metabolite identification. Therefore, we sought an alternative approach to improve spectral accuracy. When a wide m/z scan window is used (e.g., scanning from m/z 75 to 1000), the C-trap will less effectively constrain ions with high molecular weight, i.e. with m/z far above the lower end of the mass scan range. Weaker containment in the C-trap results in suboptimal trajectories inside the orbitrap analyzer, which contributes to scan time-dependent loss of signal. By resulting in more optimal ion trajectories in the orbitrap, a narrower scan range may improve spectral accuracy. In addition, it has been reported that the Fourier transform digitization window width also affects spectral accuracy.22 Accordingly, we tested scanning over a narrower mass range, using a SIM scan from m/z 660 to 670 for NAD. This eliminated the systematic spectral error even at high resolution (Fig. 3A). For metabolites with low molecular weight, both full scan and SIM scans give equally good spectral accuracy (Fig. S4). However, scans with narrow range would limit the number of metabolites that could be measured (and disadvantageously requires pre-programming for ions of interest). Accordingly we tested separating the m/z range into two scan events, m/z 75–500 and m/z 500–1000. This approach also markedly improved spectral accuracy (Figure 3B–F). The poor spectral accuracy under full scan and the improvement using two scan events has been confirmed on another Q Exactive PLUS at Thermo Fisher Scientific Demo Lab (Somerset, NJ). Smaller scan window also increased ion counts (Fig. S5), but M+1 peaks showed indistinguishable shape and no evidence of inclusion of unrelated ions (Fig. S6). Among the examined metabolites, acetyl-CoA showed the least improvement with this method, likely due to its having the highest mass (m/z 808), substantially above the bottom end of the m/z 500 – 1000 scan range. While split scans provide a pragmatic approach to obtaining improved spectral accuracy, it is hopeful that advanced Fourier transform algorithms in the future allow superior spectral accuracy, even in broad mass range scans.23, 24
Figure 3.
Mass scan window affects spectral accuracy. A) The spectral discrepancy of NAD using full scan (m/z 75–1000) and SIM (m/z 660–670). B–F) The spectral discrepancy of different metabolites under full scan and split scan windows. The bars represent mean of n=4; error bars represent s.d.
Isotopic natural abundance correction for high-resolution data
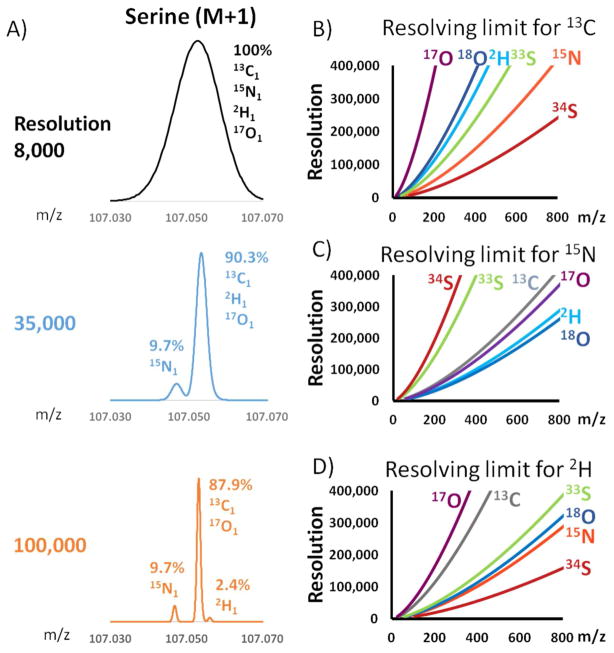
Accurate determination of metabolite labeling requires not only spectral accuracy, but also properly correcting the contribution from natural isotope abundance. In the case of low resolution data, the correction should account for all natural isotopes that produce the relevant nominal mass (e.g. 13C1, 15N1, 2H1, 17O1 all yield M+1). At higher resolution, however, some of these peaks may separate. For example, as shown for serine (Fig. 4A, M+1 m/z 107 in positive ion mode), at 35,000 resolution the 15N-peak is distinct from 13C-peak. At 100,000, the 2H peak also separates but 17O still does not. One way of doing correction is to sum up all M+1 peaks and use standard correction for low resolution data (such as IsoCor). But a benefit of high resolution MS is that contaminant ions can be resolved and excluded, and the ions of interest can be more directly and specifically measured. Therefore a better way to correct high-resolution data is to use only directly relevant measurements of the labeled ions of interest and any non-resolvable isotopologues.
Figure 4.
High resolution results in isotopologue separation. A) The mass spectra of serine M+1 at different mass spectrometer resolving power. The relative intensity of each peak is labeled on the spectra. B) The minimal nominal resolution is plotted for each isotope for 13C labeled compounds. C) The minimal nominal resolution is plotted for each isotope for 15N labeled compounds. D) The minimal nominal resolution is plotted for each isotope for 2H labeled compounds.
Based on the instrument resolution and the metabolite mass, we can calculate whether isotopic peaks will separate. While resolution is classically described as a fixed value of M/ΔM (the “nominal resolution”, defined as full width at half maximum at m/z 200 for orbitrap), actual orbitrap resolution diminishes as the square root of m/z (represented by m in the formula) 9, 10, 25.
| (1) |
In order for the isotopic peaks to be well separated, the mass difference should be greater than 1.66 times full width at half maximum (FWHM):
| (2) |
Therefore the minimum nominal resolution requirement for isotopic peak separation is
| (3) |
For 13C labeled metabolite, the mass differences between isotopologues are 13C1-15N1 0.00631, 13C1-2H1 0.00292 and 13C1-17O1 0.00087. For 13C1 labeled serine (m/z 107), the minimum nominal resolution is 20,600 for 15N1, 44,500 for 2H1 and 149,000 for 17O1. The experimental data in Figure 4A match this calculation in terms of the isotopic forms that separate. When the molecule gets heavier, the required nominal resolution to achieve isotope separation increases (Figure 4B). As a result, a resolution of 140,000 is high enough for resolving 13C1-15N1 on serine, but not on NAD+ (m/z 665). If the metabolite is labeled with 15N or 2H instead of 13C, the minimum nominal resolution requirement can be calculated similarly, and the result is plotted in Figure 4C–D.
To develop an isotope correction algorithm incorporating the above principle, we started with the IsoCor algorithm.5 To illustrate the approach, consider correcting for natural isotope abundances that impact 13C-labeling into serine. The measured mass fractions (M+0, M+1, etc.) are related to the labeling fractions (13C0, 13C1, etc.) by the isotopic correction matrix, as shown in Eq 4. The labeling pattern is solved by taking the inverse of the isotopic correction matrix (Eq 5). In a 13C labeling experiment, the isotopic correction matrix is composed of matrices corresponding to the labeled element (carbon) and non-labeled elements (hydrogen, nitrogen, oxygen etc.). To account for the isotopic impurity in the tracer, a purity matrix should also be included in the correction (Eq 6).
| (4) |
| (5) |
| (6) |
If serine is measured at 8,000 resolution, no isotopologue is resolved and the isotopic correction matrices should include all isotope combinations. The correction matrices are shown in Table 1. In the carbon matrix, represents the probability of having 0 13C atom out of 3 natural carbon atoms, i.e. (1-0.0107)3. For oxygen that has stable isotope of 16O/17O/18O, represents the probability of having 1 17O and 0 18O atom out of 3 natural oxygen atoms, i.e. 3*(0.0004)*(0.9986)2. The matrix for the nutrient being introduced as a label (in this case carbon) is distinct in having descending numbers of natural atoms from the left column to the right. The purity correction matrix accounts for the fact that the introduced labeled nutrient is not 100% isotopically pure. For the U-13C-label glucose that is 99% in 13C atom purity, PIP=1-0.99=0.01 is used in the purity correction matrix. represents the probability of having 0 12C atom out of 3 carbon atoms from the tracer, i.e. (1-0.01)3.
Table 1.
Example correction matrices for 13C-labeling of serine (C3H7N03).
| Resolution | 8,000 | 100,000 | ||
|---|---|---|---|---|
|
| ||||
| Carbon Matrix |
|
|
||
| Nitrogen Matrix |
|
|
||
| Hydrogen Matrix |
|
|
||
| Oxygen Matrix |
|
|
||
| Purity Matrix |
|
|
||
With a resolution of 100,000, only 13C and 17O1 should be corrected for serine. The new correction matrices are in the right column in Table 1. The carbon and purity matrices remain the same. In general, correction matrices should only be populated with the isotopologues that are not mass resolved from the labeled isotopologues. Because the correction matrices are not expecting resolved isotopologues, these peaks should not be included in the input data for correction. In this manner, interference from contaminants with close mass can be avoided. While these peaks are not included in the input data for correction, the correction algorithm nevertheless automatically accounts for their signal: the inverse correction matrices augment the signal of less labeled forms to account for their under-measurement due to natural abundance of resolved isotopes. For example, at 100,000 resolution in Table 1, the nitrogen correction matrix consists solely of diagonal elements which, upon matrix inversion, serve to correct for loss of signal due its appearing as a 15N1 peak, even though the 15N1 peaks are themselves omitted from the input data for correction.
Computer code for isotopic natural abundance correction of high-resolution data
Our correction algorithm, which we call AccurCor, is implemented in R and freely available. Sample inputs including a metabolite list are provided with the code. Molecular formula information is required to determine the correction matrices. AccuCor reads each metabolite in the input file, calculates the correction matrices using the formula and resolution information, and returns the corrected labeling pattern. AccuCor allows the user to specify the resolution used in the experiment. When low resolution is used, AccuCor behaves the same as IsoCor. Therefore AccuCor is applicable to all instrument platforms. If using MAVEN14, 15 for LC-MS metabolite feature extraction, the output format is directly compatible with AccuCor. In practice, it is efficient to use same metabolite list for MAVEN and AccuCor, so that all measured compounds will automatically be isotope corrected.
We provide three different versions of AccuCor for 13C, 15N and 2H tracer experiments respectively. While the concepts are the same for each version, they differ in a few respects. First, similar to the carbon matrix when using 13C, the matrix of the labeling element should have decreasing natural atom numbers from the left column to the right. This accounts for the fact that the more labeled atoms there are, the less atoms of the same element are available as natural unlabeled atoms.5, 7 Second, when building the overall correction matrix, the order of multiplying the elemental matrices are different. Specifically, while order of multiplication for the non-labeled nutrient matrices does not matter, the matrix of the labeling element should always be to the right of the non-labeling elements, and followed by the purity matrix. Third, the correction limits are calculated differently, as shown in Figure 3. For these reasons, the actual correction matrix depends on the tracer employed. For ease of implementation, separate versions of AccuCor are provided for experiments involving 13C, 15N, or 2H as the tracer. When correcting the isotope natural abundance for a 2H or 15N tracer experiment, the 2H or 15N version of AccuCor should be used, even though the major isotope being corrected is 13C.
Our correction algorithm also works with dual-isotope labeling, such as use of 13C5, 15N2-glutamine as the tracer, or use of 13C-glucose and 15N-ammonia together as tracers. Instead of individual carbon and nitrogen correction matrices, a C/N joint matrix is needed for the correction. If the resolution is high enough so that all the 13C and 15N isotopologues are resolved, which for glutamine itself requires a minimal resolution of 34,000, the labeling vector can be solved similarly. If 13C1 and 15N1 are not resolved, the joint matrix is almost singular, and the correction result is sensitive to experimental errors. To avoid erroneous isotope correction of dual-isotope labeling experiments, the labeling fractions of interest must be resolvable. The minimal nominal resolution required can be calculated from Eq 3.
Experimental validation of isotopic natural abundance correction of high-resolution data
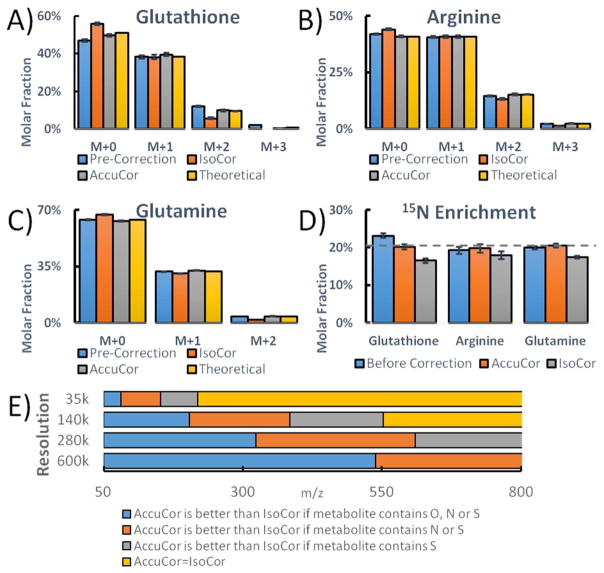
As an experimental test of this isotope correction method, we grew yeast cells in minimal media containing 80% (14NH4)2SO4 and 20% (15NH4)2SO4. Glutathione (C10H17N3O6S) was extracted and its spectrum measured at 140,000 nominal resolution (Fig. 5A). The spectrum can be used to calculate by binomial probability the extent of 15N enrichment, based on the occurrence of 3 nitrogen atoms in glutathione. The uncorrected spectrum overestimates the 15N enrichment to be 23.2%. IsoCor assumes no isotopologue separation and therefore over-corrects the 15N enrichment to 16.6%. Our method gives an accurate 15N enrichment of 19.8%-20.5% (Figure 5D). For smaller metabolites, such as arginine and glutamine, the 15N peak is fully resolved and no correction is required; however, these peaks are inappropriately corrected by IsoCor (Figure 5B and C). In general, AccuCor always performs at least as well as IsoCor, and is more accurate for high-resolution measurements of small metabolites, where IsoCor inappropriately corrects for natural abundance peaks that are mass resolved (Figure 5E).
Figure 5.
The comparison of correction methods. A–C) The labeling patterns of glutathione, arginine and glutamine before and after correction are plotted. The theoretical pattern is calculated based on the experimental condition of 20% 15N enrichment. D) 15N enrichment is calculated from the labeling patterns (n=6, mean ± s.d.). The experimentally introduced enrichment of 20% is shown by the dashed line. E) Performance of AccuCor and IsoCor as a function of analyte m/z and atomic composition and mass spectrometer resolving power.
Conclusions
In this work, we investigated the spectral accuracy of orbitrap mass spectrometer. For masses far above the lower end of the mass scan range, systematic under measurement of isotopic peaks (e.g. M+1 and M+2 from natural isotope abundances) was observed, especially in high-resolution scans. One possible explanation is: Imperfect containment in the C-trap leads to ion packets arriving on suboptimal trajectories to the orbitrap analyzer, resulting in accelerated de-phasing of ion packets in the orbitrap. The decay rate may be faster for lower abundance species or species with isotopic fine structure, resulting in systematic under-measurement of these peaks during the prolonged scan times needed for high-resolution data acquisitions. We found that the spectral accuracy at high resolution can be improved using a split mass scan range: one scan for lower m/z (75 – 500) and a separate one for higher m/z (500 – 1000). Such a split scans advantageously reduce the ratio of m/z simultaneously trapped in the C-trap, leading to better C-trap containment and thereby more optimal trajectories in the orbitrap. Having thus obtained more accurate raw spectral data, we developed an isotopic natural abundance correction algorithm that addresses isotopologue peak separation under high-resolution. The associated code, termed AccuCor, shows superior performance to IsoCor for high-resolution data and is freely available in open source format. Collectively, these improvements enable more accurate measurement of isotope labeling patterns and thus metabolic fluxes by mass spectrometry.
Supplementary Material
Acknowledgments
We thank Alexander Makarov from Thermo Fisher Scientific for helping us understand the physics behind measurement errors and for suggesting the split scan window approach. We thank the Thermo Fisher Scientific Demo Lab (Somerset, NJ) for validating the two scan event method. We also want to thank all members of the Rabinowitz laboratory for advice and testing of the AccuCor code. This work was funded by the U. S. National Institutes of Health for J.D.R. (R01 CA163591 and P30DK019525) and CA211437 to W.L., the U. S. Department of Energy for J.D.R. (DE-SC0012461).
References
- 1.Zamboni N, Saghatelian A, Patti GJ. Mol Cell. 2015;58:699–706. doi: 10.1016/j.molcel.2015.04.021. [DOI] [PMC free article] [PubMed] [Google Scholar]
- 2.Buescher JM, Antoniewicz MR, Boros LG, Burgess SC, Brunengraber H, Clish CB, DeBerardinis RJ, Feron O, Frezza C, Ghesquiere B, Gottlieb E, Hiller K, Jones RG, Kamphorst JJ, Kibbey RG, Kimmelman AC, Locasale JW, Lunt SY, Maddocks OD, Malloy C, Metallo CM, Meuillet EJ, Munger J, Noh K, Rabinowitz JD, Ralser M, Sauer U, Stephanopoulos G, St-Pierre J, Tennant DA, Wittmann C, Vander Heiden MG, Vazquez A, Vousden K, Young JD, Zamboni N, Fendt SM. Curr Opin Biotechnol. 2015;34:189–201. doi: 10.1016/j.copbio.2015.02.003. [DOI] [PMC free article] [PubMed] [Google Scholar]
- 3.Antoniewicz MR. J Ind Microbiol Biotechnol. 2015;42:317–325. doi: 10.1007/s10295-015-1585-x. [DOI] [PubMed] [Google Scholar]
- 4.van Winden WA, Wittmann C, Heinzle E, Heijnen JJ. Biotechnol Bioeng. 2002;80:477–479. doi: 10.1002/bit.10393. [DOI] [PubMed] [Google Scholar]
- 5.Millard P, Letisse F, Sokol S, Portais JC. Bioinformatics. 2012;28:1294–1296. doi: 10.1093/bioinformatics/bts127. [DOI] [PubMed] [Google Scholar]
- 6.Jungreuthmayer C, Neubauer S, Mairinger T, Zanghellini J, Hann S. Bioinformatics. 2016;32:154–156. doi: 10.1093/bioinformatics/btv514. [DOI] [PubMed] [Google Scholar]
- 7.Moseley HN. BMC Bioinformatics. 2010;11:139. doi: 10.1186/1471-2105-11-139. [DOI] [PMC free article] [PubMed] [Google Scholar]
- 8.Scigelova M, Hornshaw M, Giannakopulos A, Makarov A. Mol Cell Proteomics. 2011;10:M111009431. doi: 10.1074/mcp.M111.009431. [DOI] [PMC free article] [PubMed] [Google Scholar]
- 9.Zubarev RA, Makarov A. Anal Chem. 2013;85:5288–5296. doi: 10.1021/ac4001223. [DOI] [PubMed] [Google Scholar]
- 10.Makarov A, Denisov E, Lange O. J Am Soc Mass Spectrom. 2009;20:1391–1396. doi: 10.1016/j.jasms.2009.01.005. [DOI] [PubMed] [Google Scholar]
- 11.Lu W, Clasquin MF, Melamud E, Amador-Noguez D, Caudy AA, Rabinowitz JD. Anal Chem. 2010;82:3212–3221. doi: 10.1021/ac902837x. [DOI] [PMC free article] [PubMed] [Google Scholar]
- 12.Werner T, Sweetman G, Savitski MF, Mathieson T, Bantscheff M, Savitski MM. Anal Chem. 2014;86:3594–3601. doi: 10.1021/ac500140s. [DOI] [PubMed] [Google Scholar]
- 13.Patiny L, Borel A. J Chem Inf Model. 2013;53:1223–1228. doi: 10.1021/ci300563h. [DOI] [PubMed] [Google Scholar]
- 14.Melamud E, Vastag L, Rabinowitz JD. Anal Chem. 2010;82:9818–9826. doi: 10.1021/ac1021166. [DOI] [PMC free article] [PubMed] [Google Scholar]
- 15.Clasquin MF, Melamud E, Rabinowitz JD. Curr Protoc Bioinformatics. 2012;Chapter 14(Unit14):11. doi: 10.1002/0471250953.bi1411s37. [DOI] [PMC free article] [PubMed] [Google Scholar]
- 16.Antoniewicz MR, Kelleher JK, Stephanopoulos G. Metab Eng. 2007;9:68–86. doi: 10.1016/j.ymben.2006.09.001. [DOI] [PMC free article] [PubMed] [Google Scholar]
- 17.Antoniewicz MR, Kelleher JK, Stephanopoulos G. Metab Eng. 2006;8:324–337. doi: 10.1016/j.ymben.2006.01.004. [DOI] [PubMed] [Google Scholar]
- 18.Gorshkov MV, Fornelli L, Tsybin YO. Rapid Commun Mass Spectrom. 2012;26:1711–1717. doi: 10.1002/rcm.6289. [DOI] [PubMed] [Google Scholar]
- 19.Ilchenko S, Previs SF, Rachdaoui N, Willard B, McCullough AJ, Kasumov T. J Am Soc Mass Spectrom. 2013;24:309–312. doi: 10.1007/s13361-012-0536-2. [DOI] [PMC free article] [PubMed] [Google Scholar]
- 20.Hofstadler SA, Bruce JE, Rockwood AL, Anderson GA, Winger BE, Smith RD. International Journal of Mass Spectrometry and Ion Processes. 1994;132:109–127. [Google Scholar]
- 21.Erve JC, Gu M, Wang Y, DeMaio W, Talaat RE. J Am Soc Mass Spectrom. 2009;20:2058–2069. doi: 10.1016/j.jasms.2009.07.014. [DOI] [PubMed] [Google Scholar]
- 22.Hoegg ED, Barinaga CJ, Hager GJ, Hart GL, Koppenaal DW, Marcus RK. J Am Soc Mass Spectrom. 2016;27:1393–1403. doi: 10.1007/s13361-016-1402-4. [DOI] [PubMed] [Google Scholar]
- 23.Rockwood AL, Erve JC. J Am Soc Mass Spectrom. 2014;25:2163–2176. doi: 10.1007/s13361-014-0982-0. [DOI] [PubMed] [Google Scholar]
- 24.Grinfeld D, Aizikov K, Kreutzmann A, Damoc E, Makarov A. Anal Chem. 2017;89:1202–1211. doi: 10.1021/acs.analchem.6b03636. [DOI] [PubMed] [Google Scholar]
- 25.Perry RH, Cooks RG, Noll RJ. Mass Spectrom Rev. 2008;27:661–699. doi: 10.1002/mas.20186. [DOI] [PubMed] [Google Scholar]
Associated Data
This section collects any data citations, data availability statements, or supplementary materials included in this article.


