Abstract
Much understanding of metabolism is based on monitoring chemical reactions in cells with isotope tracers. For this purpose, 13C is well suited due to its stable incorporation into bio-molecules and minimal kinetic isotope effect. For redox reactions, however, deuterium tracing can provide valuable additional information. To date, studies examining NADPH production with deuterated carbon sources have failed to account for roughly half of NADPH’s redox active hydrogen. Here we show that the missing hydrogen is the result of enzyme-catalyzed H-D exchange between water and NADPH. While isolated NADPH does not undergo H-D exchange with water, such exchange is catalyzed by Flavin enzymes and occurs rapidly in cells. Correction for H-D exchange is required for accurate assessment of the biological sources of NADPH’s high energy electrons. Deuterated water (D2O) is frequently used to monitor fat synthesis in vivo, but the chemical pathway of the deuteron into fat remains unclear. We show that D2O labels fatty acids primarily via NADPH. Knowledge of this labeling route enables calculation, without any fitting parameters, of the mass isotope distributions of fatty acids from cells grown in D2O. Thus, knowledge of enzyme-catalyzed H-D exchange between water and NADPH enables chemically accurate interpretation of deuterium tracing studies of redox cofactor and fatty acid metabolism.
TOC image
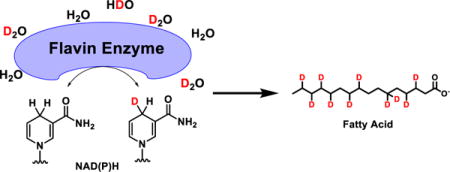
NADPH is an essential energy carrier in biology1, 2. The light-dependent reactions of photosynthesis produce NADPH, which is used to drive reduction of carbon dioxide to carbohydrate in the Calvin cycle. NADPH is also used for biosynthesis of amino acids (specifically proline in mammals), deoxyribonucleotides, sterols, and fatty acids1. In addition, it plays a central role in redox defense2. Because of the importance of these pathways in agriculture, bioengineering, and health, there is great interest in understanding NADPH production and consumption.
In mammals, there are five well-established pathways for producing NADPH2. The oxidative pentose phosphate pathway (oxPPP) makes cytosolic NADPH; transhydrogenase makes mitochondrial NADPH; and malic enzyme, isocitrate dehydrogenase (IDH), and folate metabolism can make NADPH in either compartment depending on the isozymes involved. A classical approach to understanding the activities of these pathways is to use 13C- or14C-tracers3. For example, the oxPPP releases glucose C1 as CO2, and thus its flux can be monitored by feeding 1-14C-glucose and tracking radioactive CO2 release3. The broader effectiveness of carbon tracer approaches is, however, limited, as transhydrogenase does not involve any carbon transformation and different isozymes of malic enzyme, IDH, and folate enzymes can carry out the same carbon transformation making either NADH or NADPH.
To address these limitations, in 2014, Fan et al3. and Lewis et al4. introduced deuterium (2H) tracer methods to more directly track the source of the redox-active hydride of NADPH. These methods resulted in important biological insights, including the potential for both folate metabolism and IDH to contribute substantially to mitochondrial antioxidant defense. Quantitative analysis, however, revealed substantial “missing” 2H-labeling of NADPH, even after accounting for the deuterium kinetic isotope effect. For example, in several transformed cell lines in culture, 2H labeling showed that roughly only 30%–50% of cytosolic NADPH was being produced by the oxPPP3, 4 and only small amounts by other pathways, suggesting one or more major unknown NADPH production route.
Here we recognized that one possibility for the deficient NADPH labeling is H-D exchange: Instead of the low labeling reflecting a missing pathway that provides hydride, there could simply be H-D exchange of the redox-active hydrogen5, 6. Accordingly, we assessed the potential for NADPH to become labeled in D2O. Extent of labeling was measured by LC-MS5, using acetonitrile: water as the chromatography solvents. Readily exchangeable hydrogens, e.g., on NADPH’s amines and alcohols, should become deuterium in the D2O, but immediately revert to hydrogen upon injection into the LC. Consistent with this, we observed no labeling of NADPH after incubation in 80% D2O at room temperature followed by LC-MS analysis (Fig. 1a). This could in principle reflect either the absence of H-D exchange at the redox active hydrogen or such rapid exchange as to revert during the LC-MS analysis.
Figure 1.
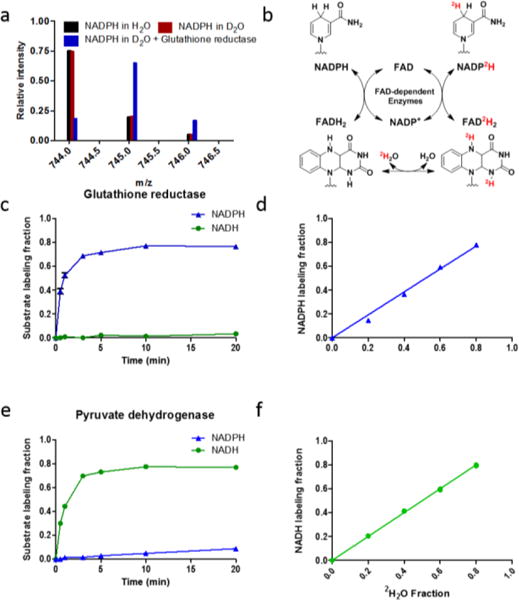
H-D exchange between water and NADPH’s redox active hydrogen is catalyzed by Flavin enzymes. a) NADPH labeling from D2O requires the FAD-dependent enzyme glutathione reductase. Mass spectra of NADPH (0.2 mM) in H2O, in 80% D2O, and in 80% D2O with glutathione reductase (8.5 unit/mL, 30 min, RT). Both H2O and D2O contained 2.5 mM Tris and 5 mM NaCl. b) Reaction scheme. c, e) Reaction kinetics (mean ± SD, N = 3). d, f) Dependence of labeling on solvent D2O percentage (mean ± SD, N = 3).
Because most C-H bonds do not undergo H-D exchange, we hypothesized that the NADPH redox active hydrogen was not exchanging (Fig. 1a). We reasoned that an enzyme, however, might catalyze such exchange via a mechanism involving reversible hydride transfer between NADPH and another cofactor, which holds the hydride in an N-H or O-H bond, rather than a C-H bond (Fig. 1b). Flavins are redox cofactors that hold hydride in N-H bonds6. Accordingly, we added a common Flavin enzyme, glutathione reductase, to NADPH in D2O. This resulted in labeling of NADPH with a half-time of about 1 min (Fig. 1c). Thus, NADPH alone does not undergo spontaneous H-D exchange at the redox active hydrogen, but does undergo exchange in the presence of Flavin enzyme.
The exchange reaction occurred without the other substrate of the enzyme, glutathione. Therefore, we presume that the exchange is via the reversible half reaction that transfers the active hydrogen between NADPH and Flavin (Fig. 1b).7, 8 With correction for natural isotope abundances9, we found that NADPH only incorporates one deuterium from the solvent, indicating that the enzyme catalyzes exchange on only one side of the prochiral NADPH redox active site. Other NADPH enzymes involving the same chemistry, such as Flavin-containing monooxygenases10, 11, nitric oxide synthase12 and methylenetetrahydrofolate reductase13, are also expected to catalyze NADPH H-D exchange. We have tested another Flavin-dependent enzyme, NADPH diaphorase, and it catalyzed NADPH H-D exchange (Supplementary Fig. 1a). Pyruvate dehydrogenase, an NADH-dependent Flavin enzyme, did not catalyze NADPH H-D exchange but did catalyze similar exchange for NADH (Fig. 1e). For both glutathione reductase and pyruvate dehydrogenase, the extent of labeling is linear with solvent D2O concentration (Fig. 1d, f), suggesting that the kinetic isotope effect is small. Thus, Flavin-dependent enzymes catalyze H-D exchange between water and NAD(P)H.
Having identified the potential for enzyme-catalyzed NADPH H-D exchange, we were curious if such exchange occurs in cells. To this end, we looked for NADPH labeling in cells placed transiently in media containing D2O. In 293T and HCT116 cells, we observed rapid NADPH labeling (t1/2 ~ 1 min) (Fig. 2a). In addition, NADP+ also gets deuterium incorporation at C-4 position due to the removal of 1H from NADP(2H). The deuterated NADP+ in turn makes di-deuterium NADPH, which was also observed quickly after placing cells in D2O (Supplementary Fig. 4a). To quantitate specifically the redox-active hydrogen labeling, we need to deconvolute the NADP+ labeling from the NADPH labeling pattern, which is done through fitting matrix equations (see Methods). The redox-active hydrogen labeling reached steady state in ~ 5 min and tracked linearly with solvent D2O percentage (Fig. 2b). Similar results were also found for NADH (Supplementary Fig. 2b).
Figure 2.
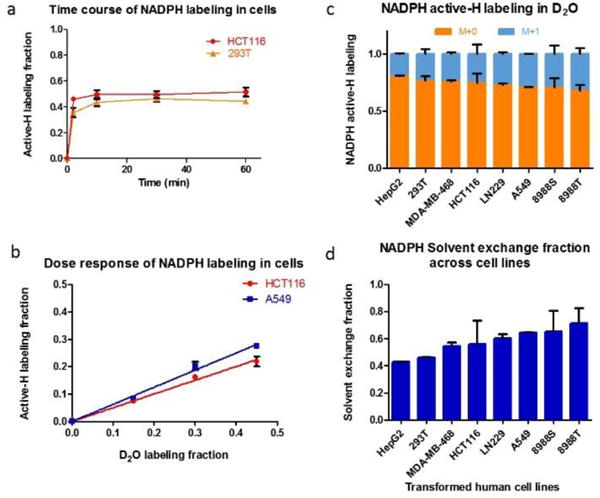
Rapid H-D exchange occurs between water and NADPH in cultured human cells. a) Cellular NADPH is rapidly labeled on its active-H. Cells were switched from unlabeled medium to 45% D2O media at t = 0 (Mean ± SD, N = 3). b) NADPH labeling depends linearly on medium D2O percentage (2 h incubation, mean ± SD, N = 3). c) D2O (45%) extensively labels NADPH’s redox active hydrogen (active-H) across eight transformed human cell lines (Mean ± SD, N = 3). Active-H labeling is calculated by comparing the mass isotope distribution for NADPH and NADP+. d) Fraction of NADPH’s redox-active hydrogen derived from H-D exchange with water: the active-H labeling fraction (panel c) divided by the fraction D2O in the cell culture medium.
To examine the universality of this phenomenon, and look for cell-type differences, we measured the extent of labeling in eight different cultured cell lines, mainly derived from human cancer. We found that all of the cells underwent substantial H-D exchange in both NADPH (Fig. 2c, d) and NADH (Supplementary Fig. 2c, d). The extent of NADH labeling was indistinguishable across cell lines, whereas NADPH labeling varied over a roughly two-fold range. Correction of the NADPH labeling percentage for the extent of water labeling revealed that the fraction of NADPH redox active hydrogen coming from water ranged from ~ 40% to ~ 70%. We hypothesize that this variability reflects the overall extent of Flavin enzyme activity across the cell lines and can be used as an indicator of such activity in future research. In addition, the extent of labeling may be influenced by the reversibility of the Flavin enzyme reactions, as introduction of the label requires reverse flux from FAD2H2 to make NADP2H.
Having identified substantial H-D exchange in cellular NADPH, we set out to reevaluate the contribution of the oxPPP in light of such exchange. The relative contribution of the oxPPP to NADPH can be traced with [3-2H]-Glucose, which transfers deuterium onto NADPH at the 6-phosphogluconate dehydrogenase step of the oxPPP3 (Fig. 3a). Because the oxPPP makes a total of 2 NADPH, the relative contribution measured with [3-2H]-Glucose multiplied by 2 gives the total oxPPP contribution. Extent of whole cell NADPH labeling from [3-2H]-Glucose varied from 4.7±0.3% to 21.5±3.7% (Mean ± SD) across four mammalian cell lines (Fig. 3b). Cytosolic NADPH labeling from [3-2H]-Glucose can also be estimated from fatty acid labeling, with similar results (Fig. 4c).
Figure 3.
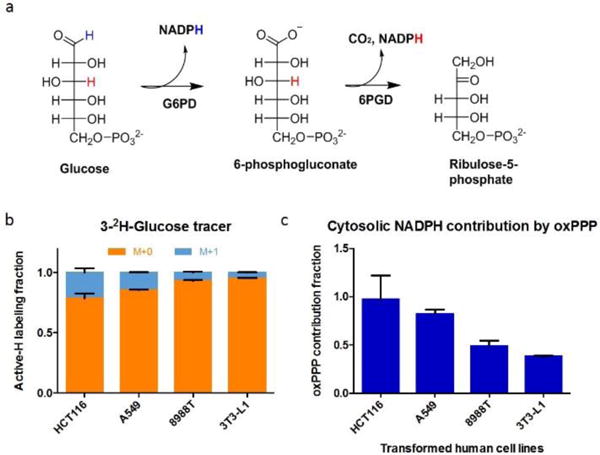
Correction for H-D exchange between NADPH and water enables accurate determination of the oxidative pentose phosphate pathway (oxPPP) contribution to NADPH production. a) Reaction scheme of oxPPP, with glucose 3-H in red. b) Active-H labeling from [3-2H]-glucose is limited, suggesting a minority contribution of the oxPPP to NADPH production (Mean ± SD, N = 3). c) Correction for H-D exchange (see Eq. 3) reveals that the oxPPP accounts for most cytosolic NADPH production in HCT116 and A549 cells. In 8988T and 3T3-L1 cells, where folate metabolism and malic enzyme are known to be important cytosolic NADPH sources, the oxPPP makes a substantial but minority contribution.
Figure 4.
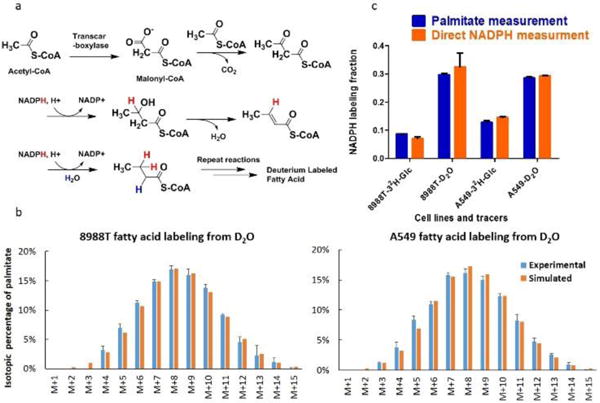
D2O labels fatty acids through direct solvent incorporation and NADPH-mediated hydrogen transfer. a) Fatty acid synthesis reaction scheme, highlighting routes by which NADPH and water contribute hydrogens to a growing fatty acyl chain. For every addition of two carbons, two hydrogens come from NADPH (red) and one from water (blue). b) Experimental and simulated palmitate labeling pattern. Experimental data is the measured mass isotope distribution of palmitate, corrected for natural isotope abundance, after incubation of cells for 2 h in 45% D2O. The simulation is based on deuterium assimilation directly (with a 45% probability, based on the medium D2O percentage) and via NADPH (with a 31% probability for A549 and 29% probability for 8988T, based on the measured NADPH active-H labeling). c) Comparison of active-H labeling fraction from direct NADPH measurement and from fitting NADPH labeling percentage based on the fatty acid mass isotope distribution data.
To correct these directly measured 2H labeling fractions for NADPH H-D exchange, consider all fluxes (f) transferring a hydrogen nucleus to NADPH, with the fother referring to pathways other than the oxPPP that transfer hydride, and fexchange referring to hydrogen nuclei coming from H-D exchange:
| (1) |
Let Hpathway be the fraction of NADPH redox-active hydrogen coming from a particular pathway. Hpathway can be determined experimentally by feeding a tracer specific to an enzymatic step of the pathway, measuring NADPH redox-active hydrogen labeling (i.e. by comparing NADPH to NADP+ labeling), dividing by the extent of substrate labeling, and multiplying by the number of NADPH produced by the pathway:
| (2) |
In determining Hpathway, it is important to consider also the potential for labeling to be reduced by the deuterium kinetic isotope effect. For cells fed 100% [3-2H]-Glucose, the impact of the deuterium kinetic isotope effect on labeling is likely small, as oxPPP flux is unlikely to be altered by introduction of the deuterium tracer at carbon 3, as the committed pathway step involves hydride transfer from carbon 1. Combining these equations it is possible to determine the fraction of NADPH hydride (i.e. NADPH’s high energy electrons), αpathway, coming from a pathway of interest, in this case the oxPPP:
| (3) |
The calculation of αpathway may be influenced by the deuterium kinetic isotope effect in the NADPH-water exchange reaction. This KIE, however, appears to be small (Fig. 1d). Moreover, it will tend to similarly decrease transfer from NADP2H to water and from D2O to NADPH, factors that offset in Eq. 3. Combining the results of Fig. 2b and 3b, for the Ras-driven colon cancer cell line HCT116, we obtain αoxPPP = 97±25% (Fig. 3c). Similarly, in the Ras-driven lung cancer cell line A549, we obtain αoxPPP = 82±4%. In contrast, in the Ras-driven pancreatic cancer cell line 8988T, where both malic enzyme 114 and the folate enzyme MTHFD1 have been implicated as significant cytosolic NADPH producers15, and in differentiated 3T3-L1 adipocytes where malic enzyme is a major NADPH producer16, αoxPPP < 50%. In immortalized pluripotent stem cells, prior literature has reported > 50% NADPH labeling from 3-2H-glucose, suggesting slower exchange between water and NADPH in that cell type17. Thus, by combining measurements of NADPH labeling by H-D exchange with water and by 2H-carbon sources, we can determine the sources of high-energy electrons feeding into NADPH. Even without any correction for the deuterium kinetic isotope effect, these measurements largely eliminate the labeling deficiency found in prior studies, arguing against the existence of major missing NADPH production routes.
Fat metabolism plays a major role in human health and disease. Accordingly, there is a long-standing interest in measuring fat bio-synthesis in mammals. As early as 1938, researchers observed that D2O labels fatty acids during de novo fatty acid synthesis18. Since the 1970s, heavy water has been the primary tool used to study fatty acid synthesis in vivo8, 19–21. During each step of fatty acid elongation, one acetyl group, two NADPH hydrides, and one water proton (or, in D2O, deuteron) are incorporated into the growing fatty acid chain (Fig. 4a). The extent of fat labeling from D2O, however, exceeds that which can be accounted for based on direct deuteron assimilation. The chemical reactions responsible for the additional labeling have to this point remained unclear, with calculations of fatty acid synthesis rates reliant on an empirical correction factor for the fraction of fat hydrogens coming from water22–24. Based on our observation of enzyme-catalyzed H-D exchange in NADPH, we hypothesized that such exchange is the source of the additional fat labeling. We reasoned that, if this is the case, we should be able to calculate the labeling patterns of fatty acids in cells grown in D2O based on independent measurement of NADPH redox-active hydrogen labeling. Specifically, fatty acid labeling is the result of two stochastic hydrogen selection processes, with 1/3 of hydrogens coming directly from water and 2/3 coming from NADPH. For a given D2O enrichment in water (D), and fraction of NADPH made by H-D exchange (Hexchange), fatty acid labeling is given by the following equations. LD,j denotes the fraction of palmitate which has j number of deuterium directly incorporated from D2O (i.e. not via NADPH) at a given water D2O enrichment of D.
| (4) |
LH,k denotes the fraction of palmitate which has k number of deuterium incorporated via labeled NADPH resulting from H-D exchange between D2O and NADPH, with H = Hexchange
| (5) |
Li denotes the fraction of palmitate has i number of deuterium from both D2O and NADPH labeling
| (6) |
This calculation ignores any potential kinetic isotope effect in fat synthesis, consistent with biochemical literature showing that such an effect is small25.
We compared the palmitate labeling patterns measured experimentally to those calculated using equation (6), with Hexchange measured based on direct LC-MS measurement of NADPH labeling. This calculation, which involves zero free parameters (i.e. no fitting), matches the experimentally data very well (Fig. 4b). Alternatively, the observed labeling patterns can be fit to determine Hexchange, which in this case is specific to cytosolic NADPH, as only cytosolic NADPH feeds into fat synthesis. This indirect measurement of cytosolic Hexchange agrees well with direct measurements of Hexchange, based on whole cell NADPH labeling (Fig. 4c). Thus, enzyme-catalyzed H-D exchange NADPH is a major mechanism by which D2O labels fat. Based on the widespread nature of Flavin enzymes and the fundamental H-D exchange chemistry, we anticipate that the basic mechanisms described here will apply across kingdoms of life.
In summary, the redox-active hydrogen of NADPH is bound to carbon and thus intrinsically resistant to H-D exchange. Such exchange, however, is catalyzed by Flavin enzymes and occurs rapidly in cells. In combination with tracing using [3-2H]-Glucose, accounting for this exchange enables accurate determination of the oxidative pentose phosphate pathway contribution to cytosolic NADPH. This contribution was close to 100% in some cell lines, consistent with genetics pointing to a particular importance on the oxPPP in making NADPH26–28. Tracers for other NADPH pathways are less specific and merit further development.
A major consumption route of NADPH is fat synthesis, and H-D exchange between D2O and NADPH in cells leads to downstream fat labeling. Knowledge of this labeling mechanism enables calculation, without any free parameters, of fatty acid labeling patterns from D2O, the main tracer used to monitor fat synthesis in mammals. D2O can also be used to trace the synthesis other biomolecules, including newly made DNA29, whose deoxyribonucleotide building blocks are made by ribonucleotide reductase, a Flavin enzyme. Enzyme-catalyzed H-D exchange is likely a contributor to biomolecule labeling also in these contexts.
Supplementary Material
Acknowledgments
We thank NIH grant DK113643 and DOE grant DE-SC0012461 to J.D.R., NIH grants P30DK019525, which supports a joint Princeton-U Penn Metabolomics Core for Diabetes Research and P30CA072720 for The Rutgers Cancer Institute of New Jersey, and Pfizer, Inc., for funding. We thank Gregory. S. Ducker for his advice for the abstract and Alexis Cowen for her advice for main text.
Footnotes
Supporting Information
Material and methods, data analysis methods, and supplementary figure S1–S5
Notes
The authors declare no competing financial interest.
References
- 1.Paselk R. Journal of Chemical Education. 1983;60(7):A201–A202. [Google Scholar]
- 2.Ying W. Antioxidants & Redox Signaling. 2008;10(2):179–206. doi: 10.1089/ars.2007.1672. [DOI] [PubMed] [Google Scholar]
- 3.Fan J, Ye J, Kamphorst JJ, Shlomi T, Thompson CB, Rabinowitz JD. Nature. 2014;510(7504):298–302. doi: 10.1038/nature13236. [DOI] [PMC free article] [PubMed] [Google Scholar]
- 4.Lewis CA, Parker SJ, Fiske BP, McCloskey D, Gui DY, Green CR, Vokes NI, Feist AM, Vander Heiden MG, Metallo CM. Mol Cell. 2014;55(2):253–63. doi: 10.1016/j.molcel.2014.05.008. [DOI] [PMC free article] [PubMed] [Google Scholar]
- 5.Lu W, Wang L, Chen L, Hui S, Rabinowitz JD. Antioxid Redox Signal. 2017 doi: 10.1089/ars.2017.7014. Online early access. Published Online: May 11, 2017. [DOI] [PMC free article] [PubMed] [Google Scholar]
- 6.Macheroux P, Ghisla S, Sanner C, Rüterjans H, Müller F. BMC Biochem. 2005;6:26. doi: 10.1186/1471-2091-6-26. [DOI] [PMC free article] [PubMed] [Google Scholar]
- 7.Benson TE, Marquardt JL, Marquardt AC, Etzkorn FA, Walsh CT. Biochemistry. 1993;32(8):2024–30. doi: 10.1021/bi00059a019. [DOI] [PubMed] [Google Scholar]
- 8.Chen S, Guillory RJ. Biochem Biophys Res Commun. 1985;129(2):584–90. doi: 10.1016/0006-291x(85)90191-3. [DOI] [PubMed] [Google Scholar]
- 9.Su X, Lu W, Rabinowitz J. D. Anal Chem. 2017;89(11):5940–5948. doi: 10.1021/acs.analchem.7b00396. [DOI] [PMC free article] [PubMed] [Google Scholar]
- 10.Eswaramoorthy S, Bonanno J, Burley S, Swaminathan S. Proceedings of the National Academy of Sciences of the United States of America. 2006;103(26):9832–9837. doi: 10.1073/pnas.0602398103. [DOI] [PMC free article] [PubMed] [Google Scholar]
- 11.Krueger SK, Williams DE. Pharmacol Ther. 2005;106(3):357–87. doi: 10.1016/j.pharmthera.2005.01.001. [DOI] [PMC free article] [PubMed] [Google Scholar]
- 12.Alderton W, Cooper C, Knowles R. Biochemical Journal. 2001;357:593–615. doi: 10.1042/0264-6021:3570593. [DOI] [PMC free article] [PubMed] [Google Scholar]
- 13.Sumner J, et al. Journal of the American Chemical Society. 1992;114(18):6949–6956. [Google Scholar]
- 14.Son J, Lyssiotis, et al. Nature. 2013;496(7443):101–5. doi: 10.1038/nature12040. [DOI] [PMC free article] [PubMed] [Google Scholar]
- 15.Ducker GS, Chen L, Morscher RJ, Ghergurovich JM, Esposito M, Teng X, Kang Y, Rabinowitz JD. Reversal of Cell Metab. 2016;24(4):640–641. doi: 10.1016/j.cmet.2016.09.011. [DOI] [PubMed] [Google Scholar]
- 16.Liu L, Shah S, Fan J, Park JO, Wellen KE, Rabinowitz JD. Nat Chem Biol. 2016;12(5):345–52. doi: 10.1038/nchembio.2047. [DOI] [PMC free article] [PubMed] [Google Scholar]
- 17.Zhang H, Badur M, Divakaruni A, Parker S, Jager C, Hiller K, Murphy A, Metallo C. Cell Reports. 2016;16(6):1536–1547. doi: 10.1016/j.celrep.2016.06.102. [DOI] [PMC free article] [PubMed] [Google Scholar]
- 18.Barrett H, Best C, Ridout J. Journal of Physiology-London. 1938;93(4):367–381. doi: 10.1113/jphysiol.1938.sp003646. [DOI] [PMC free article] [PubMed] [Google Scholar]
- 19.Wadke M, Brunengraber H, Lowenstein JM, Dolhun JJ, Arsenault GP. Biochemistry. 1973;12(14):2619–24. doi: 10.1021/bi00738a011. [DOI] [PubMed] [Google Scholar]
- 20.Jungas R. Biochemistry. 1968;7(10):3708–&. doi: 10.1021/bi00850a050. [DOI] [PubMed] [Google Scholar]
- 21.Stiles B, Wang Y, Stahl A, Bassilian S, Lee WP, Kim YJ, Sherwin R, Devaskar S, Lesche R, Magnuson MA, Wu H. Proc Natl Acad Sci U S A. 2004;101(7):2082–7. doi: 10.1073/pnas.0308617100. [DOI] [PMC free article] [PubMed] [Google Scholar]
- 22.Lee WN, Bassilian S, Guo Z, Schoeller D, Edmond J, Bergner EA, Byerley LO. Am J Physiol. 1994;266(3 Pt 1):E372–83. doi: 10.1152/ajpendo.1994.266.3.E372. [DOI] [PubMed] [Google Scholar]
- 23.Saito K, Kawaguchi A, Okuda S, Seyama Y, Yamakawa T. Biochim Biophys Acta. 1980;618(2):202–13. [PubMed] [Google Scholar]
- 24.Seyama Y, et al. Biomedical Mass Spectrometry. 1978;5(5):357–361. doi: 10.1002/bms.1200050507. [DOI] [PubMed] [Google Scholar]
- 25.Yuan Z, Hammes GG. J Biol Chem. 1984;259(11):6748–51. [PubMed] [Google Scholar]
- 26.Kuehne A, Emmert H, Soehle J, Winnefeld M, Fischer F, Wenck H, Gallinat S, Terstegen L, Lucius R, Hildebrand J, Zamboni N. Mol Cell. 2015;59(3):359–71. doi: 10.1016/j.molcel.2015.06.017. [DOI] [PubMed] [Google Scholar]
- 27.Stincone A, Prigione A, Cramer T, Wamelink M, Campbell K, Cheung E, Olin-Sandoval V, Gruning N, Kruger A, Alam M, Keller M, Breitenbach M, Brindle K, Rabinowitz J, Ralser M. Biological Reviews. 2015;90(3):927–963. doi: 10.1111/brv.12140. [DOI] [PMC free article] [PubMed] [Google Scholar]
- 28.Nicol CJ, Zielenski J, Tsui LC, Wells PG. FASEB J. 2000;14(1):111–27. doi: 10.1096/fasebj.14.1.111. [DOI] [PubMed] [Google Scholar]
- 29.Misell L, Hwang E, Au A, Esserman L, Hellerstein M. Breast Cancer Research and Treatment. 2005;89(3):257–264. doi: 10.1007/s10549-004-2228-5. [DOI] [PubMed] [Google Scholar]
Associated Data
This section collects any data citations, data availability statements, or supplementary materials included in this article.


