Abstract
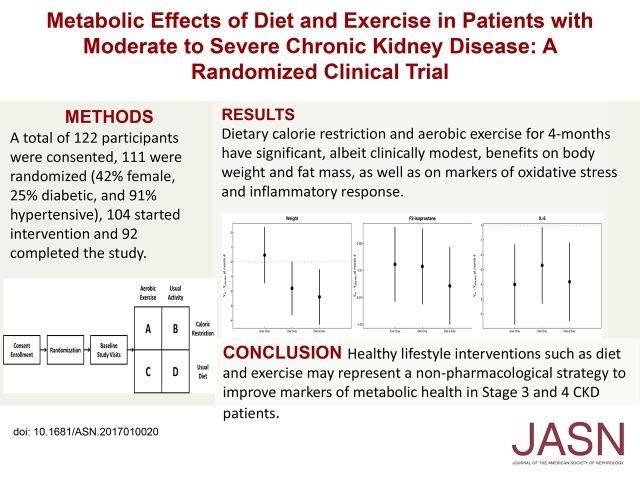
CKD is steadily increasing along with obesity worldwide. Furthermore, obesity is a proinflammatory risk factor for progression of CKD and cardiovascular disease. We tested the hypothesis that implementation of caloric restriction and aerobic exercise is feasible and can improve the proinflammatory metabolic milieu in patients with moderate to severe CKD through a pilot, randomized, 2×2 factorial design trial. Of 122 participants consented, 111 were randomized to receive caloric restriction and aerobic exercise, caloric restriction alone, aerobic exercise alone, or usual care. Of those randomized, 42% were women, 25% were diabetic, and 91% were hypertensive; 104 started intervention, and 92 completed the 4-month study. Primary outcomes were a change from baseline in absolute fat mass, body weight, plasma F2-isoprostane concentrations, and peak oxygen uptake (VO2 peak). Compared with usual care, the combined intervention led to statistically significant decreases in body weight and body fat percentage. Caloric restriction alone also led to significant decreases in these measures, but aerobic exercise alone did not. The combined intervention and each independent intervention also led to significant decreases in F2-isoprostane and IL-6 concentrations. No intervention produced significant changes in VO2 peak, kidney function, or urine albumin-to-creatinine ratio. In conclusion, 4-month dietary calorie restriction and aerobic exercise had significant, albeit clinically modest, benefits on body weight, fat mass, and markers of oxidative stress and inflammatory response in patients with moderate to severe CKD. These results suggest healthy lifestyle interventions as a nonpharmacologic strategy to improve markers of metabolic health in these patients.
Keywords: chronic kidney disease, exercise, metabolism, diet, Chronic inflammation, oxidative stress
CKD is steadily increasing along with obesity in the United States and worldwide. Diabetes and hypertension, traditional risk factors for CKD and cardiovascular disease (CVD), are among the most common and serious consequences of the obesity epidemic.1 However, CVD risk is further magnified with onset and progression of CKD. This has led to the concept that so-called “nontraditional,” particularly proinflammatory, CVD risk factors may be operative in patients with CKD. Oxidative stress is highly prevalent in CKD, suggesting that interventions targeted at this and other metabolic derangements may improve their CVD risk profile.2 Obesity per se increases oxidative stress, characterized by high plasma malondialdehyde and F2-isoprostanes and low erythrocyte copper zinc-superoxide and glutathione peroxidase activity.1 Adipocytes also secrete cytokines that attract macrophages to infiltrate adipose tissue, leading to the release of proinflammatory cytokines and oxygen free radicals, which may ultimately promote atherosclerosis. We have previously shown that body mass index (BMI) and body fat percentage are positively associated with serum C-reactive protein and plasma F2-isoprostanes and negatively associated with plasma protein thiols in patients with CKD stages 3 and 4.3 Therefore, obesity may amplify a proinflammatory metabolic milieu in CKD.
Studies in non-CKD populations suggest that interventions targeting caloric excess and reduced physical activity may benefit the nutritional and metabolic profile in obese adults.4 In experimental models and available human studies, healthy lifestyle interventions, such as aerobic exercise and dietary caloric restriction, have shown antioxidant effects mediated via induction of mitochondrial biogenesis, induction of antioxidant enzymes, and reduction of free radical mitochondrial leak during oxidative phosphorylation.5
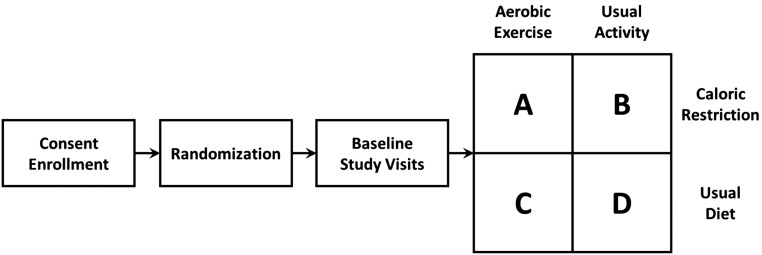
In this study, we hypothesized that implementation of caloric restriction and aerobic exercise is feasible and can improve the metabolic milieu in study participants with moderate to severe CKD. To test this hypothesis, we performed a pilot, randomized, 2×2 factorial design trial in patients with moderate to severe CKD to examine the effects of aerobic exercise and caloric restriction on a metabolic risk profile, including systemic measures of oxidative stress, inflammation, and body composition (Figure 1).
Figure 1.
Study design. After enrollment, patients were randomized to four study arms. Interventions were started after baseline study visit. Subsequent study visits were done at 2 months and 4 months.
Results
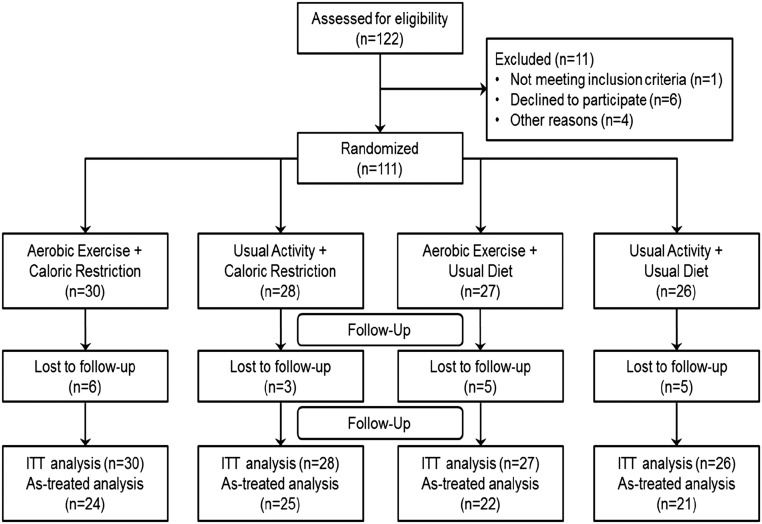
A total of 111 participants were randomized into the four intervention arms of the trial (Figure 2), and their mean age was of 60±11 years old. Of these participants, 47 were women (42%), 28 were diabetic (25%), and 100 (91%) were hypertensive. Mean baseline cystatin C–based estimate of GFR (eGFRcysC) was 41±18.6 mg/ml per 1.73 m2. Table 1 shows baseline demographic and clinical information according to study groups. Of the 111 participants who were randomized, 104 started intervention, and 92 completed the study.
Figure 2.
Consort flow diagram. ITT, intent-to-treat.
Table 1.
Baseline characteristics
| Baseline Characteristic | Aerobic Exercise/Caloric Restriction | Usual Activity/Caloric Restriction | Aerobic Exercise/Usual Diet | Usual Activity/Usual Diet |
|---|---|---|---|---|
| N | 30 | 28 | 27 | 26 |
| Age, yr | 53.5 (49.2 to 59.8) | 58.5 (45.8 to 62.0) | 58.0 (48.5 to 62.0) | 58.5 (45.8 to 64.0) |
| Men | 17 (56.7) | 15 (53.6) | 15 (55.6) | 17 (65.4) |
| Race | ||||
| White | 22 (73.3) | 19 (67.9) | 17 (63) | 16 (61.5) |
| Black | 7 (23.3) | 9 (32.1) | 7 (25.9) | 8 (30.8) |
| Other | 1 (3.3) | 0 (0) | 3 (11.1) | 2 (7.7) |
| Prevalent disease | ||||
| Congestive heart failure | 1 (3.3) | 2 (7.1) | 2 (7.4) | 0 (0) |
| Myocardial infarction | 0 (0) | 0 (0) | 2 (7.4) | 0 (0) |
| Coronary artery disease | 2 (6.7) | 2 (7.1) | 2 (7.4) | 0 (0) |
| Diabetes mellitus | 7 (23.3) | 6 (21.4) | 7 (25.9) | 8 (30.8) |
| Hypertension | 27 (90) | 26 (92.9) | 25 (92.6) | 22 (88) |
| Tobacco use | ||||
| Never | 18 (60) | 11 (39.3) | 7 (25.9) | 14 (56) |
| Current | 3 (10) | 2 (7.1) | 3 (11.1) | 2 (8) |
| Former | 9 (30) | 15 (53.6) | 17 (63) | 9 (36) |
| Systolic BP, mmHg | 128 (109 to 141) | 132 (118 to 141) | 134 (114 to 144) | 136 (118 to 142) |
| BMI, kg/m2 | 32.8 (30.4 to 35.8) | 32.8 (28.7 to 37.1) | 31.0 (28.0 to 36.2) | 35.5 (30.6 to 41.5) |
| Waist, in | 43.9 (41.3 to 45.3) | 41.1 (37.7 to 46.2) | 43.1 (40.8 to 46.4) | 45.5 (41.8 to 51.0) |
| Hip, in | 45.1 (42.1 to 48.0) | 45.0 (42.5 to 50.1) | 44.5 (41.6 to 47.9) | 47.5 (43.0 to 52.6) |
| DEXA body fat, % | 41.2 (35.0 to 45.5) | 42.4 (33.4 to 46.4) | 41.6 (36.7 to 45.4) | 40.5 (32.5 to 43.6) |
| VO2peak, ml/(kg·min) | 19.4 (16.2 to 24.4) | 19.7 (15.4 to 22.2) | 19.8 (16.8 to 22.4) | 19.3 (16.3 to 22.5) |
| Laboratory measurements | ||||
| eGFRcysC, ml/min per 1.73 m2 | 38.0 (28.1 to 54.9) | 39.1 (31.9 to 52.9) | 39.0 (32.4 to 51.9) | 33.2 (27.4 to 46.5) |
| eGFRCKD-EPI, ml/min per 1.73 m2 | 41.9 (27.1 to 48.3) | 44.6 (31.9 to 52.9) | 44.0 (30.2 to 51.2) | 39.1 (31.1 to 49.8) |
| IL-6, pg/ml | 1.37 (0.30 to 2.23) | 1.49 (0.04 to 2.64) | 1.27 (0.04 to 4.11) | 1.41 (0.36 to 3.44) |
| F2-isoprostane, pg/ml | 28.0 (22.5 to 42.0) | 30.0 (21.0 to 37.0) | 31.5 (25.0 to 51.5) | 43.5 (31.0 to 60.0) |
| Urine albumin-to-creatinine ratio, mg/g | 58.5 (22.0 to 362.2) | 29.6 (11.0 to 608.3) | 102.4 (16.6 to 834.2) | 65.6 (8.29 to 238.7) |
Data are presented as median (interquartile range) or n (%). DEXA, dual energy x-ray absorptiometry.
Primary Outcomes
Body Composition
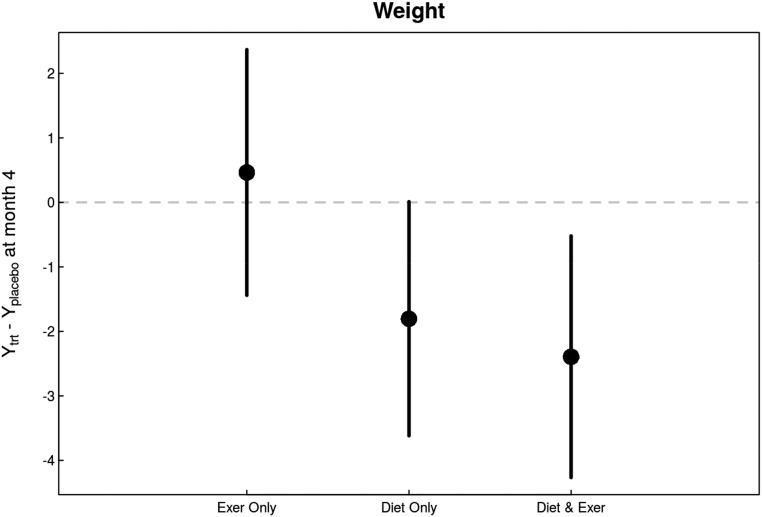
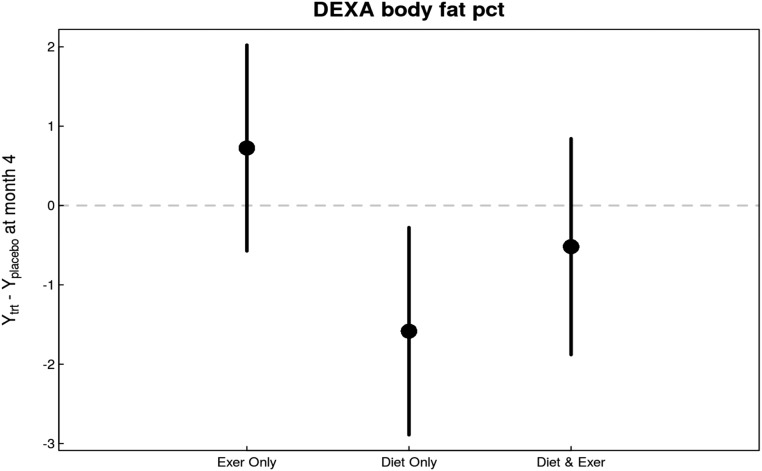
In intent-to-treat analyses, there was a significant overall effect for decrease in body weight with intervention versus usual care (P=0.02 versus usual care). The decrease was most pronounced among patients who were subjected to caloric restriction (P=0.004 versus usual diet) but was not among patients who received exercise intervention (Figure 3). A similar intervention effect was observed in BMI (P=0.03 versus no intervention) primarily driven by a decrease in the diet intervention arm (P<0.01 versus usual diet). Notably, waist-to-hip ratio also significantly decreased in response to caloric restriction (P=0.03 versus usual diet). Changes in body fat percentage were also observed (P=0.02 versus no intervention), primarily due to caloric restriction (P=0.02 versus usual diet) (Figure 4). Table 2 shows the estimates of month 4 treatment effects for all study variables including body composition markers.
Figure 3.
Changes in weight in response to diet and exercise interventions compared with changes in control group indicate a beneficial overall effect primarily driven by the diet intervention. Caloric restriction decreased weight in patients both exercising and not exercising. Exercise alone had no appreciable effect.
Figure 4.
Changes in body fat percentage in response to diet and exercise interventions compared with changes in control group were similar to the changes observed in body weight. Body fat percentage decreased most in patients in the diet-only group. Exercise had no appreciable effect on body fat percentage. DEXA, dual energy x-ray absorptiometry.
Table 2.
Estimates of month 4 treatment effects
| Outcome | N Month 2 | N Month 4 | Overall trt P Valuea | Exerciseb | Dietb | Diet and Exerciseb |
|---|---|---|---|---|---|---|
| BMI, kg/m2 | 98 | 92 | 0.06 | 0.17 (−0.53 to 0.87) | −0.55 (−1.22 to 0.12) | −0.83 (−1.51 to −0.14) |
| Weight, kg | 98 | 92 | 0.06 | 0.46 (−1.44 to 2.37) | −1.80 (−3.62 to 0.01) | −2.39 (−4.27 to −0.52) |
| DEXA body fat, % | 0 | 76 | 0.03 | 0.73 (−0.57 to 2.02) | −1.58 (−2.89 to −0.28) | −0.52 (−1.88 to 0.84) |
| Waist hip ratio | 97 | 90 | 0.13 | 0.01 (−0.02 to 0.03) | −0.02 (−0.04 to <0.01) | −0.02 (−0.04 to <0.01) |
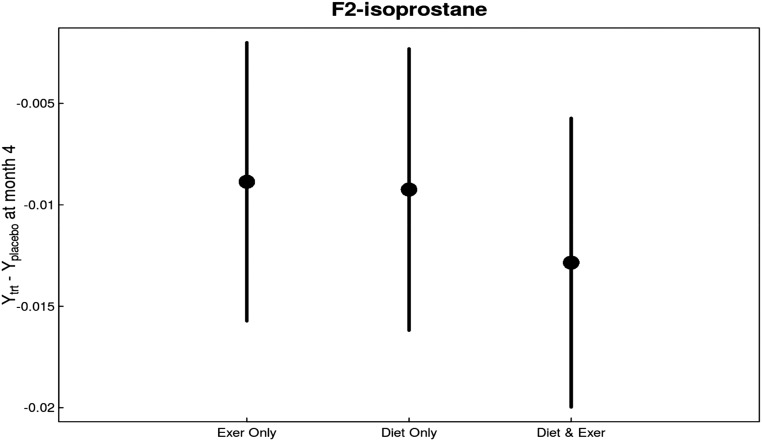
| F2-isoprostane, ng/ml | 0 | 90 | 0.03 | −0.01 (−0.02 to <−0.01) | −0.01 (−0.02 to <−0.01) | −0.01 (−0.02 to −0.01) |
| Isofuran, ng/ml | 0 | 90 | 0.72 | <−0.01 (−0.01 to 0.01) | −0.01 (−0.02 to 0.01) | <−0.00 (−0.02 to 0.01) |
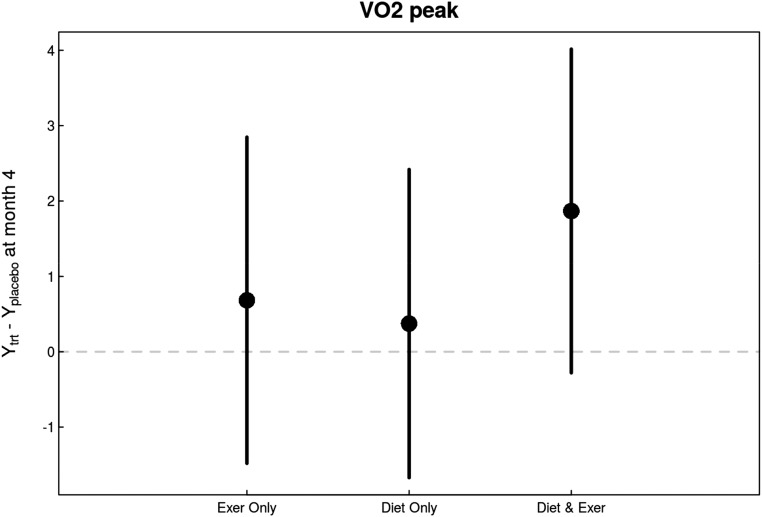
| VO2 peak, ml/(kg·min) | 0 | 86 | 0.36 | 0.68 (−1.48 to 2.85) | 0.37 (−1.67 to 2.42) | 1.87 (−0.28 to 4.02) |
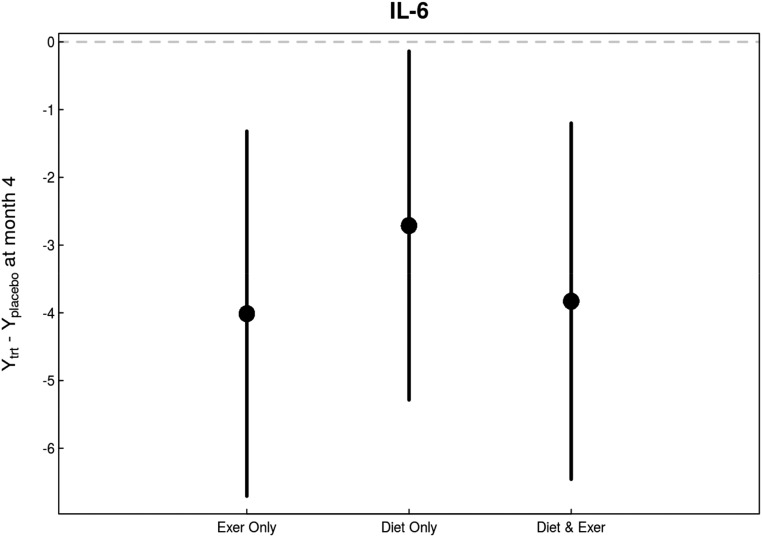
| IL-6, pg/ml | 96 | 90 | 0.03 | −4.01 (−6.71 to −1.32) | −2.71 (−5.29 to −0.14) | −3.83 (−6.46 to −1.20) |
| IL-10, pg/ml | 96 | 90 | 0.26 | −0.07 (−0.80 to 0.66) | 0.64 (−0.06 to 1.34) | −0.20 (−0.92 to 0.51) |
| Systolic BP, mmHg | 98 | 92 | 0.98 | −1.07 (−8.46 to 6.33) | −1.31 (−8.50 to 5.87) | 0.17 (−7.24 to 7.57) |
| Diastolic BP, mmHg | 98 | 92 | 0.84 | 1.03 (−3.63 to 5.69) | −0.29 (−4.79 to 4.22) | −1.12 (−5.79 to 3.55) |
| Urine creatinine, mg/dl | 0 | 89 | 0.50 | −8.65 (−42.17 to 24.86) | 6.54 (−26.13 to 39.21) | −18.51 (−51.89 to 14.87) |
| eGFRcysC, ml/min per 1.73 m2 | 0 | 89 | 0.92 | 1.44 (−3.42 to 6.36) | −0.02 (−4.75 to 4.71) | 0.15 (−4.73 to 5.04) |
trt, treatment; DEXA, dual energy x-ray absorptiometry.
Treatment effect P value refers to a joint (or chunk) test of overall treatment effect, including month 2 effects if month 2 data are available.
The table reports month 4 treatment effect (95% confidence interval). The effect is estimated as the mean month 4 outcome in the treatment arm minus the mean month 4 outcome in the placebo arm. The estimates and 95% confidence intervals are derived from a linear mixed model that controls for baseline characteristics (age, sex, BMI, diabetes status, and baseline outcome measure) and trial characteristics (study site) and included a random intercept for study site and treatment arm. When month 2 data were available, the model also included a time variable and a time by treatment interaction along with a subject-specific random intercept.
Oxidative Stress and Inflammatory Markers
In intent-to-treat analyses, F2-isoprostane concentrations decreased with intervention versus usual care (P=0.01) (Figure 5). The decrease was observed with both caloric restriction (P=0.04 versus usual diet) and exercise intervention (P=0.05 versus usual activity). There was no significant effect of either intervention on plasma isofuran concentrations (Table 2).
Figure 5.
There were consistent overall and individual beneficial effects in changes in F2-isoprostane levels in response to diet and exercise interventions compared with changes in control group. F2-isoprostane levels decreased significantly in all groups, most prominently in the diet and exercise group.
Similarly, there was a significant effect of both exercise and diet interventions on plasma IL-6 concentrations (overall P<0.01 versus usual care; P=0.03 caloric restriction versus usual diet; P=0.004 exercise versus usual activity; P=0.01 interaction between diet and exercise interventions) (Figure 6, Table 2).
Figure 6.
There were consistent overall and individual beneficial effects in changes in IL-6 levels in response to diet and exercise interventions compared with changes in control group. Both caloric restriction and exercise intervention decreased IL-6 levels in study participants.
Cardiorespiratory Fitness
In intent-to-treat analyses, there was no statistically significant changes in peak oxygen uptake (VO2 peak) versus usual care (P=0.43 for overall treatment effect versus usual care; P=0.56 for caloric restriction versus usual diet; P=0.37 for exercise versus usual activity) (Figure 7, Table 2).
Figure 7.
There were no notable changes in VO2 peak in response to diet and exercise interventions compared with changes in control group. All interventions improved VO2 peak, most prominently in the diet and exercise group, although none of the changes reached statistical significance.
Exploratory Outcomes
Kidney function and urine albumin-to-creatinine ratio did not change during the study, and neither intervention had any effect on these parameters.
Additional Analyses
Supplemental Table 1 provides raw data of outcome measures at baseline, month 2 (if available), and month 4. Supplemental Table 2 provides the treatment effects, exercise, diet, and combination at month 4 along with interaction effects.
For the participants in the aerobic exercise groups, 85% of the participants completed 50% or more of the assigned exercise sessions, and almost one half of the participants (49%) completed 75% or more of the sessions. The analysis was repeated in participants with >75% aerobic exercise compliance (15 in diet and exercise arm and 13 in exercise alone arm). In general, the results were similar to the overall cohort with the exception of changes toward more pronounced beneficial effects in VO2 peak and F2-isoprostane concentrations with exercise intervention. Specifically, VO2 peak increased 2.4 ml/kg per minute over the study period, although none of the differences between groups reached statistical significance (P=0.15 for overall treatment effect versus usual care; P=0.25 for caloric restriction versus usual diet; P=0.13 for exercise versus usual activity). There was an overall statistically significant effect for decrease in F2-isoprostane concentrations with intervention (P=0.004 versus usual care). Exercise intervention decreased F2-isoprostane concentrations with a statistically significant effect (P<0.01 versus usual activity), whereas caloric restriction had a marginally statistically significant effect (P=0.05 versus usual diet) in patients with >75% aerobic exercise compliance.
For the participants in the caloric restriction groups, all of the participants completed 50% or more of the diet recalls, whereas almost one half of the participants (42%) completed all of the recalls. When dietary recall–based calorie intake was compared with assigned calorie level, there was excellent compliance. All participants were within 20% of their assigned calorie intake (mean 10% less than assigned level, range, 65%–34%) except one participant (34% above assigned level). Forty of 57 participants reported less than assigned calorie intake level on average.
Adverse Events
There were 30 adverse events, two hospitalizations, and no deaths during the study. The usual activity and usual diet group had three unrelated adverse events—one kidney infection, one pain related, and one dizziness episode. The usual activity and caloric restriction group had six adverse events—one related to the study (hypotension due to weight loss) and five unrelated adverse events (two foot pain/surgery, one syncope episode, one gout flare up, and one infection). The aerobic exercise and usual diet group had four adverse events—one possibly related (knee pain while exercising) and three unrelated (one diverticulitis flare with hospitalization, one back pain due to pinched disc, and one infection). The aerobic exercise and caloric restriction group had 17 adverse events—six related to the study (one rapid atrial fibrillation with hospitalization, two hypotension due to weight loss, one chest pain while exercising, one painful Achilles, and one joint pain while exercising), three possibly related to the study (hypotension), and eight unrelated (two hypertension, one hyperglycemia, one sciatica, one pulled muscle, one knee injury, one hand surgery, and one motor vehicle accident).
Discussion
In this randomized clinical trial performed in patients with moderate to severe CKD, we show that a 4-month trial of dietary calorie restriction and endurance exercise has statistically significant, albeit clinically modest, metabolic benefits. Specifically, dietary caloric restriction predominantly decreases weight and absolute fat mass, whereas aerobic exercise largely reduces oxidative stress and inflammatory response. Overall, these data indicate that healthy lifestyle interventions, combined or alone, represent an attractive nonpharmacologic strategy to improve metabolic health in patients with moderate to severe CKD.
Despite the demonstrated beneficial effects of dietary calorie restriction and aerobic exercise in multiple chronic disease states,6 there are sparse data from randomized trials in moderate to severe CKD.7 Several recent studies have suggested that exercise, as a part of intensive lifestyle intervention in patients with CKD stages 3 and 4, improves peak VO2,8 inflammatory response,9 physical function, and quality of life.10,11 Our study further confirms some, but not all, of these findings. Notably, VO2 peak did not significantly improve in patients randomized to aerobic exercise compared with patients who did not receive supervised exercise. This is also in contrast to data published in other chronic disease states. The explanation for this finding is not clear but could include a ceiling effect imposed by CKD in terms of VO2 peak. In addition, although an established metric in exercise physiology, VO2 has several limitations, including its low sensitivity at capturing mild to moderate improvements in actual physical performance. It is probable that a larger study could have detected significant differences between groups. It is also possible that, although VO2 peak has a ceiling in the setting of CKD, the exercise length could be improved in these patients, which should be examined in future studies.
A notable finding in our study was that exercise and diet, separately and in combination, had beneficial effects on markers of systemic inflammation and oxidative stress. Although these findings are consistent with previously published studies in other patient populations, this particular study is one of the few where markers of inflammation and oxidative stress improved simultaneously in patients with advanced kidney disease.12–14 Of note, the improvement in F2-isoprostane levels was more evident in our study participants who adhered to their exercise prescription by completing >75% of the required sessions.
We were also not able to show any decrease in body weight or fat mass in the groups assigned to exercise, whereas dietary calorie restriction was effective. This is not an unexpected finding, because exercise is known to improve appetite in certain individuals and in the absence of dietary restriction, could lead to weight gain.15 It is noteworthy that we saw favorable changes in markers of oxidative stress and inflammation, despite not seeing changes in weight with exercise intervention alone.
In patients with less severe CKD, the post hoc analysis of the Action for Health in Diabetes (Look AHEAD) Study suggested that intensive healthy lifestyle intervention, which included dietary calorie restriction and aerobic exercise combined, leads to a decreased incidence of progression to high-risk CKD (i.e., progressing to CKD stages 4 and 5) while not reporting any effects on the metabolic profile.16 This study suggests that the combination of aerobic exercise and dietary calorie restriction could be the most optimal strategy to improve the overall metabolic profile in patients with moderate to severe CKD. This combination approach led to benefits that include decreases in fat mass and inflammatory response as well as in oxidative stress markers. However, it should be noted that these are surrogate outcomes and that future studies examining these interventions should focus on more clinically relevant outcomes, such as physical functioning, progression of kidney disease, and cardiovascular events. Inclusion of patients with mild to moderate CKD in larger trials of more diverse populations could also allow investigation of benefits on mortality.
An important aim of our study was to assess feasibility of healthy lifestyle interventions in patients with CKD. We were able to achieve an acceptable level of caloric restriction as evidenced by a significant decrease in body weight and fat mass. Notably, all participants except one were within 20% of their assigned calorie intake, and 70% of participants ingested calories less than the assigned level. None of the participants withdrew from the study due to caloric restriction, and there were no safety concerns regarding electrolyte abnormalities, suggesting a satisfactory feasibility profile for diet interventions in CKD. However, the exercise intervention had more noticeable feasibility concerns, because 15% of the participants completed 50% or less of the assigned exercise sessions, whereas only slightly more than one half of the participants (53%) completed 75% or more of the sessions. The reasons for not being able to exercise include scheduling conflict, poor health, lack of transportation, forgetfulness, and unwillingness to exercise.
This study has several strengths. This is one of the largest randomized trials examining healthy lifestyle interventions in patients with CKD. Our patient population was reasonably reflective of the patient population with CKD, although the mean age was younger than the overall CKD population. The diet prescription was designed to decrease overall calories rather than have a specific nutrient intake, potentially allowing more acceptance by the patients. The exercise intervention was supervised by clinical exercise physiologists and personalized to the specific patient’s physiologic capability. We also selected well established surrogates of metabolic milieu in the setting of CKD.17 There are also several limitations. Our sample size was limited in terms of achieving clinically meaningful results regarding hard clinical outcomes, such as CKD progression or urinary albumin excretion. This was a pilot study intended to justify a larger, more comprehensive, and potentially pragmatic study. We report several primary outcomes that could be subject to multiple comparisons, with a maximum false discovery rate of 0.21 when declaring those five outcomes as significantly different. A false discovery rate of 0.21 is within reasonable range for a preliminary study. Our study duration was only 4 months, which limits the results in terms of assessing longer-term adherence and biologic effects. In conclusion, we have shown that a 4-month-long administration of caloric restriction and aerobic exercise leads to significant improvements in a number of metabolic parameters in patients with moderate to severe CKD. These data emphasize the importance and the need for future longer-term studies of healthy lifestyle interventions in this patient population in an effort to mitigate CKD progression and CVD risk.
Concise Methods
Study Design
This was a 2×2 factorial design, randomized, controlled study (NCT01150851). The study was approved by the institutional review boards at all participating sites. All participants provided written informed consent before study enrollment. Because of the nature of the interventions, the study was unblinded. After informed consent was obtained, participants were assigned to one of the study arms (Figure 1) using a permuted block randomization strategy in a 1:1 ratio. Subject groups were stratified according to site (Vanderbilt University Medical Center [VUMC], Veterans Affairs Tennessee Valley Healthcare System Nashville [VATVHS], University of Washington [UW], Providence Medical Research Center [PMRC], and Springfield) as well as by diabetes mellitus status.
Baseline enrollment data and blood work were obtained about 2 weeks before initiation of the 4-month intervention phase. Groups A and B were to restrict daily caloric intake by 10%–15%, whereas groups A and C were to exercise three times per week. Group D was to continue with usual physical activity levels and usual diet.
Participants
Participants were recruited from the VUMC, the VATVHS, the UW, the PMRC, and Renal and Transplant Associates of New England. Recruitment began in October of 2010, and the study was completed in February of 2014. Criteria for study participation included patients with CKD stages 3 and 4 measured by the creatinine-based Modification of Diet in Renal Disease (MDRD) equation with eGFR=15–60 ml/min per 1.73 m2, age 18–75 years old, BMI≥25, life expectancy ≥1 year, and the ability to understand and provide informed consent for participation in the study. Exclusion criteria included any acute inflammatory condition (including chronic infection requiring treatment and collagen vascular disease, including active gout); pregnancy; taking high-dose antioxidants (vitamin E or C); chronic use of anti-inflammatory medication, except low-dose (<10 mg/d) prednisone and aspirin (<100 mg/d); significant cardiac or vascular disease (symptomatic disease or CVD event, including congestive heart failure, within 6 months); significant occlusive atherosclerotic disease or ischemic disease (on noninvasive or invasive diagnostic procedures); significant physical immobility or disabilities (joint replacement or muscular disorders); type 1 diabetes mellitus or type 2 diabetes mellitus requiring insulin therapy; and history of poor adherence to medical regimen. Participants with a diagnosis of atrial fibrillation or a pacemaker were allowed in the study. Because direct supervision of exercise was a part of the protocol, a prescreening was performed, excluding all patients who live farther than a 20-mile radius from the exercise facilities. Notably, this geographic exclusion eliminated a substantial portion of otherwise eligible patients. Participants underwent study visits at baseline (before initiation of interventions) and then at 1, 2, and 4 months (end of study).
A total of 122 participants were consented, 111 were randomized, 104 started intervention, and 92 completed the study (Figure 1). There were 11 participants who failed screening (six declined to participate, three lived too far away, one was unable to exercise due to injury, and one did not meet inclusion/exclusion criteria). Of the 111 participants who were randomized and are included in the intention-to-treat analysis, 30 were in the aerobic exercise and caloric restriction group, 28 were in the usual activity and caloric restriction group, 27 were in the aerobic exercise and usual diet group, and 26 were in the usual activity and usual diet group. There were seven participants who withdrew before starting intervention; four were unable to continue to due to their medical condition, one was requested by their physician to not participate, one withdrew consent, and one was found to be actively dieting. There were 12 participants who withdrew after starting intervention (four were unable to continue due to their medical condition, four moved out of the area, two no longer wished to participate, one was requested by their physician to withdraw, and one had an extended hospitalization).
Methods
For all groups, anthropometric measurements (height, weight, BMI, and hip and abdominal waist circumference), vital signs (BP and pulse), medication review, standard of care dietary counseling, body composition measurements with dual energy x-ray absorptiometry (Lunar Prodigy iDEXA machine, v.11.40.004, software versions 2003–2011; General Electric, Madison, WI), and bioelectrical impendence analysis (Quantum III machine; RJL Systems, Clinton Township, MI) were performed. Dual energy x-ray absorptiometry was performed at baseline and 4 months, whereas bioelectrical impendence analysis was performed at all study visits. Resting energy expenditure assessments were made using a metabolic cart (Parvo Medics, Sandy, UT). VO2 peak (MedGraphics Ultima; Medical Graphics Corp., St. Paul, MN) was measured at baseline and 4 months to monitor changes in cardiorespiratory fitness. Nutritional, metabolic, oxidative stress, and inflammatory biomarkers were measured from blood and urine samples. Dietary recalls and questionnaires (analyzed using Nutrition Data System for Research software, University of Minnesota, Minneapolis, MN) were obtained to determine the dietary intake for participants.
Routine chemistries were obtained from the patient charts. Blood was drawn into Vacutainer (Becton-Dickinson, Franklin Lakes, NJ) tubes containing EDTA for plasma separation. Samples were transported on ice and immediately centrifuged at 20°C at 3000 rpm for 15 minutes. Supernatants were stored in aliquots at −80°C until further use. Blood sample measurements included high-sensitivity C-reactive protein, IL-6, and plasma F2-isoprostanes and isofurans at all study visits. High-sensitivity C-reactive protein concentrations were measured by high-sensitivity particle-enhanced turbidimetric UniCel DxI Immunoassay system (Beckman Coulter, Miami, FL). Plasma IL-6 levels were determined using cytometric bead arrays (Becton-Dickinson, San Jose, CA). Oxidative stress was quantified by simultaneous measurement of plasma F2-isoprostane and isofuran concentrations. Internal standard [2H4]-15-F2T-isoprostane was added to plasma, and the sample was purified by sequential C-18 and silica solid-phase extraction and then derivatized to pentafluorobenzyl ester, trimethylsilyl ether for gas chromatography/negative ion chemical ionization/mass spectrometry analysis.
We decided, before analysis, to evaluate eGFRcysC, because serum creatinine levels depend on muscle mass, which may be influenced by each of the interventions. Cystatin C concentrations were measured using a clinical chemistry analyzer (DxC600; Beckman Coulter). We standardized the DxC measurements by reconstituting the cystatin C reference material (ERM-DAY7/IFCC) per its certificate of analysis to yield a cystatin C concentration of 5.48 mg/L (uncertainty of 0.15 mg/L), and eGFRcysC was measured using the Chronic Kidney Disease Epidemiology Collaboration (CKD-EPI) equation.18
Standard of Care Dietary Counseling
All study participants were asked to avoid high-calorie meals rich in processed, easily digestible, quickly absorbable foods and drinks as a part of a CKD diet. All study participants received dietary recommendations that included large amounts of fresh unprocessed plant intake, with moderate levels of lean protein and fats, such as omega-3 and monounsaturated fats.
Caloric Restriction Intervention
For participants randomized to dietary caloric restriction, loss of 1 pound of body weight requires a negative caloric balance of 3500 calories. Thus, we estimated that restricting daily caloric intake by 10%–15% (assuming an average diet of 3000 kcal/d) would result in an estimated 300–500 kcal reduction per day, leading to 1 pound (restriction of 3500 kcal/wk) of weight loss per week, predominantly from body fat. We obtained dietary recalls before the initiation of the dietary regimen to screen for participants who had reduced daily caloric intake at baseline (≤2000 kcal/d), because dietary restriction in such participants can be potentially hazardous. Obese participants with substantially higher daily caloric intakes (≥4000 kcal average per day) had the same 10%–15% reduction of their daily energy consumption as obese participants with lower daily food intake.
Aerobic Exercise Intervention
Participants randomized to the low-impact aerobic exercise intervention were scheduled to perform physical activity for a maximum of 30–45 minutes three times per week for 4 months in duration. To offer variety in the exercise intervention, participants alternated aerobic exercise with the use of a treadmill, an elliptical crosstrainer, a Nu-Step crosstrainer, and a recumbent stationary bicycle. The net caloric expenditure per mile of walking at 3.5 mph is 0.77 kcal/kg per mile during moderate-paced walking. Thus, we estimated at least 200–300 kcal energy expenditure per mile during each exercise session in obese participants with CKD. We recognized that previously sedentary participants would have a lower degree of cardiorespiratory fitness at baseline. Thus, the exercise prescription was customized to reflect each subject’s individual baseline fitness status. The training intensity was individualized according to the initial physical fitness assessment and gradually increased throughout the study by certified exercise specialists and clinical exercise physiologists experienced in cardiopulmonary rehabilitation and exercise in participants with chronic diseases. We measured VO2 peak at study initiation and used this baseline value to monitor improvements in cardiorespiratory fitness over 4 months.19 The optimal range of training intensity associated with improvements of CKD is approximately 60%–80% VO2 Max.8 Therefore, the goal was for all participants to achieve an exercise intensity that represented 60%–80% VO2 peak. The rate of perceived exertion and metabolic equivalents were documented during the exercise sessions to track exercise progression and tolerance throughout the study. Participants were instructed to continue their usual or prescribed dietary regimen for the duration of the study.
Compliance
Protocol compliance at the sites was monitored in three ways. (1) Monthly conference calls were held with the principal investigators and study personnel from all participating sites. Agenda items included enrollment, protocol adherence, and adverse events. (2) Study personnel at each site entered case report forms into a REDCap database. Sites were queried for missing or questionable entries; all queries were resolved. (3) Participating sites submitted samples to either the VUMC or the UW for storage and subsequent analysis. The samples were double checked against the sample worksheets and entered into a sample log, and the samples were stored at −80°C. Sites were queried for missing samples or questionable labeling; all queries were resolved.
Diet compliance was assessed every 2 weeks through the collection and analysis of dietary recalls. For the participants in the caloric restriction groups, all of the participants completed 50% or more of the diet recalls, whereas almost one half of the participants (42%) completed all of the recalls. Exercise compliance was monitored and documented weekly, and it was submitted to study personnel for ongoing assessment of adherence and tolerance to the exercise regimen.
Outcomes and Measurements
The primary outcomes were baseline-adjusted absolute fat mass, lean body mass, VO2 peak, body weight, and plasma F2-isoprostane concentrations. A priori power analysis was on the basis of F2-isoprotanes. From our prospective observational cohort study of patients with CKD, we have measured plasma free F2-isoprostane concentrations of 81±49 pg/ml in 199 subjects. In studies of subjects with the metabolic syndrome or type 2 diabetes mellitus, healthy lifestyle intervention with diet and exercise has been reported to reduce F2-isoprostane concentrations by 50%–60% (J. Roberts et al., unpublished data). Assuming that there is no change in outcome in the control group and the same SD of 49 pg/ml at the end of study measurement, the power to detect a 55% within-group reduction with each healthy lifestyle intervention is 88% (expected difference of 45.4 pg/ml) with 32 subjects in each group with two-sided Bonferroni adjusted significance level of 0.0167. Exploratory outcomes presented herein include changes from baseline in IL-6, eGFR, and the urine albumin-to-creatinine ratio. Kidney function was estimated by the MDRD and CKD-EPI cystatin C–based equations.
Statistical Analyses
Baseline descriptive statistics, including demographics, medical history, and clinical, laboratory, and lifestyle characteristics were tabulated according to intervention arm for all participants randomized to an intervention. We report the median and first and third quartile values of continuous variables, and we report the distribution within categorical variables.
Primary analyses were performed on an intent-to-treat basis including all randomized participants, regardless of adherence or compliance status.20–22 All baseline covariate data were available; however, patients were omitted from specific analyses if they were missing the outcome of interest. The number of included subjects is reported for each analysis.
For each outcome, the effects of the intervention arms (over the usual diet and usual activity arm) were estimated with linear mixed effects regression models. For outcome measures that were only collected at baseline and month 4, the model included a fixed effect term for each active intervention arm, site, diabetic status, age, sex, and baseline values of the outcome. The model included random intercept terms for site and treatment arm. Both age and the baseline value were included in the model with a restricted cubic spline transformation to allow for potential nonlinear effects. The estimated effect of the active interventions (above usual diet and usual activity) is the coefficient corresponding to the intervention arm indicator variables; 95% confidence intervals were constructed with standard methods for linear mixed models.
For outcome measures that were collected at both months 2 and 4, we fit a model with the same fixed and random effects described above with the addition of an indicator variable for month, indicator variables for each active intervention crossed with the month 4 indicator variable, and subject-specific random intercepts. With the model constructed in this way, the estimate of the effect for the diet and exercise arm over the usual diet and usual activity arm, for example, is the sum of the two coefficients corresponding to the diet and exercise indicator variables. We constructed 95% confidence intervals of the estimated effects with standard, linear mixed model methods. P values were calculated with asymptotic Wald chi-squared statistics.
To examine the effect of compliance, a post hoc subgroup analysis excluded participants if they were not at least 75% compliant to their intervention. The same model fitting and hypothesis testing procedures implemented for the intent-to-treat population were implemented with the compliant subpopulation.
Statistical analyses were conducted with R, version 3.3.0 (R Foundation for Statistical Computing). The nominal level of significance was defined as P<0.05 (two sided).
Adverse Events
The safety profile of the study was overseen by a Data Safety Monitoring Board, and no interim efficacy analyses were planned or conducted.
Disclosures
None.
Supplementary Material
Acknowledgments
This study was in part supported by National Institutes of Health grants R01HL070938 from National Heart, Lung, and Blood Institute; K24DK62849, P30DK020593, and P30DK035816 from National Institute of Diabetes and Digestive and Kidney Diseases; P30ES000267 from the National Institute of Environmental Health Sciences; and Clinical Translational Science Awards UL1-TR000445 and UL1TR000423 from the National Center for Advancing Translational Sciences.
The funding agencies had no involvement with the design, implementation, analysis, and interpretation of the study.
Footnotes
Published online ahead of print. Publication date available at www.jasn.org.
This article contains supplemental material online at http://jasn.asnjournals.org/lookup/suppl/doi:10.1681/ASN.2017010020/-/DCSupplemental.
References
- 1.Stenvinkel P, Zoccali C, Ikizler TA: Obesity in CKD--what should nephrologists know? J Am Soc Nephrol 24: 1727–1736, 2013 [DOI] [PMC free article] [PubMed] [Google Scholar]
- 2.Himmelfarb J, Stenvinkel P, Ikizler TA, Hakim RM: The elephant in uremia: Oxidant stress as a unifying concept of cardiovascular disease in uremia. Kidney Int 62: 1524–1538, 2002 [DOI] [PubMed] [Google Scholar]
- 3.Ramos LF, Shintani A, Ikizler TA, Himmelfarb J: Oxidative stress and inflammation are associated with adiposity in moderate to severe CKD. J Am Soc Nephrol 19: 593–599, 2008 [DOI] [PMC free article] [PubMed] [Google Scholar]
- 4.Pavlou KN, Krey S, Steffee WP: Exercise as an adjunct to weight loss and maintenance in moderately obese subjects. Am J Clin Nutr 49[Suppl]: 1115–1123, 1989 [DOI] [PubMed] [Google Scholar]
- 5.Dandona P, Mohanty P, Ghanim H, Aljada A, Browne R, Hamouda W, Prabhala A, Afzal A, Garg R: The suppressive effect of dietary restriction and weight loss in the obese on the generation of reactive oxygen species by leukocytes, lipid peroxidation, and protein carbonylation. J Clin Endocrinol Metab 86: 355–362, 2001 [DOI] [PubMed] [Google Scholar]
- 6.Wing RR; Look AHEAD Research Group : Long-term effects of a lifestyle intervention on weight and cardiovascular risk factors in individuals with type 2 diabetes mellitus: Four-year results of the Look AHEAD trial. Arch Intern Med 170: 1566–1575, 2010 [DOI] [PMC free article] [PubMed] [Google Scholar]
- 7.Gould DW, Graham-Brown MP, Watson EL, Viana JL, Smith AC: Physiological benefits of exercise in pre-dialysis chronic kidney disease. Nephrology (Carlton) 19: 519–527, 2014 [DOI] [PubMed] [Google Scholar]
- 8.Headley S, Germain M, Wood R, Joubert J, Milch C, Evans E, Poindexter A, Cornelius A, Brewer B, Pescatello LS, Parker B: Short-term aerobic exercise and vascular function in CKD stage 3: A randomized controlled trial. Am J Kidney Dis 64: 222–229, 2014 [DOI] [PMC free article] [PubMed] [Google Scholar]
- 9.Viana JL, Kosmadakis GC, Watson EL, Bevington A, Feehally J, Bishop NC, Smith AC: Evidence for anti-inflammatory effects of exercise in CKD. J Am Soc Nephrol 25: 2121–2130, 2014 [DOI] [PMC free article] [PubMed] [Google Scholar]
- 10.Chen JL, Godfrey S, Ng TT, Moorthi R, Liangos O, Ruthazer R, Jaber BL, Levey AS, Castaneda-Sceppa C: Effect of intra-dialytic, low-intensity strength training on functional capacity in adult haemodialysis patients: A randomized pilot trial. Nephrol Dial Transplant 25: 1936–1943, 2010 [DOI] [PMC free article] [PubMed] [Google Scholar]
- 11.Song WJ, Sohng KY: Effects of progressive resistance training on body composition, physical fitness and quality of life of patients on hemodialysis. J Korean Acad Nurs 42: 947–956, 2012 [DOI] [PubMed] [Google Scholar]
- 12.de Sousa CV, Sales MM, Rosa TS, Lewis JE, de Andrade RV, Simões HG: The antioxidant effect of exercise: A systematic review and meta-analysis. Sports Med 47: 277–293, 2017 [DOI] [PubMed] [Google Scholar]
- 13.Ramos LF, Kane J, McMonagle E, Le P, Wu P, Shintani A, Ikizler TA, Himmelfarb J: Effects of combination tocopherols and alpha lipoic acid therapy on oxidative stress and inflammatory biomarkers in chronic kidney disease. J Ren Nutr 21: 211–218, 2011 [DOI] [PMC free article] [PubMed] [Google Scholar]
- 14.Himmelfarb J, Ikizler TA, Ellis C, Wu P, Shintani A, Dalal S, Kaplan M, Chonchol M, Hakim RM: Provision of antioxidant therapy in hemodialysis (PATH): A randomized clinical trial. J Am Soc Nephrol 25: 623–633, 2014 [DOI] [PMC free article] [PubMed] [Google Scholar]
- 15.Blundell JE, Gibbons C, Caudwell P, Finlayson G, Hopkins M: Appetite control and energy balance: Impact of exercise. Obes Rev 16[Suppl 1]: 67–76, 2015 [DOI] [PubMed] [Google Scholar]
- 16.Look AHEAD Research Group : Effect of a long-term behavioural weight loss intervention on nephropathy in overweight or obese adults with type 2 diabetes: A secondary analysis of the Look AHEAD randomised clinical trial. Lancet Diabetes Endocrinol 2: 801–809, 2014 [DOI] [PMC free article] [PubMed] [Google Scholar]
- 17.Oberg BP, McMenamin E, Lucas FL, McMonagle E, Morrow J, Ikizler TA, Himmelfarb J: Increased prevalence of oxidant stress and inflammation in patients with moderate to severe chronic kidney disease. Kidney Int 65: 1009–1016, 2004 [DOI] [PubMed] [Google Scholar]
- 18.Inker LA, Schmid CH, Tighiouart H, Eckfeldt JH, Feldman HI, Greene T, Kusek JW, Manzi J, Van Lente F, Zhang YL, Coresh J, Levey AS; CKD-EPI Investigators : Estimating glomerular filtration rate from serum creatinine and cystatin C. N Engl J Med 367: 20–29, 2012 [DOI] [PMC free article] [PubMed] [Google Scholar]
- 19.Midgley AW, McNaughton LR, Polman R, Marchant D: Criteria for determination of maximal oxygen uptake: A brief critique and recommendations for future research. Sports Med 37: 1019–1028, 2007 [DOI] [PubMed] [Google Scholar]
- 20.Sterne JA, White IR, Carlin JB, Spratt M, Royston P, Kenward MG, Wood AM, Carpenter JR: Multiple imputation for missing data in epidemiological and clinical research: potential and pitfalls. BMJ 338: b2393, 2009 [DOI] [PMC free article] [PubMed] [Google Scholar]
- 21.Sterne JA, White IR, Carlin JB, Spratt M, Royston P, Kenward MG, Wood AM, Carpenter JR: Multiple imputation for missing data in epidemiological and clinical research: Potential and pitfalls. BMJ 338: b2393, 2009 [DOI] [PMC free article] [PubMed] [Google Scholar]
- 22.Rubin DB: Multiple Imputation for Nonresponse in Surveys, New York, Wiley, 1987 [Google Scholar]
Associated Data
This section collects any data citations, data availability statements, or supplementary materials included in this article.


