

Abstract
Mutation is the source of genetic variation and fuels biological evolution. Many mutations first arise as DNA replication errors. These errors subsequently evade correction by cellular DNA repair, for example, by the well-known DNA mismatch repair (MMR) mechanism. Here, we determine the genome-wide effects of MMR on mutation. We first identify almost 9000 mutations accumulated over five generations in eight MMR-deficient mutation accumulation (MA) lines of the model plant species, Arabidopsis thaliana. We then show that MMR deficiency greatly increases the frequency of both smaller-scale insertions and deletions (indels) and of single-nucleotide variant (SNV) mutations. Most indels involve A or T nucleotides and occur preferentially in homopolymeric (poly A or poly T) genomic stretches. In addition, we find that the likelihood of occurrence of indels in homopolymeric stretches is strongly related to stretch length, and that this relationship causes ultrahigh localized mutation rates in specific homopolymeric stretch regions. For SNVs, we show that MMR deficiency both increases their frequency and changes their molecular mutational spectrum, causing further enhancement of the GC to AT bias characteristic of organisms with normal MMR function. Our final genome-wide analyses show that MMR deficiency disproportionately increases the numbers of SNVs in genes, rather than in nongenic regions of the genome. This latter observation indicates that MMR preferentially protects genes from mutation and has important consequences for understanding the evolution of genomes during both natural selection and human tumor growth.
Spontaneous mutation is the source of the genetic variation that enables the biological evolution of organisms. Spontaneous mutations may have deleterious, neutral, or advantageous effects on the relative selective fitness of organisms, and precise knowledge of mutational rates, molecular classes, and genomic distributions is essential if we are to understand how evolution works. However, until recently, knowledge of mutational processes was obscured by the difficulties inherent in observing sufficient numbers of mutations to be able to meaningfully discern their rates, patterns, and distributions throughout the genome.
Most spontaneous mutations likely arise from errors of DNA replication (Kunz et al. 1998; Stuart et al. 2000). Eukaryotic organisms have evolved sequential processes for enhancing the accurate replication of the genome and for repairing DNA replication errors. First, most DNA-replicating DNA polymerase enzyme activities strongly disfavor mismatch formation. Second, the few mismatches that do occur are corrected by the proofreading function of the polymerase during replication. Third, the tiny minority of mismatches that escape proofreading are repaired by the mismatch repair (MMR) mechanism (Kunkel and Erie 2015). The majority of spontaneous mutations are therefore thought to be replication errors that have evaded these sequential repair mechanisms. As expected, MMR-deficient mutant organisms exhibit elevated mutation rates (e.g., Schaaper 1993; Earley and Crouse 1998; Buermeyer et al. 1999; Harfe and Jinks-Robertson 2000a; Hoffman et al. 2004). However, until recently, even this elevated rate was insufficient to generate enough mutations for robust determination of the frequencies, molecular spectra, and genomic distribution patterns of spontaneous mutations in MMR-deficient organisms.
Many previous studies have used mutation accumulation (MA) lines to study spontaneous mutations in diverse species (e.g., Baer et al. 2005; Haag-Liautard et al. 2007; Keightley et al. 2009; Ossowski et al. 2010; Denver et al. 2012; Ness et al. 2012; Rutter et al. 2012; Zhu et al. 2014). Here, we combine use of MA lines with whole-genome sequencing (WGS) to analyze spontaneous mutations arising in the genomes of MMR-deficient Arabidopsis thaliana plants. These MA lines were propagated via single-seed descent, allowing the accumulation of spontaneous mutations generation by generation. Because each line passes through a tight (single-seed) bottleneck at each generation, only strongly deleterious mutations are lost, whereas others (weakly deleterious, neutral and advantageous) accumulate over time. Our study enabled the capture, to our knowledge, of the most mutations so far analyzed in MMR-deficient organisms. Our resulting analyses enabled us to advance understanding of the process of spontaneous mutation and of the roles played by MMR in reducing spontaneous mutation rates.
Results
Whole-genome sequencing of MMR-deficient Atmsh2-1 MA lines and overview of detected mutations
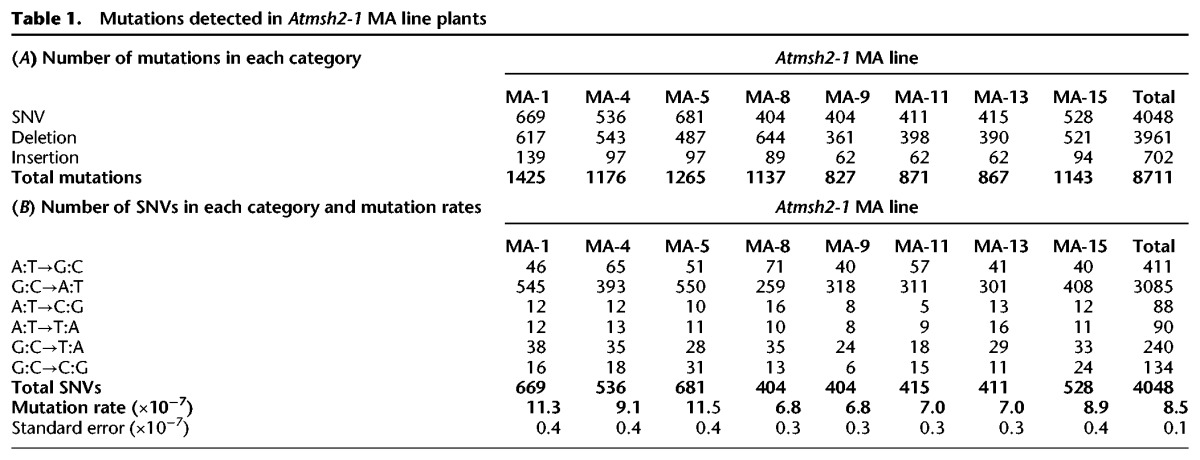
The A. thaliana Atmsh2-1 mutant is MMR-deficient (Hoffman et al. 2004). We first used Atmsh2-1 to establish multiple independent MMR-deficient A. thaliana MA lines. In brief, eight independent Atmsh2-1 MA lines were selected for further analysis (Fig. 1A; Methods; Supplemental Methods). We then compared mutations accumulated in the genomes of MA lines homozygous for the wild-type (WT) AtMSH2 allele with those accumulated in the genomes of these eight initially isogenic Atmsh2-1 MA lines (Methods; Supplemental Methods). WGS was performed on genomic DNA extracted from the single generation 0 (G0) Atmsh2-1 Ancestor plant (Fig. 1A) and from single generation 5 (G5) plants from the eight Atmsh2-1 MA lines shown in Supplemental Table 1 (Methods; Supplemental Methods). At least 3 Gb of 125-bp paired-end Illumina sequencing reads were generated for each genomic DNA sample, equating to 27.7–27.8 million raw sequencing reads per sample. Following alignment to the TAIR10 Arabidopsis thaliana reference genome sequence (Methods; Supplemental Methods), we obtained between 23.3- and 26.0-fold aligned coverage for each sample, with 117.6–118.7 million sites from the 119.1 million bp reference genome passing the quality requirements in each sample (Supplemental Table 1). Using previously described computational mutation-detection methods (Belfield et al. 2012; Jiang et al. 2014), we identified a total of 8711 new homozygous mutations in the G5 Atmsh2-1 MA line genomes (Table 1A; Fig. 1B; Methods; Supplemental Methods). These new mutations were not present in the G0 Atmsh2-1 Ancestor genome (in either heterozygous or homozygous state) and had therefore arisen during the five generations of propagation of the G5 Atmsh2-1 MA lines. Among these 8711 new mutations, 3961 were small-scale deletions (a maximum of 5 bp), 702 were small-scale insertions (a maximum of 3 bp), and 4048 were single-nucleotide variants (single-nucleotide substitution variants; SNVs) (Fig. 1B). Thus, SNVs (46.5%) were the most frequent mutation in the MMR-deficient MA lines, closely followed by deletions (45.5%), with insertions being relatively infrequent (8.1%), and deletions being approximately sixfold more frequent than insertions. The frequencies of insertion, deletion, and SNV mutations did not obviously differ between the eight Atmsh2-1 MA lines or between each of the 5 A. thaliana chromosomes (Table 1A; Supplemental Fig. 1).
Figure 1.
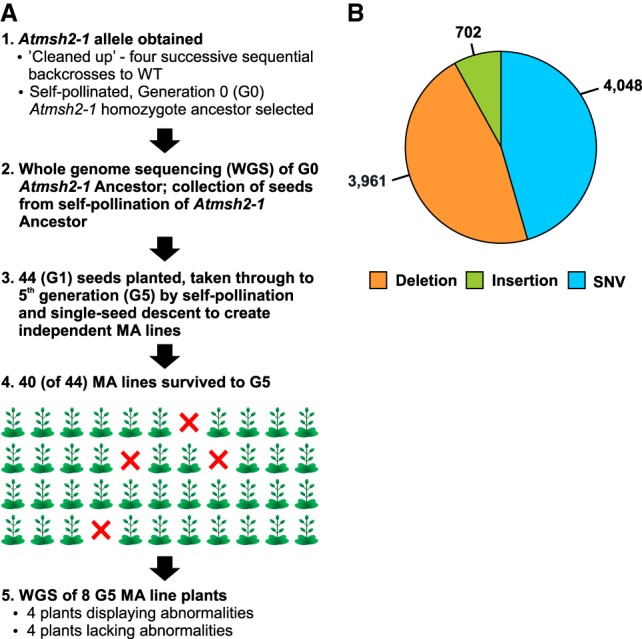
Establishment of MMR-deficient A. thaliana mutation accumulation (MA) lines and overview of mutations identified. (A) Steps in the generation of MA lines: (1) preparation of Generation 0 (G0) Atmsh2-1 Ancestor; (2) determination of Atmsh2-1 Ancestor whole-genome sequence; (3) creation of independent MA lines by self-pollination of Atmsh2-1 Ancestor and subsequent single-seed descent; (4) recovery of 40 fifth generation (G5) MA line plants; and (5) determination of whole-genome sequence of eight G5 MA line plant samples. (B) Overview of total mutations accumulated in all eight G5 Atmsh2-1 MA line plant samples. Deletions are 1–5 bp in size; insertions are 1–3 bp in size; SNVs are single-nucleotide variants (single-nucleotide substitutions).
Table 1.
Mutations detected in Atmsh2-1 MA line plants
Because our bioinformatics approaches had detected no new insertions/deletions (indels) ≥5 bp, we validated our findings using the independent GATK HaplotypeCaller (Van der Auwera et al. 2013; Methods; Supplemental Methods). This independent analysis confirmed the absence of any large indels of ≥5 bp. In addition, because our use of average data coverage analysis methods revealed no detectable large-scale copy number variants (CNVs; minimum length 1000 bp) (Methods; Supplemental Methods), we conclude that the vast majority of the mutations accumulating in MMR-deficient A. thaliana are SNVs and small-scale indels of sizes as defined above.
MMR deficiency confers a >1000-fold increase in the frequency of small-scale indel mutations
We next found that the frequencies of new indel mutations in G5 Atmsh2-1 MA line samples was more than three orders of magnitude greater than in WT controls (116.6 mutations per Atmsh2-1 MA line per generation versus 0.08 or 0.11 in WT lines, Jiang et al. 2014 and Ossowski et al. 2010, respectively) (Fig. 2A; Supplemental Methods). The vast majority of indels affected only single bases (95.4%; 4447 of 4663 total indels) (Fig. 2B,C), with 1-bp deletions being the most frequent (81.9%; 3817 of 4663) (Fig. 2B). Larger deletions (2–5 bp) became progressively less frequent with increasing deletion size (Fig. 2B). The largest indel observed was a single 5-bp deletion (Fig. 2B). Similarly, 1-bp insertion mutations were the most frequent insertion mutation (89.7%; 630 of all 702 insertions) (Fig. 2C) and, along with 2-bp insertions, accounted for 99.4% of total insertions observed (Fig. 2C).
Figure 2.

Characterization of indel mutations in MMR-deficient A. thaliana. (A) Frequency of indels (insertions and deletions) in G5 Atmsh2-1 MA line samples compared with that in wild-type (WT) controls (WT1 data from Ossowski et al. 2010; WT2 data from Jiang et al. 2014). Error bars indicate SEM (too small to be clearly visible in WT1 and WT2). (B,C) Length distributions (in bps) of indels in G5 Atmsh2-1 MA line samples: (B) deletions; (C) insertions. (D) Comparison of different classes of 1- and 2-bp indels accumulated in G5 Atmsh2-1 MA line samples. (E,F) Frequency of single-base A or T deletions (E) or A or T insertions (F) in different length categories of homopolymeric A or T repeat regions (values normalized by the number of each length category of homopolymeric A or T repeat region in the A. thaliana genome) (Supplemental Fig. 2A,B). Dotted lines indicate moving average trends. (G) Genomic distribution of indels in G5 Atmsh2-1 MA line samples. (CDS) coding sequence; (UTR) untranslated region; (TE) transposable element; (Other) noncoding RNAs and pseudogenes. Error bars in E–G indicate SEM (from eight different Atmsh2-1 MA biological replicates) (Supplemental Table 4).
Of all indels identified in Atmsh2-1 MA lines, most (95.8%, 4466 of 4663) involved A or T nucleotides, either as A or T mononucleotides (1-bp indels), or as AA or TT dinucleotides (2-bp indels) (Fig. 2D). In addition, most indels were located predominantly within homopolymeric repeat sequences. For example, of the 4663 indels identified, 1924 (∼100% of total 1925) 1-bp A deletions were in homopolymeric A stretches (AAAA, etc.) of ≥4-bp length, and 1847 (∼100% of total 1850) 1-bp T deletions were in homopolymeric T stretches of ≥4-bp length. In addition, 313 (of total 314) 1-bp A insertions were in homopolymeric A stretches of ≥4-bp length, whereas 284 (of total 287) 1-bp T insertions were in homopolymeric T stretches of ≥4-bp length. Similarly, with respect to dinucleotide indels, 44 (of total 44) AA deletions were in homopolymeric A stretches of ≥4-bp length, and 35 (of total 35) TT deletions were in homopolymeric T stretches of ≥4-bp length. Thus, the genomes of MMR-deficient A. thaliana plants are particularly prone to the accumulation of indel mutations in homopolymeric A or T repeat sequence regions.
Indel incidence in MMR-deficient plants displays a bell-shaped curve relationship with homopolymeric region length
We also found that the likelihood of an indel mutation occurring within a homopolymeric repeat region in MMR-deficient plants is related to the length of that region (for homopolymer repeat region length distributions for the A. thaliana genome, see Supplemental Fig. 2A,B; see also Fig. 2E,F; Supplemental Fig. 2C–E). In particular, the frequencies of single-base A and T indels found in homopolymeric repeat regions display a bell-shaped distribution curve with respect to repeat region length (Fig. 2E,F). These frequencies rise with increasing mononucleotide repeat sequence length, peak at lengths of ∼11–13 nt, and then fall with further increases in repeat sequence length (Fig. 2E,F). We also obtained independent visual validation of these bell-shaped distributions using Integrative Genomics Viewer (IGV) (Robinson et al. 2011; Supplemental Methods). In consequence of these observations, single-base A or T deletions are particularly likely to occur in lengths of 11–14 bp homopolymeric A or T repeat sequence regions, whereas single-base A or T insertions are particularly likely to occur in lengths of 10–15 bp homopolymeric A or T repeat sequence regions (for normalized data, see Fig. 2E,F; for non-normalized data, see Supplemental Fig. 2D,E). In addition, 2-bp A or T (AA or TT) dinucleotide deletions were also found to be located primarily in longer homopolymeric A or T repeat sequence regions (13–15 bp) (Supplemental Fig. 2C).
Single-base C or G indels occurred much less frequently than single-base A or T indels and accounted for only ∼1.5% of the total indels (71 of 4663) (Fig. 2D) detected in G5 Atmsh2-1 MA lines. As with single-base A or T indels, a disproportionate number of single-base C or G indels were located within homopolymeric stretches (Supplemental Fig. 3A–D). For example, 83% (59 of 71) of all single-base C or G indels (32 deletions and 27 insertions) were in homopolymeric C or G stretches of ≥4-bp length. However, the distribution of frequencies of single-base C or G indels in homopolymeric repeat regions, unlike that for single-base A or T indels (Fig. 2E,F), was not obviously bell-shaped (Supplemental Fig. 3C,D), although this may have been because of the relative infrequency of these types of mutation.
Homopolymeric repeat sequences are mainly located in the noncoding DNA of the A. thaliana genome. We therefore determined the genomic distribution of indels identified in G5 Atmsh2-1 MA line samples. Accordingly, indels were found to be most frequent in noncoding regions of the genome, to be especially prevalent in intergenic regions (67%) and in introns (18%), and to be less so in protein-encoding sequences (∼2% in coding sequence [CDS]) (Fig. 2G).
MMR deficiency confers a ∼170-fold increase in the frequency of single-nucleotide variant (SNV) mutations
We identified 4048 new SNVs in the eight G5 MMR-deficient Atmsh2-1 MA line sample plants (Table 1A; Fig. 1B). SNVs were the largest single category of mutations, i.e., 46.5% versus 45.5% (3961) deletions and 8.1% (702) insertions (Fig. 1B). We estimated an overall MMR-deficient A. thaliana SNV mutation rate of 8.5 × 10⁻⁷ per site per generation (Table 1B; Supplemental Methods), although this may be an underestimate due to the limited number of MA line generations (Hoffman et al. 2004; Ossowski et al. 2010; Jiang et al. 2014). Nevertheless, this estimated MMR-deficient SNV mutation rate is between 132- and 204-fold higher than rates observed in MMR-proficient A. thaliana MA lines, that is, 6.5 × 10⁻⁹ (Ossowski et al. 2010) and 4.2 × 10⁻⁹ (Jiang et al. 2014), and indicates that MMR plays a major role in maintaining A. thaliana genome integrity.
Previous studies have shown that mutations arising in WT Arabidopsis MA lines exhibit a GC-to-AT mutation bias and consequently have a higher than expected (by chance) transition/transversion (Ti/Tv) ratio of 2.4–2.7 (Fig. 3A; Ossowski et al. 2010; Jiang et al. 2014). Our observations indicate that this mutational bias is enhanced by MMR deficiency, with the overall rate of transitions (GC-to-AT and AT-to-GC) increasing from 73.2% in WT MA lines (Ossowski et al. 2010) to 87.5% in Atmsh2-1 MA lines (Fig. 3B). This is due to a ∼16% higher preponderance of GC-to-AT mutations in MMR-deficient Atmsh2-1 MA lines (81.4%) versus those in MMR-proficient WT MA lines (65.5%) (Ossowski et al. 2010). In consequence, the Ti/Tv ratio rises to about 7.0 in MMR-deficient Atmsh2-1 MA lines (Fig. 3C), 2.6-fold higher than is observed in MMR-proficient WT MA lines (Fig. 3A; Ossowski et al. 2010).
Figure 3.
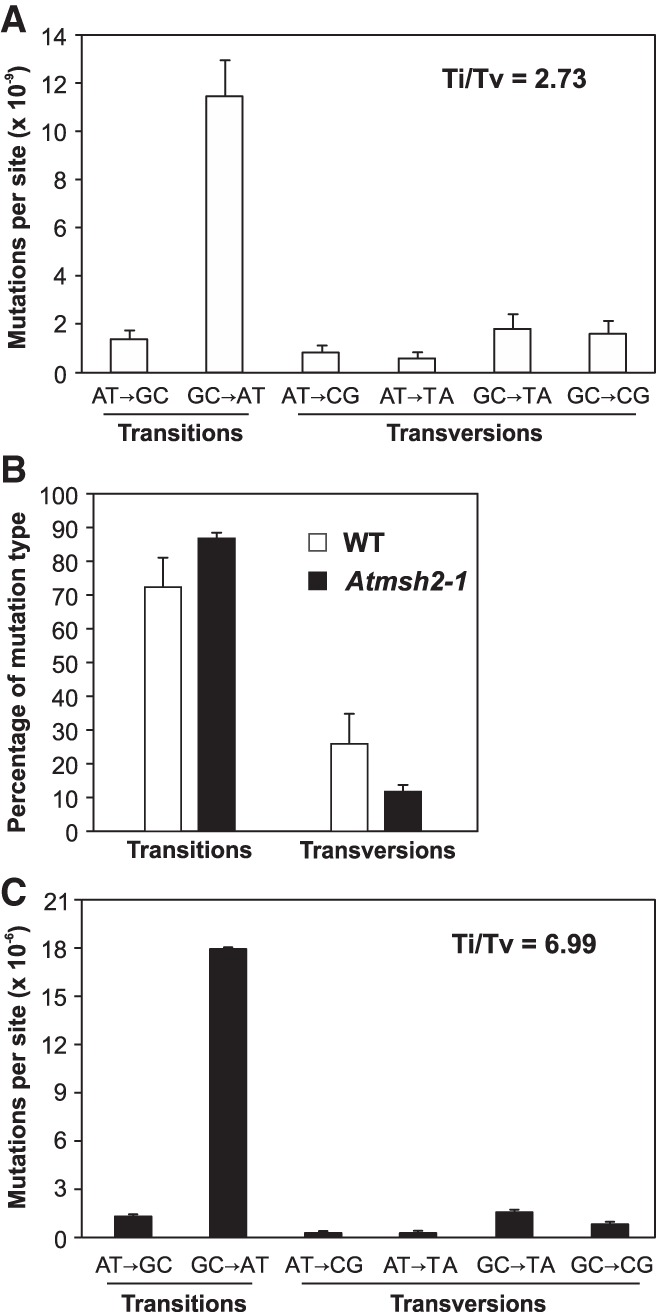
Comparisons of SNV mutational spectra in WT and MMR-deficient A. thaliana. (A) Mutation spectrum and Ti/Tv ratio in MMR-proficient WT MA lines (data from Ossowski et al. 2010). (B) Relative percentage of transitions versus transversions in G5 Atmsh2-1 MA line plants versus that seen in MMR-proficient WT MA lines (WT data from Ossowski et al. 2010). (C) Mutation spectrum and Ti/Tv ratio of SNVs detected in MMR-deficient G5 Atmsh2-1 MA line plants. Error bars (A–C) indicate SEM from five (WT data) or eight (MMR-deficient data) biological replicates (in some cases, too small to be clearly visible).
SNVs occur preferentially in particular sequence contexts in MMR-deficient A. thaliana
Using motif-detection algorithms, we next determined if SNVs accumulating in MMR-deficient MA lines occur in preferred sequence contexts. Taking all GC-to-AT transitions (81.4% of MMR-deficient SNVs) (Fig. 3B,C), we first determined that there was no asymmetry between the flanking sequences (−10 bp to −1 bp and +1 bp to +10 bp) of C-to-T and reverse complemented G-to-A transition sites (P-values ranging from 0.74–1, χ2 test). Next, we compared the distribution of bases flanking all C-to-T transition sites (and flanking all reverse complemented G-to-A to C-to-T transition sites) to the distribution of bases flanking all C sites (and the reverse complement G sites) in TAIR10. In brief, we extracted from TAIR10 the −10 bp and +10 bp DNA sequences flanking each of the 1470 C residues (total C-to-T transition sites) and 1807 G residues (total G-to-A transition sites reverse complemented to C-to-T sites) at which transition mutations were detected (Fig. 4A). The positional flanking nucleotide residue distributions thus obtained for these transition mutation sites were then compared with the equivalent distributions for all C and all reverse complemented G sites in the TAIR10 A. thaliana genome (Fig. 4B). This comparison revealed strong enrichment for A (47% versus the expected 29%) and G (36% versus the expected 17%) residues immediately 5′ to the mutated C (P-value = 0, χ2 test) (Fig. 4A,B). An additional significant, although smaller, enrichment for A (41% versus the expected 35%) and G (19% versus the expected 13%) residues immediately 3′ to the mutated C was also detected (P-value <1.6 × 10⁻¹⁶, χ2 test) (Fig. 4A,B). Thus, the most frequent SNVs (GC-to-AT transitions) in MMR-defective A. thaliana are more prevalent in some flanking sequence contexts than in others.
Figure 4.
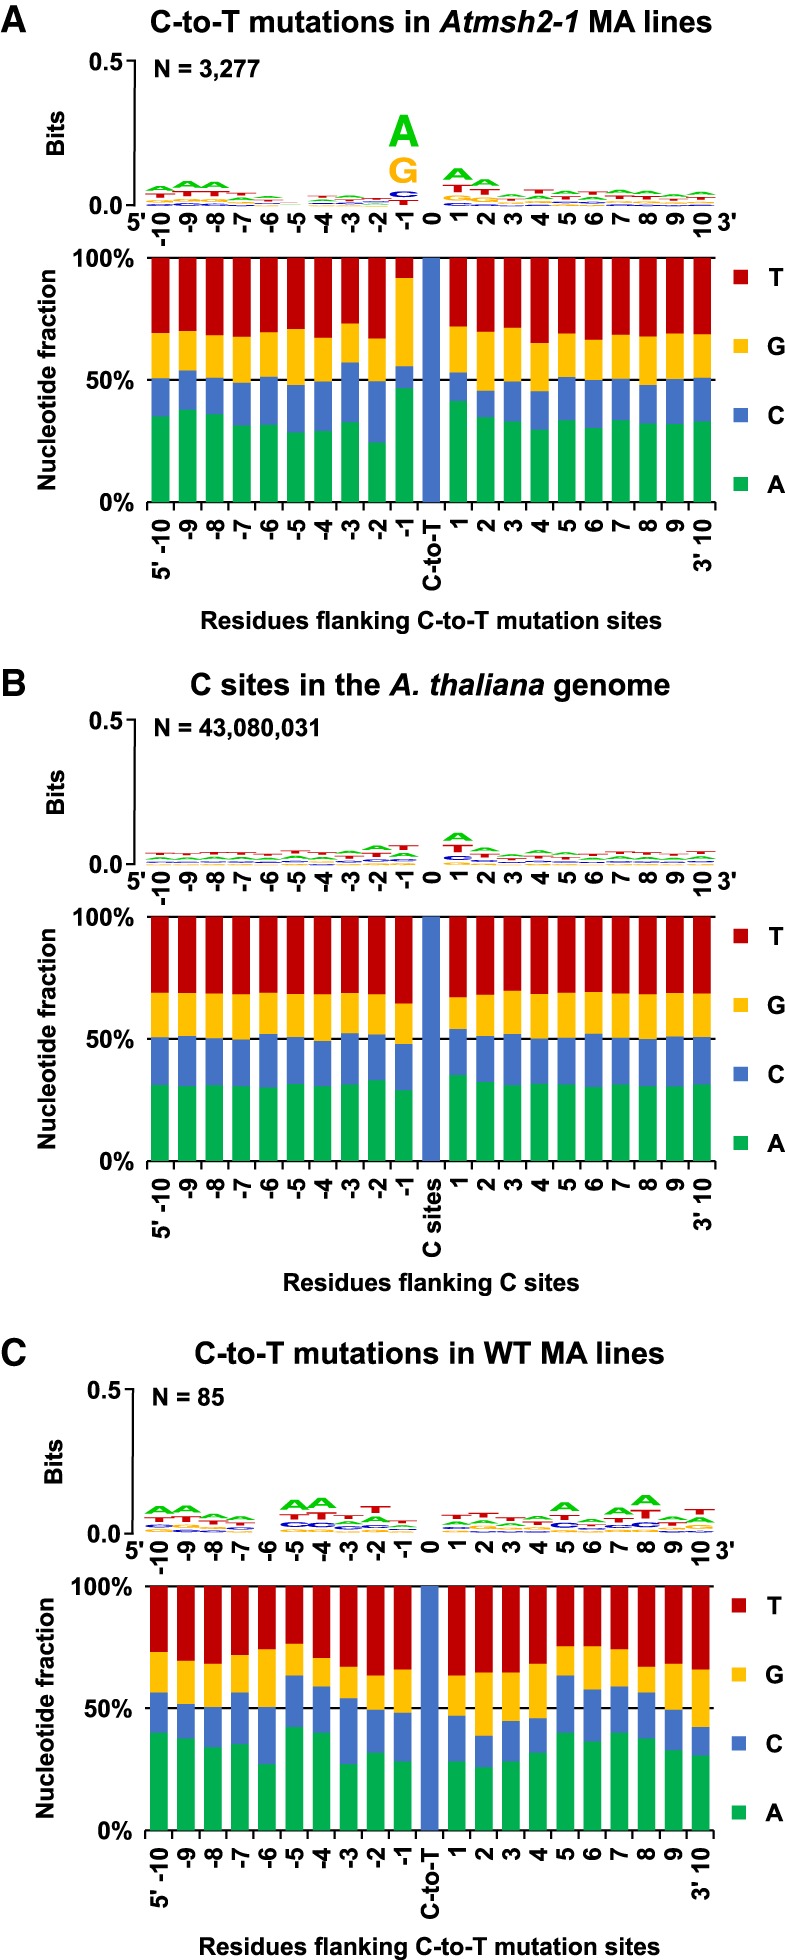
Flanking sequence bias at SNV sites in MMR-deficient A. thaliana. Nucleotide flanking sequences 10 bases upstream (5′) and downstream (3′) from each mutated site are shown as stacked columns and sequence logos (Schneider and Stephens 1990; Crooks et al. 2004). (A) Combined 1470 C-to-T and 1807 reverse complemented G-to-A to C-to-T mutations in G5 Atmsh2-1 MA line samples. (B) The haploid flanking sequence composition for all C and reverse complemented G sites in the TAIR10 A. thaliana reference genome. (C) The combined flanking sequences at sites of spontaneous C-to-T and reverse complemented G-to-A to C-to-T transition site mutations identified in WT (MMR-proficient) A. thaliana MA lines (Ossowski et al. 2010; Jiang et al. 2014). Sequence logos showing graphical representations of the relative frequencies of individual nucleotide residues with respect to position within the flanking sequences are shown as stacked letters, along with the number of sites (combined C and reverse complemented G-to-A to C-to-T sites) considered (shown as N). The letters in each stack are ordered from most (top) to least (bottom) frequent. The overall height of each stack indicates the sequence conservation at that position (measured in bits), whereas the height of each letter within the stack indicates the relative frequency of each nucleotide (A, T, C, or G) at that position (Crooks et al. 2004).
Interestingly, these sequence context biases for SNVs in MMR-defective MA lines are not as prominent for SNVs in WT MMR-proficient MA lines. We assayed the flanking sequence of 85 GC-to-AT mutations identified in WT MA lines: 47 from Ossowski et al. (2010), and 38 from Jiang et al. (2014). The flanking sequences immediately 5′ and 3′ of the GC-to-AT mutation sites in WT MA lines do not exhibit significant residue enrichment (P-values >0.1, Fisher's exact test) (Fig. 4C). The possible significance of these observations is discussed subsequently (Discussion).
Localized microclustering of new mutations in MMR-deficient lines is relatively rare
We next sought to determine if we could detect deviations of mutation distribution from the null hypothesis expectation of random distribution throughout the genome, focusing first on the possibility of localized microclustering of mutations. Essentially, we determined whether the mutations detected in the eight MMR-deficient MA lines were all random independent events or, alternatively, if there was any evidence of nonrandom spatial clustering (for details, see Supplemental Methods). Although we found evidence supporting the relatively infrequent occurrence of genomic regional clustering of mutations, we concluded that the genomic distribution of the vast majority of mutations in MMR-deficient MA lines is not detectably different from the random expectation when assayed by clustering analysis.
MMR deficiency reduces disparities between pericentromeric and nonpericentromeric chromosomal regional mutation rates
We next examined the chromosomal distribution of SNVs and indels in MMR-deficient plants. A previous study suggests that the SNV mutation rate is higher in pericentromeric (e.g., within ∼3.0 × 10⁶ bp of each centromere) than in nonpericentromeric chromosomal regions, with 44.1% more SNVs in pericentromeric (versus nonpericentromeric) WT chromosomal regions (1.147 versus 0.796 SNVs/Mb, respectively) (Ossowski et al. 2010). Thus, in WT plants, mutations appear to be unevenly spread within chromosomes. In contrast, we found only 5.9% more SNVs in pericentromeric (versus nonpericentromeric) chromosomal regions of Atmsh2-1 MA lines (35.7 versus 33.7 SNVs/Mb, respectively). Thus, MMR deficiency significantly reduces the difference between the relative proportions of SNVs in pericentromeric versus nonpericentromeric chromosomal regions (P-value 5.2 × 10⁻¹², χ2 test).
We next discovered additional disparities between the relative proportions of indels in pericentromeric versus nonpericentromeric chromosomal regions. In WT plants, and in contrast to the relative distribution of SNVs, indels are more frequent in nonpericentromeric than in pericentromeric chromosomal regions (136.0% more indels in nonpericentromeric versus pericentromeric regions; 0.157 versus 0.067 indels/Mb, respectively). However, in MMR-deficient Atmsh2-1 MA lines, there are only 80.2% more indels in nonpericentromeric regions versus pericentromeric regions (41.2 versus 22.9 indels/Mb, respectively; P-value 4.3 × 10⁻⁵, χ2 test). We conclude that MMR deficiency reduces the disparities in incidence of SNVs and indels between nonpericentromeric and pericentromeric chromosomal regions, and in WT plants, MMR function contributes to those disparities.
MMR deficiency increases the relative frequency of SNVs within genes
Because nonpericentromeric DNA is relatively gene-rich (and pericentromeric DNA relatively gene-poor) (The Arabidopsis Genome Initiative 2000), we next specifically determined the effect of MMR deficiency on the incidence of SNVs in genes. To do this, we first separated the A. thaliana genome sequence into distinct coding DNA sequence (CDS), intron, intergenic, untranslated regions (UTRs; 5′ and 3′), transposable element (TE), and “other” category regions (Fig. 5, gray bars). We next determined the relative frequencies of SNVs accumulated in each genomic regional category, using data from MMR-proficient (WT) (Fig. 5, orange bars) and MMR-deficient (Atmsh2-1) (Fig. 5, blue bars) MA line samples.
Figure 5.
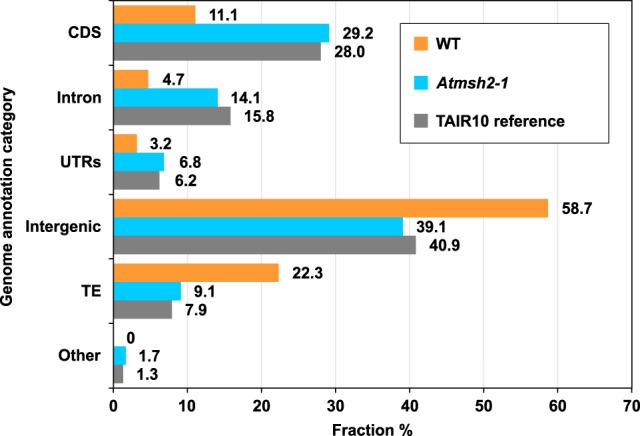
Genome-wide distribution of SNV mutations in WT and Atmsh2-1 A. thaliana MA lines. Gray bars show the relative distribution of A. thaliana reference genome annotation categories (expressed as a percentage of the total genome): (CDS) coding DNA sequence; (UTRs) untranslated regions; (TE) transposable element; (Other) noncoding RNAs and pseudogenes. Orange bars show relative distribution (%) of SNVs in WT MA lines between different genomic annotation categories; data from Ossowski et al. (2010) and Jiang et al. (2014) were averaged for each genomic annotation category. Blue bars show relative distribution (%) of SNVs in MMR-deficient Atmsh2-1 MA lines between different genomic annotation categories. Number (N) of WT SNVs from Ossowski et al. (2010), N = 98; from Jiang et al. (2014), N = 44. Number of Atmsh2-1 SNVs, N = 4048.
We found that the relative frequency (proportion of total) of SNVs in genic regions (CDS, introns, UTRs) was significantly increased in MMR-deficient genomes (with respect to WT genomes; P-value = 6.3 × 10⁻⁶, Fisher's exact test; 95% confidence interval (CI) = [2.16, 8.53]). In contrast, the relative frequency of SNVs in nongenic regions (intergenic, TE) was significantly reduced (P-value = 1.66 × 10⁻⁴, Fisher's exact test; 95% CI = [0.10, 0.43]) (Fig. 5). In addition, the relative distribution of SNVs between different genomic category regions in MMR-deficient genomes (Fig. 5, blue bars) closely mirrored the relative distribution of the genome as a whole between those different categories (Fig. 5, gray bars), whereas that of SNVs in WT genomes (Fig. 5, orange bars) did not. This latter observation suggests that SNVs are distributed more or less at random throughout MMR-deficient genomes, but are less randomly distributed in WT genomes. A particular feature of the WT distribution is that genic regions accumulated relatively fewer SNVs than would have been expected if those SNVs had been randomly distributed throughout the genome. In essence, our observations suggest that MMR preferentially protects the integrity of genic regions of the genome.
Discussion
MMR deficiency increases the frequency of spontaneous mutations in A. thaliana
Mutations are alterations in genomic DNA sequence that first result from errors in DNA replication or damage due to endogenous organismal and exogenous environmental factors (e.g., Jiang et al. 2011, 2014; Belfield et al. 2012). These alterations subsequently evade MMR and other DNA repair mechanisms, and thus become the mutations that fuel both evolution and tumor progression. Previous genetic studies have revealed the role of MMR in reducing spontaneous mutation rates. For example, in MMR-deficient mutant yeast the frequency of GC to AT transitions is elevated, and the frequency of small insertions/deletions (indels) is also increased (Lang et al. 2013; Serero et al. 2014; Zhu et al. 2014). Here, we have exploited an MMR-deficient mutant (Atmsh2-1) of the model angiosperm plant A. thaliana that lacks the core MSH2 subunit of the MMR complex, and thus lacks MMR function (Hoffman et al. 2004). Our mutation accumulation (MA) line studies (Fig. 1A) have confirmed that MMR-deficient plants exhibit an increased frequency of spontaneous mutation (for an overall survey of recovered mutations, see Fig. 1B). Our relatively large mutation sample size (8711 mutations) (Table 1A; Fig. 1B) has enabled further insights into the nature of spontaneous mutation and the specific roles of MMR in reducing mutation frequencies.
Single base pair indels are the most frequent category of mutation in MMR-deficient A. thaliana
As described above, MMR deficiency does not detectably increase the frequency of large-scale indels or copy number variants (CNVs) in A. thaliana (Fig. 2B,C; Supplemental Fig. 4A–E; Supplemental Methods). In contrast, MMR deficiency confers over three orders of magnitude increase in the frequency of small-scale indels in A. thaliana (Fig. 2A). In other species, MMR deficiency also increases the frequency of small indels, albeit to a lesser extent. For example, in MMR-deficient human tumors there is an ∼170-fold increase in small indels (≤5 bp) versus MMR-proficient tumors (Zhao et al. 2014), whereas in MMR-deficient Escherichia coli there is an ∼15-fold increase (Lee et al. 2012). In yeast (Saccharomyces cerevisiae), studies have been hampered by the infrequency of small indels in WT controls, but suggest that although indels are relatively rare in WT yeast, their frequencies are detectably elevated in MMR-deficient yeast (Lang et al. 2013; Lujan et al. 2014; Serero et al. 2014; Zhu et al. 2014). We conclude that MMR deficiency causes an elevation in the frequency of small indels in A. thaliana, an elevation perhaps greater than that seen so far in other organisms.
The predominant mutations found in MMR-deficient A. thaliana MA lines were single base pair (1-bp) indels, making up 51% of total mutations (4447 of 8711). Of these, 98% were indels at A or T sites (4376 of 4447). This predominance of 1-bp indels is likely a general characteristic of MMR deficiency. For example, in MMR-deficient E. coli, 1-bp indels were also found to be the most frequent indel (97%, 297 of 306) (Lee et al. 2012).
Homopolymeric stretches are particularly prone to indel mutation
As described above, 51% (4447 of 8711) of MMR-deficient A. thaliana mutations were 1-bp indels. Of these, 98% (4376 of 4447) were A or T indels located almost exclusively (>99%) (Supplemental Fig. 2D,E) in homopolymeric stretches. Similarly, all 577 1-bp A or T indels detected in MMR-deficient yeast were located within homopolymeric tracts (Serero et al. 2014). Furthermore, the likelihood of occurrence of an indel in MMR-deficient A. thaliana increases with increasing size of homopolymeric stretch from 4 to ∼12 nt, and then falls with further size increase (Fig. 2E,F; Supplemental Fig. 2D,E; Supplemental Methods). A similar bell-shaped curve was previously reported for indel incidence in homopolymeric stretches in MMR-deficient yeast, although it was also suggested that this shape could reflect a decreased ability to detect indels in longer repeats (Lang et al. 2013). However, Illumina 125-bp paired-end read sequencing (the present paper) likely improves the detection of mutations in longer homopolymeric stretches (versus 100 bp single-end reads) (Lang et al. 2013). Furthermore, visual inspections using IGV (Robinson et al. 2011) confirmed that our bioinformatic analyses had not failed to detect indels in longer homopolymeric runs (Supplemental Methods). We conclude that the frequencies of indels in MMR-deficient A. thaliana do indeed first rise and then fall with increasing homopolymeric run length, and that this observation suggests the involvement of DNA repair processes other than MMR in maintaining the integrity of longer homopolymeric stretches.
We conclude that the likelihood of an indel mutation occurring at any one particular individual homopolymeric repeat region in the genome of MMR-deficient plants is strongly dependent upon the length of that region. In further analysis of the likely consequences of this phenomenon (Fig. 2D), we observed 410 single-base A deletions and 40 single-base A insertions (i.e., 450 indels in total) in homopolymeric A repeat regions of 11-bp length (Supplemental Fig. 2D,E). Given that there are only 3547 11-bp homopolymeric A repeat regions in the entire A. thaliana genome (Supplemental Fig. 2A), each 11-bp region therefore had a 12.7% chance of sustaining and becoming homozygous for an A indel mutation during the 40 (8 × 5) generations assayed in our studies. This represents an extremely high regionally localized mutation frequency, and leads to the prediction that MMR deficiency might be associated with a high prevalence of particular mutant phenotypes associated with genes in the vicinity of homopolymeric stretches. Such highly localized ultrahigh mutation rates in the vicinity of particular genes might explain why MMR deficiency is especially associated with susceptibility to particular types of human cancer, such as hereditary nonpolyposis colorectal cancer (Wimmer and Kratz 2010).
MMR deficiency increases the frequency and changes the molecular spectrum of single-nucleotide variant (SNV) mutations
We found that MMR deficiency increases both the frequency of A. thaliana SNVs by at least two orders of magnitude (Fig. 2A) and substantially increases the Ti/Tv ratio (Fig. 3A,C). Increases in SNV frequency due to MMR deficiency are seen in both E. coli (approximately a 100- to 200-fold increase) (Marinus 2010; Lee et al. 2012) and in yeast (∼23-fold) (Serero et al. 2014). Although it is clear that MMR plays prominent roles in the maintenance of genome integrity, it remains unclear why MMR deficiency should have such varying magnitude of effect on SNV frequency in different species. Similarly, and again for unknown reasons, the effect of MMR deficiency on Ti/Tv ratio also varies between different species (Lee et al. 2012; Lang et al. 2013; Serero et al. 2014). Thus, although MMR deficiency increases SNV frequency and alters the molecular mutational spectrum in all organisms tested, there are unexplained species-specific differences in the consequences of lack of MMR function.
C:G positions with 5′ flanking A or G and/or 3′ flanking A or G residues are more prone to SNV mutation in MMR-deficient A. thaliana than are other C:G positions (Fig. 4A,B). Since MMR-deficient SNVs are essentially uncorrected polymerase errors, this observation suggests that polymerase proofreading activity fails more frequently at these prone sites than at others. Intriguingly, SNVs from WT MMR-proficient A. thaliana do not display these same biases (Fig. 4C). If MMR had an equal propensity to correct mismatches in all contexts, it would be expected that, although the overall frequencies of SNVs would be changed, there would be no site bias differences between WT and MMR-deficient plants. Perhaps MMR has coevolved with the polymerase to preferentially correct replication errors in the sequence contexts where the polymerase tends to leave them.
MMR deficiency reduces chromosomal regional bias in mutation incidence
Our discovery of localized ultrahigh mutation frequencies in specific homopolymeric regions prompted us to further analyze the relative extent to which new mutations are spread at random throughout the genome. Focusing first on a relatively fine-scaled level of analysis, our large sample size (8711 mutations) (Table 1A; Fig. 1B) enabled us to determine the extent to which mutations accumulating in MMR-deficient A. thaliana exhibit localized regional clustering. Although we identified some cases of localized clustering (Supplemental Methods), we also found that the vast majority of mutations are distributed throughout the genome in a pattern that is not significantly different from the random expectation. Nevertheless, the 197 clusters that we did identify had P-values ranging from 2.36 × 10⁻¹⁸ to 9.94 × 10⁻³ (Supplemental Table 2), suggesting that the mutations within these clusters were not independent but were instead concerted in time by mechanism (Roberts et al. 2012). For example, clusters consisting of two or more mutations each separated by less than 10 bp from their nearest neighbor (such as the five-mutation cluster in line MA-5) (Supplemental Methods; Supplemental Table 2) have previously been categorized as “complex” and are likely to originate from translesion synthesis (TLS) past a single DNA lesion (Harfe and Jinks-Robertson 2000b; Roberts et al. 2012). However, clustered mutations that are potentially related by mechanism constitute only a minor fraction of the mutations accumulating in MMR-deficient A. thaliana MA lines.
Next, turning our attention to broader-scale levels of analysis, we found that WT disparities in mutation frequency between pericentromeric and nonpericentromeric genomic regions were greatly reduced by MMR deficiency. Thus, lack of MMR function increases the extent to which new mutations are randomly distributed throughout the genome, and MMR function (in WT plants) differentially protects particular genomic regions from mutation.
MMR preferentially protects genes from SNV mutations
We next determined if the differential regional mutation protection provided by A. thaliana MMR distinguishes genes from nongenic regions of the genome. We found that the relative frequency (proportion of total) of SNVs in genic regions (CDS, intron, and UTRs) is significantly increased (relative to WT) in MMR-deficient A. thaliana, whereas that of nongenic regions (intergenic, TE) is reduced (Fig. 5). Although it is possible that MMR is less effective in repairing the low sequence complexity stretches typical of intergenic regions, thus causing MMR to be inherently less efficient in such regions, our observations also suggest that MMR may have evolved to preferentially protect genes from the potentially deleterious effects of spontaneous mutation. For example, if mutations arose randomly throughout the A. thaliana genome (and were not lethal), 28.0% of mutations would be expected to occur in the protein coding DNA sequence (CDS) regions of genes (TAIR10 reference genome statistics) (Fig. 5; Methods). In marked contrast, only 11.1% of mutations detected in WT MMR-proficient A. thaliana (Ossowski et al. 2010; Jiang et al. 2014) occur in CDS regions, whereas 29.2% of total mutations were detected in CDS regions of MMR-deficient plants (Fig. 5). Thus, the distribution of mutations in MMR-deficient plants is in rough accord with the random expectation, whereas that in WT is not. These differences in mutation distribution may relate to the possibility that although the vast majority of mutations in MMR-deficient plants are likely to be replication-error mutations, DNA damage mutations are likely to comprise a greater proportion of the mutations in WT plants. Nevertheless, our observations suggest that the MMR mechanism plays a major role in protecting gene sequence from mutations and are consistent with the recent demonstration from analysis of genomic DNA sequences of human tumor cell lines that MMR preferentially protects gene-rich early replicating euchromatin versus late-replicating heterochromatin from mutation (Supek and Lehner 2015). It is therefore likely that DNA mismatch repair preferentially protects genes from replication-error mutations in diverse organisms, thus impacting the mutational processes that fuel biological evolution.
Methods
Plant materials and growth conditions
MMR-deficient Arabidopsis thaliana mutation accumulation (MA) lines were developed as described in Supplemental Methods. All plants were grown in controlled environment conditions with a 16-h light/8-h dark photoperiod at 22°C (irradiance 120 µmol m−2 sec−1).
Diagnostic PCR analyses of Atmsh2-1 backcrosses
To identify plants heterozygous for Atmsh2-1 generated during sequential backcrossing to WT (Supplemental Methods), we extracted leaf DNA using a Plant DNeasy Mini kit (Qiagen) and then performed diagnostic polymerase chain reactions (PCRs). At each generation, a single plant heterozygous for Atmsh2-1 was identified and used for further backcrossing. We used the same diagnostic PCR primer sequences (5′ to 3′): MSH2_For, AGGAG CTGTCAAAAGGAGCTC; MSH2_Rev, TCACCACGATGATGTCAA GAG; and Salk_LB, TGGTTCACGTAGTGGGCCATCG (Supplemental Fig. 5) to identify a single F5 plant that was homozygous for Atmsh2-1. This plant was designated “Atmsh2-1 Ancestor” (Fig. 1A).
DNA extraction and genome sequencing
Genomic DNA was extracted from the leaves of the Atmsh2-1 Ancestor and of eight individual Atmsh2-1 G5 MA line representative plants (MA-1, MA-4, MA-5, MA-8, MA-9, MA-11, MA-13, and MA-15) (Results; Fig. 1A; Supplemental Table 4) using a Plant DNeasy Mini kit (Qiagen). DNA samples were sequenced using 125-bp paired-end Illumina technology according to the manufacturer's instructions at the BGI, China.
Detection of DNA sequence and copy-number variants (CNVs)
Computational bioinformatic mutation-detection was as previously described (Belfield et al. 2012; Jiang et al. 2014; Supplemental Methods). BAM files generated for each sample were used to detect putative CNV regions, using our own scripts (Supplemental Methods).
Calculation of Ti/Tv ratios
The numbers of transition and transversion base substitutions were first normalized with respect to the base content (GC/AT content; 36%/64%, respectively) of the A. thaliana Columbia-0 genome sequence. Ti/Tv ratios were then calculated as previously described (Ossowski et al. 2010; Belfield et al. 2012).
Flanking sequence motif detection
A custom Linux shell script (see Custom computational script 1: Flanking sequence motif detection Linux shell script in Supplemental Methods) was used to capture from TAIR10 (forward strand) the 10-bp 5′ and 3′ sequences flanking all sites subject to GC-to-AT mutations in the G5 Atmsh2-1 MA line samples. Sequences flanking G mutation sites were reverse complemented and merged with the sequences flanking C mutation sites. The merged data was used for subsequent analyses. Flanking sequence motifs were detected in Excel and displayed as stacked columns (Fig. 4A–C). To create graphical representations of the frequency biases in flanking nucleotides, we generated stacked sequence logos using WebLogo 2.8.2 (http://weblogo.berkeley.edu/logo.cgi) (Fig. 4A–C; Schneider and Stephens 1990; Crooks et al. 2004).
Reference genome statistics
To calculate the proportion of the A. thaliana TAIR10 reference genome predicted to comprise CDSs, we first used a script in R (R Core Team 2015) (see Custom computational script 2: Small-scale indel mutations in homopolymeric nucleotide repeat sequence script in Supplemental Methods) to calculate the number of nucleotides annotated on Chromosomes 1–5 as CDSs and divided this number by the total number of reference genome nucleotides (119,146,348 bp) (Supplemental Table 3).
Data access
The Illumina DNA sequencing data files from this study have been submitted to the NCBI Sequence Read Archive (SRA; http://www.ncbi.nlm.nih.gov/sra) under accession number SRP107171. Sanger sequencing trace files are in the European Nucleotide Archive (ENA; https://www.ebi.ac.uk/ena) under accession number ERP104636. Custom Linux shell and R scripts used in this study are included in Custom computational scripts in Supplemental Methods.
Supplementary Material
Acknowledgments
We thank Olivier Mathieu, Jerzy Paszkowski, and Detlef Weigel for providing the met1/+ nrpd2 WGS data. This publication is based on work supported by the Biological and Biotechnological Sciences Research Council (BBSRC) grants BB/N013611/1 and BB/M011224/1, as well as the Ministry of Science and Technology of the People's Republic of China Grant No. 2015CB942903 and the 111 Project (No. B1407).
Footnotes
[Supplemental material is available for this article.]
Article published online before print. Article, supplemental material, and publication date are at http://www.genome.org/cgi/doi/10.1101/gr.219303.116.
References
- The Arabidopsis Genome Initiative. 2000. Analysis of the genome sequence of the flowering plant Arabidopsis thaliana. Nature 408: 796–815. [DOI] [PubMed] [Google Scholar]
- Baer CF, Shaw F, Steding C, Baumgartner M, Hawkins A, Houppert A, Mason N, Reed M, Simonelic K, Woodard W, et al. 2005. Comparative evolutionary genetics of spontaneous mutations affecting fitness in rhabditid nematodes. Proc Natl Acad Sci 102: 5785–5790. [DOI] [PMC free article] [PubMed] [Google Scholar]
- Belfield EJ, Gan X, Mithani A, Brown C, Jiang C, Franklin K, Alvey E, Wibowo A, Jung M, Bailey K, et al. 2012. Genome-wide analysis of mutations in mutant lineages selected following fast-neutron irradiation mutagenesis of Arabidopsis thaliana. Genome Res 22: 1306–1315. [DOI] [PMC free article] [PubMed] [Google Scholar]
- Buermeyer AB, Deschenes SM, Baker SM, Liskay RM. 1999. Mammalian DNA mismatch repair. Annu Rev Genet 33: 533–564. [DOI] [PubMed] [Google Scholar]
- Crooks GE, Hon G, Chandonia JM, Brenner SE. 2004. WebLogo: a sequence logo generator. Genome Res 14: 1188–1190. [DOI] [PMC free article] [PubMed] [Google Scholar]
- Denver DR, Wilhelm LJ, Howe DK, Gafner K, Dolan PC, Baer CF. 2012. Variation in base-substitution mutation in experimental and natural lineages of Caenorhabditis nematodes. Genome Biol Evol 4: 513–522. [DOI] [PMC free article] [PubMed] [Google Scholar]
- Earley MC, Crouse GF. 1998. The role of mismatch repair in the prevention of base pair mutations in Saccharomyces cerevisiae. Proc Natl Acad Sci 95: 15487–15491. [DOI] [PMC free article] [PubMed] [Google Scholar]
- Haag-Liautard C, Dorris M, Maside X, Macaskill S, Halligan DL, Houle D, Charlesworth B, Keightley PD. 2007. Direct estimation of per nucleotide and genomic deleterious mutation rates in Drosophila. Nature 445: 82–85. [DOI] [PubMed] [Google Scholar]
- Harfe BD, Jinks-Robertson S. 2000a. DNA mismatch repair and genetic instability. Annu Rev Genet 34: 359–399. [DOI] [PubMed] [Google Scholar]
- Harfe BD, Jinks-Robertson S. 2000b. DNA polymerase ζ introduces multiple mutations when bypassing spontaneous DNA damage in Saccharomyces cerevisiae. Mol Cell 6: 1491–1499. [DOI] [PubMed] [Google Scholar]
- Hoffman PD, Leonard JM, Lindberg GE, Bollmann SR, Hays JB. 2004. Rapid accumulation of mutations during seed-to-seed propagation of mismatch-repair-defective Arabidopsis. Genes Dev 18: 2676–2685. [DOI] [PMC free article] [PubMed] [Google Scholar]
- Jiang C, Mithani A, Gan X, Belfield EJ, Klingler JP, Zhu JK, Ragoussis J, Mott R, Harberd NP. 2011. Regenerant Arabidopsis lineages display a distinct genome-wide spectrum of mutations conferring variant phenotypes. Curr Biol 21: 1385–1390. [DOI] [PMC free article] [PubMed] [Google Scholar]
- Jiang C, Mithani A, Belfield EJ, Mott R, Hurst LD, Harberd NP. 2014. Environmentally responsive genome-wide accumulation of de novo Arabidopsis thaliana mutations and epimutations. Genome Res 24: 1821–1829. [DOI] [PMC free article] [PubMed] [Google Scholar]
- Keightley PD, Trivedi U, Thomson M, Oliver F, Kumar S, Blaxter ML. 2009. Analysis of the genome sequences of three Drosophila melanogaster spontaneous mutation accumulation lines. Genome Res 19: 1195–1201. [DOI] [PMC free article] [PubMed] [Google Scholar]
- Kunkel TA, Erie DA. 2015. Eukaryotic mismatch repair in relation to DNA replication. Annu Rev Genet 49: 291–313. [DOI] [PMC free article] [PubMed] [Google Scholar]
- Kunz BA, Ramachandran K, Vonarx EJ. 1998. DNA sequence analysis of spontaneous mutagenesis in Saccharomyces cerevisiae. Genetics 148: 1491–1505. [DOI] [PMC free article] [PubMed] [Google Scholar]
- Lang GI, Parsons L, Gammie AE. 2013. Mutation rates, spectra, and genome-wide distribution of spontaneous mutations in mismatch repair deficient yeast. G3 3: 1453–1465. [DOI] [PMC free article] [PubMed] [Google Scholar]
- Lee H, Popodi E, Tang H, Foster PL. 2012. Rate and molecular spectrum of spontaneous mutations in the bacterium Escherichia coli as determined by whole-genome sequencing. Proc Natl Acad Sci 109: E2774–E2783. [DOI] [PMC free article] [PubMed] [Google Scholar]
- Lujan SA, Clausen AR, Clark AB, MacAlpine HK, MacAlpine DM, Malc EP, Mieczkowski PA, Burkholder AB, Fargo DC, Gordenin DA, et al. 2014. Heterogeneous polymerase fidelity and mismatch repair bias genome variation and composition. Genome Res 24: 1751–1764. [DOI] [PMC free article] [PubMed] [Google Scholar]
- Marinus MG. 2010. DNA methylation and mutator genes in Escherichia coli K-12. Mutat Res 705: 71–76. [DOI] [PMC free article] [PubMed] [Google Scholar]
- Ness RW, Morgan AD, Colegrave N, Keightley PD. 2012. Estimate of the spontaneous mutation rate in Chlamydomonas reinhardtii. Genetics 192: 1447–1454. [DOI] [PMC free article] [PubMed] [Google Scholar]
- Ossowski S, Schneeberger K, Lucas-Lledo JI, Warthmann N, Clark RM, Shaw RG, Weigel D, Lynch M. 2010. The rate and molecular spectrum of spontaneous mutations in Arabidopsis thaliana. Science 327: 92–94. [DOI] [PMC free article] [PubMed] [Google Scholar]
- R Core Team. 2015. R: a language and environment for statistical computing. R Foundation for Statistical Computing, Vienna, Austria. https://www.R-project.org/. [Google Scholar]
- Roberts SA, Sterling J, Thompson C, Harris S, Mav D, Shah R, Klimczak LJ, Kryukov GV, Malc E, Mieczkowski PA, et al. 2012. Clustered mutations in yeast and in human cancers can arise from damaged long single-strand DNA regions. Mol Cell 46: 424–435. [DOI] [PMC free article] [PubMed] [Google Scholar]
- Robinson JT, Thorvaldsdóttir H, Winckler W, Guttman M, Lander ES, Getz G, Mesirov JP. 2011. Integrative genomics viewer. Nat Biotechnol 29: 24–26. [DOI] [PMC free article] [PubMed] [Google Scholar]
- Rutter MT, Roles A, Conner JK, Shaw RG, Shaw FH, Schneeberger K, Ossowski S, Weigel D, Fenster CB. 2012. Fitness of Arabidopsis thaliana mutation accumulation lines whose spontaneous mutations are known. Evolution 66: 2335–2339. [DOI] [PubMed] [Google Scholar]
- Schaaper RM. 1993. Base selection, proofreading, and mismatch repair during DNA replication in Escherichia coli. J Biol Chem 268: 23762–23765. [PubMed] [Google Scholar]
- Schneider TD, Stephens RM. 1990. Sequence logos: a new way to display consensus sequences. Nucleic Acids Res 18: 6097–6100. [DOI] [PMC free article] [PubMed] [Google Scholar]
- Serero A, Jubin C, Loeillet S, Legoix-Né P, Nicolas AG. 2014. Mutational landscape of yeast mutator strains. Proc Natl Acad Sci 111: 1897–1902. [DOI] [PMC free article] [PubMed] [Google Scholar]
- Stuart GR, Oda Y, de Boer JG, Glickman BW. 2000. Mutation frequency and specificity with age in liver, bladder and brain of lacI transgenic mice. Genetics 154: 1291–1300. [DOI] [PMC free article] [PubMed] [Google Scholar]
- Supek F, Lehner B. 2015. Differential DNA mismatch repair underlies mutation rate variation across the human genome. Nature 521: 81–84. [DOI] [PMC free article] [PubMed] [Google Scholar]
- Van der Auwera GA, Carneiro MO, Hartl C, Poplin R, Del Angel G, Levy-Moonshine A, Jordan T, Shakir K, Roazen D, Thibault J, et al. 2013. From FastQ data to high confidence variant calls: the Genome Analysis Toolkit best practices pipeline. Curr Protoc Bioinformatics 43: 11.10.1–11.10.33. [DOI] [PMC free article] [PubMed] [Google Scholar]
- Wimmer K, Kratz CP. 2010. Constitutional mismatch repair-deficiency syndrome. Haematologica 95: 699–701. [DOI] [PMC free article] [PubMed] [Google Scholar]
- Zhao H, Thienpont B, Yesilyurt BT, Moisse M, Reumers J, Coenegrachts L, Sagaert X, Schrauwen S, Smeets D, Matthijs G, et al. 2014. Mismatch repair deficiency endows tumors with a unique mutation signature and sensitivity to DNA double-strand breaks. eLife 3: e02725. [DOI] [PMC free article] [PubMed] [Google Scholar]
- Zhu YO, Siegal ML, Hall DW, Petrov DA. 2014. Precise estimates of mutation rate and spectrum in yeast. Proc Natl Acad Sci 111: E2310–E2318. [DOI] [PMC free article] [PubMed] [Google Scholar]
Associated Data
This section collects any data citations, data availability statements, or supplementary materials included in this article.