

Abstract
Introduction
Subjective cognitive decline (SCD) is a risk factor for mild cognitive impairment (MCI) and Alzheimer’s disease (AD). Although sleep has been shown to be altered in MCI and AD, little is known about sleep in SCD.
Methods
Seventy cognitively normal community-dwelling participants were classified as SCD (32) or controls (38) using the Subjective Cognitive Decline Questionnaire. Sleep was assessed using actigraphy and diaries. FreeSurfer was used for performing medial temporal lobes (MTLs) and brain cortical parcellation of 3T magnetic resonance images. Multiple regression models were used to assess the presence of sleep, MTL, or regional cortical differences between groups.
Results
Objective sleep was disrupted in SCD participants, which showed increased nighttime wakefulness and reduced sleep efficiency. No group differences emerged in subjective sleep or magnetic resonance imaging outcomes.
Discussion
Objective sleep resulted disrupted in community-dwelling SCD, without any subjective sleep or cortical change. Sleep assessment/intervention in SCD might help prevent/delay AD onset.
Keywords: Subjective cognitive decline, Sleep, Medial temporal lobe, MRI, Actigraphy, Alzheimer’s disease, Risk factors
1. Introduction
Alzheimer’s disease (AD) develops along a continuum that begins with a long, asymptomatic preclinical period (10–20 years), evolves into mild cognitive impairment (MCI), and culminates in clinical dementia [1]. Subjective cognitive decline (SCD), a state in which a subjectively perceived decline in cognition appears in the absence of an objective decline detected by neuropsychological tests, tends to occur at the late phase of preclinical AD and has been therefore recently proposed as a pre-MCI stage [2]. This preclinical condition has been studied for many decades under a wide nomenclature (see [2]), but only recently the Subjective Cognitive Decline Initiative (SCD-I) working group defined international research criteria and established a common nomenclature for SCD [2]. Because this condition is very common among older adults and increases the risk for developing MCI and AD [3,4], many research studies have focused on SCD, trying to find a linkage between this condition and AD biomarkers.
The relationship between AD and sleep is increasingly apparent. Previous studies have demonstrated that sleep alterations, such as decreased total sleep time and sleep quality, increased nighttime wakefulness, and fragmented sleep are not only highly prevalent in MCI and AD patients [5–7] but also increase the risk for future cognitive decline when present in normal older adults [8,9]. Moreover, sleep influences not only cognition (for a review, see [10]) but also several cortical regions early affected by AD pathology, such as the medial temporal lobes (MTLs) [11,12] as well as other cortical regions [13]. The MTL consists of the hippocampus and its adjacent cortices (e.g., entorhinal, parahippocampal and perirhinal) [14]. Differently from other cortical areas, the hippocampal volume is a well-established and validated magnetic resonance imaging (MRI) marker of AD [15], allowing predictions about progression from MCI to AD (for a review, see [16]).
Previous studies have investigated changes in the MTL in SCD, MCI, and AD. Although MCI and AD patients show reliably reduced MTL thickness and volume [17–19], these findings are not as consistent in SCD, with some studies showing group differences between SCD and controls [20–27] and other failing to detect differences in MTL structures [20,27,28].
Few studies to date have assessed sleep in SCD and how it is related to MTL volume/thickness and/or other regional cortical changes. Therefore, the aims of the present study were as follows:
To compare objective (actigraphy) and subjective (diary) sleep pattern between community individuals with SCD and matched, noncomplainer controls. We hypothesized that individuals with SCD would show a more disrupted sleep pattern compared to controls.
To compare MTL volume/thickness and cortical thickness between SCD and controls. We hypothesized that SCD would display reduced hippocampal volume and/or MTL/cortical thickness compared to controls.
To determine if objective sleep outcomes correlated with MTL volume/thickness or regional cortical thickness. We hypothesized that worse sleep outcomes would correlate with reduced hippocampal volume and MTL/brain cortical thickness.
2. Methods
2.1. Participants
Seventy 50- to 76-year-old volunteers (all Caucasians, 48 females) were recruited through advertisements in the region of Abruzzo, Italy.
All participants underwent a screening interview that included a medical and neuropsychological assessment, an actigraphic sleep study, an objective apnea screening, and an MRI scan of the brain. Exclusion criteria were as follows: presence of MCI, dementia, or any other neurodegenerative and/or psychiatric disorders [29]; history of alcohol or any substance abuse [29]; shift working; international travels within the previous 6 months; use of psychotropic and/or sleep medications; diabetes; untreated systemic disorders (e.g., hypertension); vascular problems (detected on MRI fluid attenuated inversion recovery (FLAIR) and/or during the medical anamnesis); usual MRI exclusion criteria; and abnormalities on MRI. None of the participants self-reported having any sleep disorder (e.g., breathing-related sleep disorders, leg movement disorders).
Participants were assigned to the SCD or control group based on (1) the SCD research criteria [2] that are as follows: normal cognition on standardized cognitive tests accompanied by self-experienced decline in cognitive capacity in comparison with a previously status, unrelated to an acute event and/or another medical/psychiatric condition, and (2) their total score on the Subjective Cognitive decline Questionnaire (SCD-Q score ≥7 was classified as SCD, SCD-Q scores <7 as controls) [30]. The SCD-Q is a novel validated questionnaire that assesses the presence of subjective cognitive decline. It consists of two parts (MyCog and TheirCog): MyCog is filled in by the subject, TheirCog by the subjects’ informant. Both parts have identical 24 dichotomous (yes/no) questions assessing decline in memory, language, and executive functions within the last 2 years. The SCD-Q score for both MyCog and TheirCog ranges from 0 to 24, with higher scores associated with greater perceived cognitive changes (cutoff for being classified as SCD = 7). Considering that the confirmation of cognitive decline by an informant is no longer a core feature for SCD research criteria [2], we here used only the MyCog section. Both SCD and control participants underwent to a full neuropsychological assessment (see the following) and scored within normal ranges for age/education level.
Thirty-two (21 females) participants met criteria for SCD and 38 were included as controls (27 females) for the study. MRI was obtained on 61/70 participants (nine excluded due to contraindications).
All participants provided informed consent. The study was approved by the Institutional and Ethical Committee of the University “G. d’Annunzio” of Chieti-Pescara.
Characteristics of the sample are provided in Table 1.
Table 1.
Characteristics of the sample
| SCD, mean (SD) | ±95% CI | Controls, mean (SD) | ±95% CI | t | P | |
|---|---|---|---|---|---|---|
| Sample, no. | 32 | 38 | ||||
| Males/females, no. | 11/21 | 11/27 | ||||
| Age, years | 64.8 (6.3) | 62.5–67.0 | 64.0 (5.1) | 62.4–65.7 | −0.53 | .597 |
| MMSE | 29.2 (1.6) | 28.6–29.7 | 29.0 (1.3) | 28.6–29.4 | −0.47 | .634 |
| BMI, kg m−2 | 25.8 (3.4) | 24.6–27.0 | 27.1 (4.4) | 25.7–28.6 | 1.41 | .162 |
| Education, years | 11.6 (4.2) | 10.0–13.1 | 11.7 (3.8) | 10.5–13.0 | 0.181 | .857 |
| SCD-Q | 9.9 (2.4) | 9.0–10.7 | 2.9 (1.8) | 2.3–3.5 | −13.84 | <.001 |
| GDS-depression | 6.3 (5.5) | 4.3–8.3 | 4.1 (4.2) | 2.7–5.5 | −1.93 | .057 |
| STAI-Y2–anxiety | 36.6 (9.5) | 33.2–40.1 | 37.1 (9.3) | 34.0–40.1 | 0.20 | .841 |
| PSQI–sleep quality | 6.1 (3.7) | 4.7–7.4 | 6.3 (3.4) | 5.2–7.4 | 0.24 | .813 |
| ISI–insomnia | 6.4 (4.6) | 4.7–8.1 | 7.3 (5.9) | 5.3–9.2 | 0.67 | .506 |
| ESS–sleepiness | 5.8 (3.4) | 4.6–7.0 | 6.2 (3.0) | 5.2–7.2 | 0.57 | .573 |
| MEQ–circadian typology | 63.7 (7.8) | 60.9–66.5 | 62.8 (5.4) | 61.0–64.5 | −0.61 | .544 |
Abbreviations: SCD, subjective cognitive decline; SD, standard deviation; CI, confidence interval; MMSE, Mini–Mental State Examination; BMI, body mass index (self-reported); GDS, Geriatric Depression Scale; STAI, State-Trait Anxiety Inventory; PSQI, Pittsburgh Sleep Quality Index; ISI, Insomnia Severity Index; ESS, Epworth Sleepiness Scale; MEQ, Morningness–Eveningness Questionnaire.
2.2. Neuropsychological and behavioral assessment
All participants underwent a complete neuropsychological assessment. The Mini–Mental State Examination (MMSE) was used as a global cognitive test. Several tests were also used to investigate specific cognitive domains (the Rey’s Auditory Verbal Learning Test and the Babcock Story Recall Test for verbal memory, the digit span forward for echoic memory, the Corsi Cube Test for short-term visuospatial memory, the Rey-Osterrieth Complex Figure Test copy and recall for visuospatial skills and long-term visuospatial memory, the Stroop Test, the Trail Making Test A and B for attentional-executive functions, and finally the semantic and phonemic fluency test for language).
The Geriatric Depression Scale (GDS) [31] and the State Trait Anxiety Inventory [32] were administered for measuring depressive and anxiety symptoms, respectively. Finally, the following subjective sleep questionnaires were administered: the Epworth Sleepiness Scale [33] to assess daytime sleepiness, the Pittsburgh Sleep Quality Index [34] to investigate habitual sleep quality, the Insomnia Severity Index [35], and the Morningness Eveningness Questionnaire for circadian typology [36].
2.3. Apnea screening
Objective apnea risk was assessed using ApneaLink Air (ResMed Corp, CA, USA), a validated device to screen sleep apnea [37]. ApneaLink Air is a multichannel, in-home sleep apnea test that measures nasal airflow and snoring (nasal cannula), respiratory effort (thoracic belt), and blood oxygen saturation (digital probe). In five participants, Embletta (ResMed Corp, CA, USA), another similar validated device for screening apnea [38], was used. Apnea data were scored and reviewed by a sleep physiologist. Apnea (obstructive, central or mixed), hypopnea, blood oxygen desaturation, and snoring events were classified according to the latest American Academy of Sleep Medicine rules [39]. Specifically, we used a desaturation of 4% for calculating the apnea-hypopnea index (AHI). We considered individuals at “high risk” of apnea if they had an AHI ≥ 15, otherwise they were classified at “low risk” [37]. In six participants, objective apnea screening was unavailable, and we therefore classified them based on the output of the Berlin questionnaire (“High Risk”/“Low Risk”) [40].
Overall, seven controls and 10 SCD participants showed high risk for apnea.
2.4. Actigraphic sleep
Sleep/wake patterns were objectively measured using actigraphy (Cole-Kripke algorithm), a reliable, noninvasive technique based on individuals’ motor activity [41]. Actigraphic data (mean ± standard deviation [SD]: controls, 7.3 ± 1.7 days; SCD, 7.8 ± 1.9 days) were collected for each participant using wActiSleep-BT monitors (ActiGraph, Pensacola, FL, USA). Participants wore the device for at least seven consecutive days on their nondominant wrist. Data were sampled at 60 Hz (1-minute epoch) and analyzed offline using ActiLife software (ActiGraph). The following parameters were calculated: total time in bed (TIB, minutes), total sleep time (TST, minutes), sleep onset latency (SOL, minutes), wake after sleep onset (WASO, minutes), total number of awakenings, average length of the awakenings (minutes), awakening index (number of awakening per hour of sleep calculated as total number of awakenings/TST × 60) and sleep efficiency (SE, TST/TIB × 100).
2.5. Sleep diaries
Sleep diaries were completed by participants before going to sleep and on awakening during each of the actigraphic recording days [42]. Self-reported sleep measures included perceived/subjective WASO, SOL, time spent asleep (calculated by subtracting perceived SOL and WASO minutes from perceived TIB minutes), and SE.
2.6. MRI data
MRI structural data were collected with a Philips Achieva 3T Scanner (Philips Medical Systems, Best, The Netherlands). High-resolution structural images were acquired through a 3D magnetization-prepared rapid acquisition gradient echo sequence using the following parameters: matrix 256 × 256, field of view 240 × 240 × 170 mm, slice thickness 1 mm, no gaps, in-plane voxel size 1 mm × 1 mm, flip angle 12°, repetition time = 8.2 ms, echo time = 3.8 ms. Structural T1-weighted images were processed using FreeSurfer (http://ftp.nmr.mgh.harvard.edu/; version 5.3; cit). On each participant, cortical and subcortical structures were classified using the Desikan-Killiany Atlas [43], and automatic reconstruction and labeling was performed using the “recon all” command line. Using “aparcstats2table” option, the mean thickness (mm) of each cortical area and of the left and right hemispheres was calculated. Using the “hippo-subfields” option within the “recon-all” command line, the hippocampi were subdivided into left and right fimbria, fissure, cornus ammonis (CA), presubiculum, and subiculum. CA was further divided in CA1, CA2–3, and CA4-dentate gyrus. Estimated total intracranial volume (eTIV) was calculated by using the “asegstats2table” command line, and we used eTIV-corrected data for the analysis. Total right and left hippocampal volumes were obtained by summing right and left hippocampal subfields. The mean thickness of the entorhinal and parahippocampal was obtained using the “aparcstats2table” command line, whereas perirhinal thickness was calculated using the “mri_label2label” command line [44].
2.7. Statistical analyses
Demographical and clinical features were compared between SCD and controls. Sleep measures obtained by at-home diaries and actigraphy were averaged across the nights. As a measure of within-participant night-to-night variability, SDs were also calculated [45].
For assessing group differences in sleep (objective and subjective) pattern, multiple regression models were used, with diary-derived subjective sleep and objective sleep outcomes as dependent variables and group (SCD, 1 and controls, 0), sex (females, 1 and males, 0), age, apnea risk (high risk for apnea, 1 and no risk, 0), and depressive symptoms (GDS continuous scores) as predictors.
We used t tests to assess group differences in structural MRI between SCD and controls. When a statistically significant group difference was found, we used multiple regression models to determine if the group difference was maintained after accounting for confounding variables (age, sex, apnea risk, GDS).
Finally, to determine whether sleep correlated with structural integrity of the MTL or other cortical regions, we used Pearson correlations between the main objective sleep outcomes (SE, WASO, SOL, TST, number and length of awakenings) and MTL/brain cortical measures.
Normality was checked for all variables. Not normally distributed variables were log-transformed before analysis. Tolerance was greater than 0.89 in all models. P < .05 was considered significant in all the statistical analysis.
3. Results
3.1. Sample characteristics
As expected, SCD participants had higher SCD-Q than controls (P < .001). Groups did not differ for age, BMI, MMSE scores, education, anxiety, sleep quality, perceived symptoms of insomnia, perceived sleepiness, and circadian typology (see Table 1). We found a nonsignificant trend for higher depressive symptoms in SCD participants compared to controls (P = .057).
3.2. Sleep results
We were not able to detect any statistically significant difference in subjective sleep and/or night-to-night variability parameters between SCD and controls (Table 2). The subjective (diaries) sleep assessment showed that TIB and logWASO were positively correlated with age (TIB: β = 0.34, sr2 = 0.10, P = .006; logWASO: β = 0.30, sr2 = 0.08, P = .012), indicating that the perceived time spent in bed and the amount of wakefulness increased with age.
Table 2.
Sleep diary assessment
| Objective sleep outcomes | SCD, mean (SD) | ±95% CI | Controls, mean (SD) | ±95% CI | F | df | R2 | P | Significant predictors |
|---|---|---|---|---|---|---|---|---|---|
| TIB (minutes) | 469 (50) | 451–487 | 452 (51) | 435–469 | 2.77 | 5, 64 | 0.18 | .025 | Age |
| Night-to-night variability | 55 (28) | 45–65 | 54 (23) | 47–62 | 0.94 | 5, 64 | 0.07 | .461 | – |
| TST (minutes)* | 394 (67) | 370–419 | 379 (56) | 360–397 | 0.98 | 5, 63 | 0.07 | .437 | – |
| Night-to-night variability* | 63 (29) | 52–73 | 64 (28) | 54–73 | 1.05 | 5, 63 | 0.07 | .394 | – |
| SOL (minutes)*† | 20 (19) | 13–26 | 18 (15) | 13–23 | 0.93 | 5, 63 | 0.07 | .469 | – |
| Night-to-night variability*†‡ | 8 (9) | 5–12 | 13 (16) | 8–19 | 2.34 | 5, 62 | 0.16 | .053 | – |
| WASO (minutes) | 50 (52) | 31–69 | 60 (43) | 46–74 | 3.20 | 5, 63 | 0.20 | .012 | Age |
| Night-to-night variability | 28 (24) | 19–37 | 43 (29) | 34–53 | 1.82 | 5, 64 | 0.12 | .121 | – |
| SE (%) | 85 (15) | 79–91 | 83 (12) | 79–87 | 1.98 | 5, 64 | 0.13 | .094 | – |
| Night-to-night variability | 7 (5) | 5–9 | 10 (6) | 8–12 | 2.04 | 5, 64 | 0.14 | .085 | – |
Abbreviations: SCD, subjective cognitive decline; SD, standard deviation; CI, confidence interval; TIB, time in bed; TST, total sleep time; SOL, sleep onset latency, WASO, wake after sleep onset; SE, sleep efficiency.
One control participant has been excluded (value exceeding 3 SD of the mean).
Analysis based on log-transformed data.
One SCD participant has been excluded (value exceeding 3 SD of the mean).
In the objective (actigraphic) sleep assessment, SCD participants showed lower sleep efficiency (β = −0.31, sr2 = 0.08, P = .012), higher amount of wakefulness within the sleep period (β = 0.28, sr2 = 0.07, P =.022), and greater variability in the length of the awakenings at night (β = 0.31, sr2 = 0.09, P =.013) compared to controls, even controlling for age, sex, depressive symptoms, and apnea risk (see Table 3 and Fig. 1); objective TIB increased with age (β = 0.35, sr2 = 0.11, P = .005). Objective logSOL was positively correlated with both the amount of depressive symptoms (β = 0.29, sr2 = 0.07, P = .015) and apnea risk (β = 0.31, sr2 = 0.09, P = .007). Night-to-night variability in logSOL was positively associated with the amount of depressive symptoms (β = 0.25, sr2 = 0.05, P = .042). We also reran all models after excluding the 17 individuals (seven controls and 10 SCD) at high risk for apnea; all models but variability in the length of the awakenings (P = .070) at night remained significant with group being the only significant factor.
Table 3.
Actigraphic assessment
| Subjective sleep outcomes | SCD, mean (SD) | ±95% CI | Controls, mean (SD) | ± 95% CI | F | df | R2 | P | Significant predictors |
|---|---|---|---|---|---|---|---|---|---|
| TIB (minutes) | 486 (49) | 468–503 | 480 (52) | 463–497 | 2.43 | 5, 64 | 0.16 | .044 | Age |
| Night-to-night variability | 45 (20) | 38–53 | 53 (22) | 46–61 | 2.27 | 5, 64 | 0.15 | .058 | – |
| TST (minutes) | 405 (46) | 388–421 | 418 (49) | 402–434 | 1.07 | 5, 64 | 0.08 | .383 | – |
| Night-to-night variability* | 44 (16) | 38–49 | 49 (19) | 42–55 | 1.72 | 5, 63 | 0.12 | .143 | – |
| SOL (minutes)*† | 9 (6) | 7–12 | 6 (4) | 5–7 | 4.34 | 5, 63 | 0.26 | .002 | Depressive symptoms, apnea risk |
| Night-to-night variability*† | 9 (7) | 7–12 | 6 (5) | 4–7 | 2.76 | 5, 63 | 0.18 | .026 | Depressive symptoms |
| WASO (minutes)† | 69 (26) | 60–79 | 55 (31) | 45–66 | 2.42 | 5, 64 | 0.16 | .044 | SCD |
| Night-to-night variability | 27 (15) | 22–33 | 23 (15) | 18–28 | 1.60 | 5, 64 | 0.11 | .172 | – |
| N awakenings | 16.3 (5.1) | 14.5–18.2 | 15.0 (5.8) | 13.1–16.9 | 1.27 | 5, 64 | 0.09 | .286 | – |
| Night-to-night variability | 4.5 (1.7) | 3.8–5.1 | 4.5 (1.7) | 4.0–5.0 | 0.71 | 5, 64 | 0.05 | .620 | – |
| Average length of the awakenings (minutes) | 4.9 (2.3) | 4.1–5.7 | 3.7 (1.0) | 3.4–4.0 | 2.23 | 5, 64 | 0.15 | .061 | – |
| Night-to-night variability | 2.3 (1.9) | 1.6–3.0 | 1.2 (0.7) | 1.0–1.5 | 2.51 | 5, 64 | 0.16 | .039 | SCD |
| Awakening index | 2.4 (0.7) | 2.2–2.7 | 2.2 (0.9) | 1.9–2.5 | 1.50 | 5, 64 | 0.11 | .204 | – |
| SE (%) | 83 (5) | 82–85 | 87 (6) | 86–89 | 2.73 | 5, 64 | 0.18 | .027 | SCD |
| Night-to-night variability* | 6 (3) | 5–7 | 5 (3) | 4–5 | 1.80 | 5, 63 | 0.13 | .125 | – |
Abbreviations: SCD, subjective cognitive decline; SD, standard deviation; CI, confidence interval; TIB, time in bed; TST, total sleep time; SOL, sleep onset latency; WASO, wake after sleep onset; SE, sleep efficiency.
One SCD participant has been excluded (value exceeding 3 SD of the mean).
Analysis based on log-transformed data.
Fig. 1.
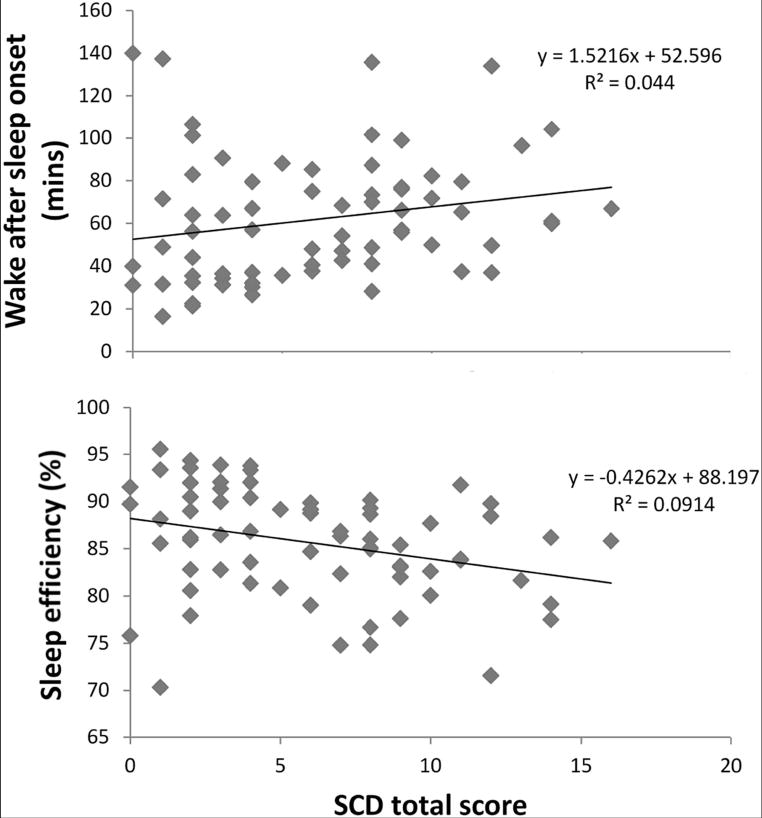
Increased nighttime wakefulness and decreased sleep efficiency are associated with higher level of SCD complaints. Abbreviation: SCD, subjective cognitive decline.
3.3. MRI results
Group comparisons of MTL volume/thickness and regional cortical thickness revealed a statistically significant difference only in left medial orbitofrontal thickness, with SCD showing smaller values compared to controls (t = 2.199, P = .032). This group difference, however, was not maintained accounting for apnea risk, GDS, age, and sex. We were not able to detect any other statistically significant group difference in the MRI data.
3.4. Correlations among sleep and MRI measures
We did not to find statistically significant correlations between the main objective sleep quality measures (SOL, SE and WASO, number and length of awakenings) and any of the MRI brain data.
4. Discussion
The first objective of this study was to determine if there were differences in subjective or objective sleep patterns between community-dwelling SCD participants and noncomplainer controls. In this study, we found that objective but not subjective habitual sleep was disrupted in our SCD participants. In particular, SCD participants showed reduced sleep quality, spent more time awake during the night, and had increased night-to-night variability in the length of awakenings, and these results were not better explained by other factors known to interfere with both sleep and cognition (e.g., depressive symptoms, age, apnea risk, sex).
One of the possible explanations for these findings would be that both SCD complaints and poor sleep could be very early prodromal signs of underlying AD. In fact, SCD often precedes MCI and AD [2] increasing the likelihood of developing both [3,4]. However, although SCD can be considered a possible early sign of AD, it is a nonmodifiable risk factor that does not have a causative role in AD pathology (amyloid β [Aβ] and tau deposits).
Sleep, in contrast, is not only a modifiable risk factor but seems to be mechanistically linked to AD pathology. Current data, in fact, support the possibility that sleep disturbances may be an early symptom associated with underlying AD pathology. For instance, a recent study of AD transgenic mice showed that sleep disruptions appear immediately after Aβ starts accumulating in brain tissue, before the evolution of cognitive impairment [46]. In humans, similar findings have been reported in preclinical AD, in which cerebrospinal fluid Aβ42-positive participants showed reduced sleep quality as assessed by actigraphy compared to cerebrospinal fluid Aβ42-negative participants, before any other clinical symptom [47]. Moreover, in normal older adults, increased Aβ levels in the medial prefrontal cortex are associated with reduced slow wave sleep which in turn is associated with impoverished hippocampal-dependent memory consolidation [48].
Interestingly, many studies suggest that sleep plays also an active, restorative role in the prevention of AD pathogenesis. Potentially neurotoxic waste products, including Aβ deposits, accumulate during wakefulness, and sleep promotes the clearance of these harmful deposits from the central nervous system [49]. In mice, sleep deprivation accelerates tau formation and accentuates memory impairment [50]. Moreover, longitudinal studies show that sleep disturbances increase the likelihood of developing both cognitive decline and AD [9,51]. If we consider SCD as part of the AD continuum, our findings are in line with current literature regarding sleep disturbances in MCI and AD, in which decreased objective sleep quality or efficiency (SE) and increased wakefulness during the night (WASO) have been reported, with more severe sleep disruptions as the disease progresses [52,53]. Our results are also consistent and similar to what has been found in preclinical AD by Ju et al. [47] who found that objective sleep quality (SE) but not objective sleep quantity (TST) measured by actigraphy differed between preclinical AD and controls (SE: 80% in preclinical AD, 83% in controls; TST: 401 minutes in preclinical AD and 403 minutes in controls) suggesting that objective sleep quality in preclinical AD changes before sleep quantity and appears before any other clinical symptoms of AD [47].
However, it must be noted that poor objective sleep could occur in the absence of underlying AD pathology in normal older adults [54], and therefore, an alternate explanation for our results may simply be that, in our sample, poor objective sleep could by itself explain SCD complaints. In this case, a sleep intervention would be beneficial not only for improving sleep but also for reducing or eliminating subjective cognitive complaints.
Of note, our SCD participants only differed from controls on the amount of SCD complaints, and we did not find any other statistically significant difference on any other self-reported measure (see Table 1). However, in line with other SCD studies [2,27], we found a trend for higher, subclinical depressive symptoms in our SCD participants. Therefore, another possible explanation of our results could be that subclinical depression might have caused SCD complaints. One limitation of the SCD criteria, in fact, is that they partially overlap with clinical criteria for depression, which also include cognitive complaints. Arguing against this possibility to some degree, in the present study, depressive symptoms did not correlate with the main objective sleep quality outcomes (SE, WASO, number and length of awakenings), whereas SCD complaints correlated with these measures after adjusting for GDS scores.
Aside from sleep data, in the present study, we also collected topographical biomarkers of AD (MRI MTL volumes/thickness and brain regional cortical thickness) that, even if insufficient to identify preclinical AD, are useful for screening at risk populations [55]. In fact, many studies suggest that SCD might be the expression of AD-related brain changes that have already occurred in the MTL [20–27] or in other brain cortical regions [23,27]. However, although some MRI studies found MTL and/or cortical differences between SCD and controls [20–27], other studies failed to find these differences [20,27,28]. In particular, in one study, SCD was significantly associated with both cross-sectional and longitudinal hippocampal volume changes [20], whereas another study showed that hippocampal volumes in SCD participants were similar to MCI, but not statistically different from control participants [28]. Another very interesting study conducted by Perrotin et al. (in press, [27]) showed that although community-dwelling SCD did not show any brain regional volume change compared with controls, SCD recruited from the clinic showed reduced volume in several brain regions, including the left hippocampus. These inconsistent MRI findings are likely related to differences in the populations sampled (e.g., recruitment from the community vs. clinic), the criteria used to define SCD, and the approaches used for the MRI analysis across these studies.
There are several possible explanations for the fact that we were not able to find statistically significant group differences between SCD and controls in MTL volume/thickness, as well as in regional cortical thickness. First, our participants may not have underlying AD (and therefore no AD-related brain structural changes), and SCD complaints might just have been caused by disrupted sleep and/or subclinical depression. Second, our community-dwelling SCD participants showed “mild” SCD scores, while clinical recruitment of SCD participants may identify individuals with more severe complaints and in a more advanced stage of preclinical AD, in which brain structural changes have already occurred (e.g., preclinical stages 2 and 3) [27,56]. For instance, in the SCD-Q validation study from Rami et al. [30], SCD-Q scores in participants recruited within the community were very similar to our SCD participants’ scores (Rami et al.: 9.1 ± 5.1 vs. this study: 9.9 ± 2.4), whereas the SCD score rose to 12 ± 5.8 in participants recruited from the clinic. In line with this assumption are the previously mentioned findings of reduced cortical volume in SCD recruited from the clinic, but not in SCD from the community (in press, [27]).
We may also have not found MTL or cortical group differences because of lack of statistical power or because of the limitations of FreeSurfer automated methods in estimating hippocampal volume and hippocampal subfields’ volume [57].
Recognizing that not all individuals with SCD complaints have underlying AD, both disrupted sleep and SCD complaints are known to increase the risk for future development of MCI and AD, with sleep being a modifiable risk factor. Considering that we found disrupted habitual objective sleep in our community-dwelling SCD participants, and considering that sleep affects both cognition and brain structures, regular objective sleep monitoring and intervention procedures may be helpful in at-risk populations of AD-like SCD, before objective cognitive decline and brain structural changes occur. These precautions could prevent or at least delay the onset of AD, reducing both the clinical burden and costs associated with this disease.
5. Limitations and future directions
Sleep studies that include molecular AD biomarkers in SCD (community and clinic) are needed. The use of actigraphy in this study allowed the noninvasive assessment of habitual objective sleep (multiple nights in an ecological setting). However, future polysomnographic studies are needed to characterize macro- and micro-sleep architecture in SCD and for objectively assessing the presence of other sleep pathologies. The screening cognitive test battery used in this study was designed to detect MCI or dementia, but other cognitive measures may be more sensitive to detect subtle deficits in patients with SCD and are therefore needed.
Supplementary Material
RESEARCH IN CONTEXT.
Systematic review: Several studies have revealed the bilateral relationship between sleep and Alzheimer disease (AD). Sleep disruptions increase the risk for AD dementia and are present not only in mild cognitive impairment (MCI) and AD but also in preclinical AD, in the absence of any other clinical symptoms. Sleep also influences cognition and cortical regions early affected by AD pathology (e.g., the medial temporal lobes). Despite subjective cognitive decline (SCD) often precedes MCI and AD, little is known about sleep in SCD.
Interpretation: Our findings support the idea of sleep as a possible early and objective behavioral change in AD at risk populations like SCD. Regular sleep assessments and interventions may help preventing or delaying AD onset in community-dwelling older adults with SCD.
Future directions: Future studies that also include AD molecular biomarkers, a polysomnographic assessment, and experimental cognitive tests are needed to better investigate the sleep-SCD-AD relationship.
Acknowledgments
This research did not receive any specific grant from funding agencies in the public, commercial, or not-for-profit sectors. G.D.R. receives research support from Avid Radiopharmaceuticals, GE Healthcare, and Piramal Imaging. He has received speaking or consulting honoraria from Eisai, GE Healthcare, Lundbeck, Medscape, and Piramal Imaging.
Footnotes
The authors declare no conflict of interest.
Supplementary data
Supplementary data related to this article can be found at http://dx.doi.org/10.1016/j.jalz.2016.11.006.
References
- 1.Jack C, Jr, Knopman D, Jagust W, Shaw L, Aisen P, Weiner M, et al. Hypothetical model of dynamic biomarkers of the Alzheimer’s pathological cascade. Lancet Neurol. 2010;9:119–28. doi: 10.1016/S1474-4422(09)70299-6. [DOI] [PMC free article] [PubMed] [Google Scholar]
- 2.Jessen F, Amariglio RE, van Boxtel M, Breteler M, Ceccaldi M, Chetelat G, et al. A conceptual framework for research on subjective cognitive decline in preclinical Alzheimer’s disease. Alzheimers Dement. 2014;10:844–52. doi: 10.1016/j.jalz.2014.01.001. [DOI] [PMC free article] [PubMed] [Google Scholar]
- 3.Jessen F, Wiese B, Bachmann C, Eifflaender-Gorfer S, Haller F, Kölsch H, et al. Prediction of dementia by subjective memory impairment: effects of severity and temporal association with cognitive impairment. Arch Gen Psychiatry. 2010;67:414–22. doi: 10.1001/archgenpsychiatry.2010.30. [DOI] [PubMed] [Google Scholar]
- 4.Reisberg B, Shulman MB, Torossian C, Leng L, Zhu W. Outcome over seven years of healthy adults with and without subjective cognitive impairment. Alzheimers Dement. 2010;6:11–24. doi: 10.1016/j.jalz.2009.10.002. [DOI] [PMC free article] [PubMed] [Google Scholar]
- 5.da Silva RAPC. Sleep disturbances and mild cognitive impairment: A review. Sleep Sci. 2015;8:36–41. doi: 10.1016/j.slsci.2015.02.001. [DOI] [PMC free article] [PubMed] [Google Scholar]
- 6.Bliwise DL. Sleep in normal aging and dementia. Sleep. 1993;16:40–81. doi: 10.1093/sleep/16.1.40. [DOI] [PubMed] [Google Scholar]
- 7.Hita-Yanez E, Atienza M, Cantero J. Polysomnographic and subjective sleep markers of mild cognitive impairment. Sleep. 2013;36:1327–34. doi: 10.5665/sleep.2956. [DOI] [PMC free article] [PubMed] [Google Scholar]
- 8.Osorio R, Pirraglia E, Agüera-Ortiz L, During E, Sacks H, Ayappa I, et al. Greater risk of Alzheimer’s disease in older adults with insomnia. J Am Geriatr Soc. 2011;59:559–62. doi: 10.1111/j.1532-5415.2010.03288.x. [DOI] [PMC free article] [PubMed] [Google Scholar]
- 9.Lim A, Kowgier M, Yu L, Buchman A, Bennett D. Sleep fragmentation and the risk of incident Alzheimer’s disease and cognitive decline in older persons. Sleep. 2013;36:1027–32. doi: 10.5665/sleep.2802. [DOI] [PMC free article] [PubMed] [Google Scholar]
- 10.Miller MA, Wright H, Hough J, Cappuccio FP. Sleep and cognition. In: Idzikowski C, editor. Sleep and its Disorders Affect Society. InTech; 2014. p. 160. [Google Scholar]
- 11.Neylan T, Mueller S, Wang Z, Metzler T, Lenoci M, Truran D, et al. Insomnia severity is associated with a decreased volume of the CA3/dentate gyrus hippocampal subfield. Biol Psychiatry. 2010;68:494–6. doi: 10.1016/j.biopsych.2010.04.035. [DOI] [PMC free article] [PubMed] [Google Scholar]
- 12.Joo E, Kim H, Suh S, Hong S. Hippocampal substructural vulnerability to sleep disturbance and cognitive impairment in patients with chronic primary insomnia: magnetic resonance imaging morphometry. Sleep. 2014;37:1189–98. doi: 10.5665/sleep.3836. [DOI] [PMC free article] [PubMed] [Google Scholar]
- 13.Branger P, Arenaza-Urquijo E, Tomadesso C, Mézenge F, André C, de Flores R, et al. Relationships between sleep quality and brain volume, metabolism, and amyloid deposition in late adulthood. Neurobiol Aging. 2016;41:107–14. doi: 10.1016/j.neurobiolaging.2016.02.009. [DOI] [PubMed] [Google Scholar]
- 14.Eichenbaum H, Yonelinas A, Ranganath C. The medial temporal lobe and recognition memory. Annu Rev Neurosci. 2007;30:123–52. doi: 10.1146/annurev.neuro.30.051606.094328. [DOI] [PMC free article] [PubMed] [Google Scholar]
- 15.Modrego P. Predictors of conversion to dementia of probable Alzheimer type in patients with mild cognitive impairment. Curr Alzheimer Res. 2006;3:161–70. doi: 10.2174/156720506776383103. [DOI] [PubMed] [Google Scholar]
- 16.Frisoni G, Fox N, Jack C, Jr, Scheltens P, Thompson P. The clinical use of structural MRI in Alzheimer disease. Nat Rev Neurol. 2010;6:67–77. doi: 10.1038/nrneurol.2009.215. [DOI] [PMC free article] [PubMed] [Google Scholar]
- 17.Pennanen C, Kivipelto M, Tuomainen S, Hartikainen P, Hänninen T, Laakso M, et al. Hippocampus and entorhinal cortex in mild cognitive impairment and early AD. Neurobiol Aging. 2004;25:303–10. doi: 10.1016/S0197-4580(03)00084-8. [DOI] [PubMed] [Google Scholar]
- 18.Convit A, De Leon M, Tarshish C, De Santi S, Tsui W, Rusinek H, et al. Specific hippocampal volume reductions in individuals at risk for Alzheimer’s disease. Neurobiol Aging. 1997;18:131–8. doi: 10.1016/s0197-4580(97)00001-8. [DOI] [PubMed] [Google Scholar]
- 19.Du AT, Schuff N, Amend D, Laakso M, Hsu Y, Jagust W, et al. Magnetic resonance imaging of the entorhinal cortex and hippocampus in mild cognitive impairment and Alzheimer’s disease. J Neurol Neurosurg Psychiatry. 2001;71:441–7. doi: 10.1136/jnnp.71.4.441. [DOI] [PMC free article] [PubMed] [Google Scholar]
- 20.Stewart R, Godin O, Crivello F, Maillard P, Mazoyer B, Tzourio C, et al. Longitudinal neuroimaging correlates of subjective memory impairment: 4-year prospective community study. Br J Psychiatry. 2011;198:199–205. doi: 10.1192/bjp.bp.110.078683. [DOI] [PubMed] [Google Scholar]
- 21.van der Flier W, van Buchem M, Weverling-Rijnsburger A, Mutsaers E, Bollen E, Admiraal-Behloul F, et al. Memory complaints in patients with normal cognition are associated with smaller hippocampal volumes. J Neurol. 2004;251:671–5. doi: 10.1007/s00415-004-0390-7. [DOI] [PubMed] [Google Scholar]
- 22.van Norden A, Fick W, de Laat K, van Uden I, van Oudheusden L, Tendolkar I, et al. Subjective cognitive failures and hippocampal volume in elderly with white matter lesions. Neurology. 2008;71:1152–9. doi: 10.1212/01.wnl.0000327564.44819.49. [DOI] [PubMed] [Google Scholar]
- 23.Hafkemeijer A, Altmann-Schneider I, Oleksik A, van de Wiel L, Middelkoop H, van Buchem M, et al. Increased functional connectivity and brain atrophy in elderly with subjective memory complaints. Brain Connect. 2013;3:353–62. doi: 10.1089/brain.2013.0144. [DOI] [PMC free article] [PubMed] [Google Scholar]
- 24.Striepens N, Scheef L, Wind A, Popp J, Spottke A, Cooper-Mahkorn D, et al. Volume loss of the medial temporal lobe structures in subjective memory impairment. Dement Geriatr Cogn Disord. 2010;29:75–81. doi: 10.1159/000264630. [DOI] [PubMed] [Google Scholar]
- 25.Jessen F, Feyen L, Freymann K, Tepest R, Maier W, Heun R, et al. Volume reduction of the entorhinal cortex in subjective memory impairment. Neurobiol Aging. 2006;27:1751–6. doi: 10.1016/j.neurobiolaging.2005.10.010. [DOI] [PubMed] [Google Scholar]
- 26.Meiberth D, Scheef L, Wolfsgruber S, Boecker H, Block W, Träber F, et al. Cortical thinning in individuals with subjective memory impairment. J Alzheimers Dis. 2015;45:139–46. doi: 10.3233/JAD-142322. [DOI] [PubMed] [Google Scholar]
- 27.Perrotin A, La Joie R, de la Sayette V, Barré L, Mézenge F, Mutlu J, et al. Subjective cognitive decline in cognitively normal elders from the community or from a memory clinic: differential affective and imaging correlates. Alzheimers Dement. 2016 doi: 10.1016/j.jalz.2016.08.011. [DOI] [PubMed] [Google Scholar]
- 28.Saykin A, Wishart H, Rabin L, Santulli R, Flashman L, West J, et al. Older adults with cognitive complaints show brain atrophy similar to that of amnestic MCI. Neurology. 2006;67:834–42. doi: 10.1212/01.wnl.0000234032.77541.a2. [DOI] [PMC free article] [PubMed] [Google Scholar]
- 29.American Psychiatric Association. The Diagnostic and Statistical Manual of Mental Disorders: DSM 5. 5th. Arlington, VA: American Psychiatric Publishing; 2013. [Google Scholar]
- 30.Rami L, Mollica MA, Garcia-Sanchez C, Saldana J, Sanchez B, Sala I, et al. The Subjective Cognitive Decline Questionnaire (SCD-Q): a validation study. J Alzheimers Dis. 2013;41:453–66. doi: 10.3233/JAD-132027. [DOI] [PubMed] [Google Scholar]
- 31.Yesavage JA, Brink T, Rose TL, Lum O, Huang V, Adey M, et al. Development and validation of a geriatric depression screening scale: a preliminary report. J Psychiatr Res. 1983;17:37–49. doi: 10.1016/0022-3956(82)90033-4. [DOI] [PubMed] [Google Scholar]
- 32.Spielberger CD. Manual for the State-Trait Anxiety Inventory STAI (form Y)(“self-evaluation questionnaire”) Palo Alto, CA: Consulting Psychologists; 1983. [Google Scholar]
- 33.Johns M. A new method for measuring daytime sleepiness: the Epworth sleepiness scale. Sleep. 1991;14:540–5. doi: 10.1093/sleep/14.6.540. [DOI] [PubMed] [Google Scholar]
- 34.Buysse D, Reynolds C, III, Monk T, Berman S, Kupfer D. The Pittsburgh Sleep Quality Index: a new instrument for psychiatric practice and research. Psychiatry Res. 1989;28:193–213. doi: 10.1016/0165-1781(89)90047-4. [DOI] [PubMed] [Google Scholar]
- 35.Morin CM. Insomnia: Psychological assessment and management. Guilford Press; 1993. [Google Scholar]
- 36.Horne J, Ostberg O. A self-assessment questionnaire to determine morningness-eveningness in human circadian rhythms. Int J Chronobiol. 1976;4:97–110. [PubMed] [Google Scholar]
- 37.Erman MK, Stewart D, Einhorn D, Gordon N, Casal E. Validation of the ApneaLink™ for the screening of sleep apnea: a novel and simple single-channel recording device. J Clin Sleep Med. 2007;3:387. [PMC free article] [PubMed] [Google Scholar]
- 38.Ng SS, Chan TO, To KW, Ngai J, Tung A, Ko FW, et al. Validation of Embletta portable diagnostic system for identifying patients with suspected obstructive sleep apnoea syndrome (OSAS) Respirology. 2010;15:336–42. doi: 10.1111/j.1440-1843.2009.01697.x. [DOI] [PubMed] [Google Scholar]
- 39.Berry RB, Budhiraja R, Gottlieb DJ, Gozal D, Iber C, Kapur VK, et al. Rules for Scoring Respiratory Events in Sleep: Update of the 2007 AASM Manual for the Scoring of Sleep and Associated Events. J Clin Sleep Med. 2012;8:597–619. doi: 10.5664/jcsm.2172. [DOI] [PMC free article] [PubMed] [Google Scholar]
- 40.Netzer N, Stoohs R, Netzer C, Clark K, Strohl K. Using the Berlin Questionnaire to identify patients at risk for the sleep apnea syndrome. Ann Intern Med. 1999;131:485–91. doi: 10.7326/0003-4819-131-7-199910050-00002. [DOI] [PubMed] [Google Scholar]
- 41.Chesson M, Jr, Coleman M, Lee-Chiong M, Pancer D. Practice parameters for the use of actigraphy in the assessment of sleep and sleep disorders: an update for 2007. Sleep. 2007;30:519. doi: 10.1093/sleep/30.4.519. [DOI] [PubMed] [Google Scholar]
- 42.Monk TH, Reynolds CF, Kupfer DJ, Buysse DJ, Coble PA, Hayes AJ, et al. The Pittsburgh sleep diary. J Sleep Res. 1994;3:111–20. [PubMed] [Google Scholar]
- 43.Desikan R, Ségonne F, Fischl B, Quinn B, Dickerson B, Blacker D, et al. An automated labeling system for subdividing the human cerebral cortex on MRI scans into gyral based regions of interest. Neuroimage. 2006;31:968–80. doi: 10.1016/j.neuroimage.2006.01.021. [DOI] [PubMed] [Google Scholar]
- 44.Delli Pizzi S, Franciotti R, Bubbico G, Thomas A, Onofrj M, Bonanni L. Atrophy of hippocampal subfields and adjacent extrahippocampal structures in dementia with Lewy bodies and Alzheimer’s disease. Neurobiol Aging. 2016;40:103–9. doi: 10.1016/j.neurobiolaging.2016.01.010. [DOI] [PubMed] [Google Scholar]
- 45.Baker FC, Willoughby AR, Sassoon SA, Colrain IM, de Zambotti M. Insomnia in women approaching menopause: beyond perception. Psychoneuroendocrinology. 2015;60:96–104. doi: 10.1016/j.psyneuen.2015.06.005. [DOI] [PMC free article] [PubMed] [Google Scholar]
- 46.Roh J, Huang Y, Bero A, Kasten T, Stewart F, Bateman R, et al. Disruption of the sleep-wake cycle and diurnal fluctuation of β-amyloid in mice with Alzheimer’s disease pathology. Sci Transl Med. 2012;4:150ra122. doi: 10.1126/scitranslmed.3004291. [DOI] [PMC free article] [PubMed] [Google Scholar]
- 47.Ju Y-ES, McLeland JS, Toedebusch CD, Xiong C, Fagan AM, Duntley SP, et al. Sleep quality and preclinical Alzheimer Disease. JAMA Neurol. 2013;70:587–93. doi: 10.1001/jamaneurol.2013.2334. [DOI] [PMC free article] [PubMed] [Google Scholar]
- 48.Mander B, Marks S, Vogel J, Rao V, Lu B, Saletin J, et al. β-amyloid disrupts human NREM slow waves and related hippocampus-dependent memory consolidation. Nat Neurosci. 2015;18:1051–7. doi: 10.1038/nn.4035. [DOI] [PMC free article] [PubMed] [Google Scholar]
- 49.Xie L, Kang H, Xu Q, Chen M, Liao Y, Thiyagarajan M, et al. Sleep drives metabolite clearance from the adult brain. Science. 2013;342:373–7. doi: 10.1126/science.1241224. [DOI] [PMC free article] [PubMed] [Google Scholar]
- 50.Di Meco A, Joshi YB, Praticò D. Sleep deprivation impairs memory, tau metabolism, and synaptic integrity of a mouse model of Alzheimer’s disease with plaques and tangles. Neurobiol Aging. 2014;35:1813–20. doi: 10.1016/j.neurobiolaging.2014.02.011. [DOI] [PubMed] [Google Scholar]
- 51.Spira A, Chen-Edinboro L, Wu M, Yaffe K. Impact of sleep on the risk of cognitive decline and dementia. Curr Opin Psychiatry. 2014;27:478–83. doi: 10.1097/YCO.0000000000000106. [DOI] [PMC free article] [PubMed] [Google Scholar]
- 52.Bliwise D. Sleep disorders in Alzheimer’s disease and other dementias. Clin Cornerstone. 2004;6:S16–28. doi: 10.1016/s1098-3597(04)90014-2. [DOI] [PubMed] [Google Scholar]
- 53.Westerberg C, Mander B, Florczak S, Weintraub S, Mesulam M, Zee P, et al. Concurrent impairments in sleep and memory in amnestic mild cognitive impairment. J Int Neuropsychol Soc. 2012;18:490–500. doi: 10.1017/S135561771200001X. [DOI] [PMC free article] [PubMed] [Google Scholar]
- 54.Espiritu J. Aging-related sleep changes. Clin Geriatr Med. 2008;24:1–14. doi: 10.1016/j.cger.2007.08.007. [DOI] [PubMed] [Google Scholar]
- 55.Dubois B, Hampel H, Feldman H, Scheltens P, Aisen P, Andrieu S, et al. Preclinical Alzheimer’s disease: Definition, natural history, and diagnostic criteria. Alzheimers Dement. 2016;12:292–323. doi: 10.1016/j.jalz.2016.02.002. [DOI] [PMC free article] [PubMed] [Google Scholar]
- 56.Sperling R, Aisen P, Beckett L, Bennett D, Craft S, Fagan A, et al. Toward defining the preclinical stages of Alzheimer’s disease: recommendations from the National Institute on Aging-Alzheimer’s Association workgroups on diagnostic guidelines for Alzheimer’s disease. Alzheimers Dement. 2011;7:280–92. doi: 10.1016/j.jalz.2011.03.003. [DOI] [PMC free article] [PubMed] [Google Scholar]
- 57.Wisse L, Biessels G, Geerlings M. A critical appraisal of the hippocampal subfield segmentation package in FreeSurfer. Front Aging Neurosci. 2014;6:261. doi: 10.3389/fnagi.2014.00261. [DOI] [PMC free article] [PubMed] [Google Scholar]
Associated Data
This section collects any data citations, data availability statements, or supplementary materials included in this article.