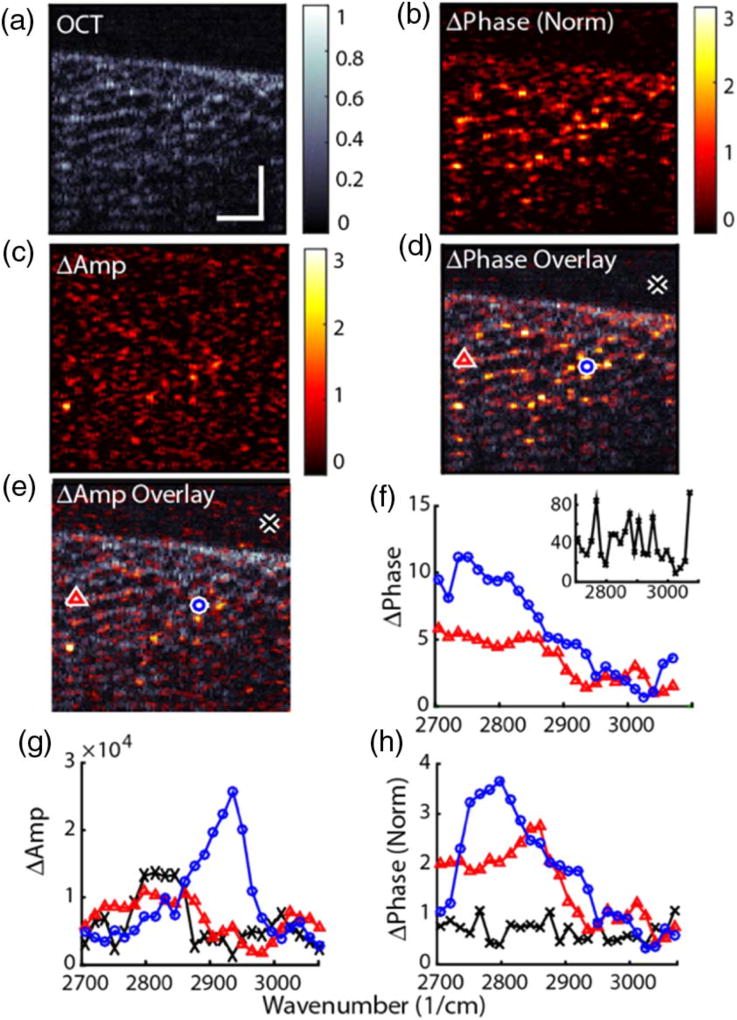
Fig. 4.
SRS-SOCT image of excised human adipose tissue. Stokes and pump frequencies are tuned on-resonance with the vibrational modes of lipids. (a) Conventional OCT image. (b),(c) Average spectral phase and amplitude changes resulting from SRS interactions. (d),(e) Overlay of the average molecular signals with the structure. (f),(g) Phase and amplitude spectra from 3 selected points. (h) Phase spectra normalized to suppress noise. Scale bar = 100 µm.

