

Abstract
Tetrachloroethylene (perchloroethylene; PERC) is a high-production volume chemical and a ubiquitous environmental contaminant that is hazardous to human health. Toxicity of PERC is mediated through oxidative and glutathione conjugation metabolites. The conjugation of PERC by glutathione-s-transferase to generate S-(1,2,2-trichlorovinyl) glutathione (TCVG), which is subsequently metabolized to form S-(1,2,2-trichlorovinyl)-L-cysteine (TCVC) is of special importance to human health. Specifically, TCVC can be metabolized to N-acetyl-S-(1,2,2-trichlorovinyl)-L-cysteine (NAcTCVC) which is excreted through urine, or to electrophilic metabolites that are nephrotoxic and mutagenic. Little is known about toxicokinetics of TCVG, TCVC, and NAcTCVC as analytical methods for simultaneous determination of these metabolites in tissues have not yet been reported. Hence, an ultra-high performance liquid chromatography electrospray ionization tandem mass spectrometry-based method was developed for analysis of TCVG, TCVC, and NAcTCVC in liver, kidney, serum, and urine. The method is rapid, sensitive, robust, and selective for detection all three analytes in every tissue examined, with limits of detection ranging from 1.8–68.2 femtomoles on column, depending on the analyte and tissue matrix. This method can be applied to quantify levels of TCVG, TCVC, and NAcTCVC in tissues from mice treated with PERC (10 to 1000 mg/kg, orally) with limits of quantitation of 1–2.5 pmol/g in liver, 1–10 pmol/g in kidney, 1–2.5 pmol/mL in serum, and 2.5–5 pmol/mL in urine. This method is useful for further characterization of the glutathione conjugative pathway of PERC in vivo and improved understanding of PERC toxicity.
Keywords: Tetrachloroethylene; S-(1,2,2-trichlorovinyl) glutathione (TCVG); S-(1,2,2-trichlorovinyl)-L-cysteine (TCVC); N-acetyl-S-(1,2,2-trichlorovinyl)-L-cysteine (NAcTCVC); LC-MS/MS
1. Introduction
Tetrachloroethylene (perchloroethylene; PERC) is a high-production volume chlorinated olefin solvent with wide-ranging industrial applications, which include dry cleaning, metal degreasing, and chemical synthesis; however, the use of PERC in dry cleaning has been curtailed in the United States since 2006. Exposure to PERC is common in humans because PERC is difficult to remediate from contaminated sites and it is a ubiquitous contaminant of soil, ground and drinking water, and air (IARC 2014). PERC is also one of the most commonly found contaminants at hazardous waste sites (National Research Council 2010). Federal and international regulatory agencies are concerned about understanding PERC toxicity (IARC 2014, U.S. EPA 2011) and PERC is among the first 10 chemicals that EPA will evaluate for risks to human health under the new Frank R. Lautenberg Chemical Safety for the 21st Century Act.
In both rodents and humans, the liver and kidney are main target organs for cancer and non-cancer effects of PERC; however, a relatively small number of studies has examined PERC toxicity (Lash et al. 2002, Cichocki et al. 2016). The liver and kidney bioactivate PERC to reactive metabolites in situ through both oxidative and conjugative metabolic pathways (Lash and Parker 2001, Guyton et al. 2014). Oxidation of PERC yields trichloroacetate (TCA) as the primary metabolite and is thought to occur mostly via hepatic cytochrome P450s (Cichocki et al. 2016). PERC is also conjugated with glutathione (GSH) via hepatic or renal glutathione-S-transferases (GSTs) to form S-(1,2,2-trichlorvinyl) glutathione (TCVG) (Dekant 1993, Lash and Parker 2001). TCVG can be further metabolized in the kidney by gamma-glutamyl transferase (GGT) and dipeptidase to form S-(1,2,2-trichlorovinyl)-L-cysteine (TCVC). TCVC can either be detoxified via N-acetyltransferases to N-acetyl-S-(1,2,2-trichlorovinyl)-L-cysteine (NAcTCVC), bioactivated to 1,2,2-trichlorovinylthiol via cysteine conjugate β-lyase, or to TCVC sulfoxide via flavin-containing monoxygenase 3 and cytochrome P450s (Ripp et al. 1997). 1,2,2-trichlorovinylthiol can spontaneously form a reactive thioketene which can adduct to DNA and proteins (IARC 2014). PERC metabolites from the GSH conjugation pathway are cytotoxic in vitro (Lash et al. 2002, Birner et al. 1997, Irving and Elfarra 2013) and nephrotoxic in vivo (Birner et al. 1997, Elfarra and Krause 2007). They are also mutagenic (Vamvakas et al. 1989b, Vamvakas et al. 1989a, Irving and Elfarra 2013). Therefore, determining tissue-specific levels of these metabolites is critical to establishing concentration-response relationships for PERC exposure and effects (Cichocki et al. 2016).
The quantification of TCVG in in vitro experiments using isolated rodent hepatocytes, renal cortical cells, and/or subcellular fractions has been described (Lash et al. 1998b). The development of a method that can simultaneously detect TCVG, TCVC, and NAcTCVC in multiple tissues from animals and humans is hindered by their very low abundance as compared to oxidative metabolites of PERC (Chiu and Ginsberg 2011). Still, characterization of the flux of PERC to nephrotoxic (TCVG, TCVC, or their distal metabolites) or n-acetylated (NAcTCVC) metabolites is needed to fill a critical data gap and improve public health assessments of PERC.
To this end, a method for extraction and quantification of TCVG, TCVC, and NAcTCVC in multiple tissues was developed. Efficient extraction of these analytes was achieved by solid-phase extraction (SPE). By coupling reverse-phase ultra-high performance liquid chromatography (UPLC) to electrospray ionization tandem mass spectroscopy (MS/MS), levels of all three PERC conjugates were simultaneously quantified from a relatively small amount of biological material (50 mg or μL of tissue). This method proved to be sensitive, robust, and precise, and was utilized to quantify levels of TCVG, TCVC, and NAcTCVC in a series of studies in mice. This method will be useful for future animal and human studies.
2. Methods
2.1 Chemicals
2-amino-5-[(1-{[(13C)carboxy(13C)methyl](15N)amino}-1-oxo-3-[(trichloroethenyl)sulfanyl]propan-2-yl)amino]-5-oxopentanoic acid (TCVG*, purity: 90.4%), 2-(15N)amino-3-[(trichloroethenyl)sulfanyl](13C3)propanoic acid (TCVC*, purity: 97.5%), and 2-[acetyl(15N)amino]-3-[(trichloroethenyl)sulfanyl](13C3)propanoic acid (NAcTCVC*, purity: 99.0%) were used as internal standards (I.S.) for TCVG, TCVC, and NAcTCVC, respectively. TCVG (purity: 98.9%), TCVC (purity: 98.4%), and all stable isotopically-labeled I.S. were synthesized and provided by Dr. Avram Gold at the University of North Carolina, Chapel Hill, NC. Purity of the synthetized standards was determined using HPLC-UV/Vis (Thermo Fisher Scientific, Waltham, MA) detection in a full scan mode for the wavelength range from 190 to 600 nm followed by a detection at the wavelength set at 254 nm (Supplemental Figure S1). NAcTCVC (CAS:111348-61-9, reported purity: 99.7%) was obtained from Toronto Research Chemicals (Toronto, Canada).
2.2 Animals and treatments
Two studies were conducted to collect tissues for these experiments. Both used male C57Bl/6J mice (6–8 weeks of age) from the Jackson Laboratory (Bar Harbor, ME). Animals were acclimated for 1 week before treatments. All animal treatments and procedures were approved by the Institutional Animal Care and Use Committee at Texas A&M University.
In the first study, mice were dosed with 0, 100, 300, or 1000 mg/kg PERC (5 mL/kg in 5% alkamuls-EL620 in saline) via gavage (n=3/group). These doses were selected based on previous studies in mice that showed saturation of PERC oxidative metabolism at similar doses (Buben and O’Flaherty 1985, Philip et al. 2007); thus, it was determined whether GSH conjugation metabolism of PERC might be also saturable at these doses. In addition, this dose range was used in a chronic cancer bioassay via oral exposure to PERC in mice (National Toxicology Program 1977). Mice were euthanized two hours after gavage and blood and organs were snap-frozen for determination of metabolites. As no other study has examined PERC metabolism through the GSH pathway in vivo, the two hour time point was selected based on studies of toxicokinetics of the conjugative metabolites of trichloroethylene (Yoo et al. 2015, Bradford et al. 2011, Kim et al. 2009), a chemical which is structurally similar to PERC.
In the second study, to characterize the urinary excretion of the GSH conjugation metabolites of PERC, mice were intragastrically dosed with 10, 100, or 1000 mg/kg PERC in a vehicle detailed above and then housed in metabolic cages (Hatteras Instruments, Cary, North Carolina) for collection of urine into a chilled container over a 24 hr period (n=3 per group).
2.3 Tissue Processing
Serum (50 μL) was thawed on ice, spiked with 10 pmoles of each internal standard, and then mixed with 100 μL of methanol to precipitate protein. The sample was then vortexed and centrifuged (14,000 g, 5 min, 4°C). The supernatant was diluted with 850 μL of distilled deionized water prior to SPE (see Section 2.4). Liver or kidney (50 mg) was spiked with 10 pmoles of each internal standard, and then homogenized in 200 μL of methanol and 200 μL of chloroform using stainless steel beads in a Bead Ruptor 24 (Omni Inc, Kennesaw, GA) for 30 seconds at 4 m/s. Homogenates were centrifuged (10,000 g, 5 min, room temperature), the supernatant was vortexed with 1000 μL of water and centrifuged again (10,000 g, 5 min, room temperature). The supernatant was used for SPE (see Section 2.4). Urine (50 μL) was spiked with 10 pmoles of each internal standard, and then mixed with 100 μL of methanol for protein precipitation. The sample was then vortexed and centrifuged (10,000 g, 5 min, room temperature). The supernatant was diluted with 350 μL of ammonium formate buffer (15 mM, pH=7) for direct LC-MS/MS analysis without the use of SPE.
2.4 Solid Phase Extraction (SPE)
Strata-X-AW (cat no. 8E-SO38-TGB, sorbent lot no. S308-0066; Phenomenex, Torrance, CA) 96-well SPE cartridges were used to trap the anionic analytes. Cartridges were conditioned with 600 μL acidified methanol (0.1% acetic acid, v:v) and equilibrated with UPLC-grade water (600 μL), no vacuum was applied to the SPE manifold and reagents were allowed to flow through via gravity. Samples were then loaded onto cartridges and washed with 300 μL water. Analytes were eluted with 300 μL basified methanol (pH 10.8 via NH4OH) under gravity; at the end of the procedure, gentle vacuum (650 mBa) was applied to capture as much sample as possible. The entire eluent was transferred to a 1.5 mL microcentrifuge tube and was taken to dryness in vacuo; typically, an overnight drying was necessary in the vacuum concentrator at room temperature. The residue was reconstituted in 50 μL of water: methanol (80:20, v:v) containing 0.1% acetic acid and transferred to an autosampler vial. Samples were stored at or below −20°C prior to analysis.
2.5 UPLC parameters
Samples were maintained at 4°C in the auto-sample manager of a Waters Acquity H-class UPLC (Waters, Milford, MA) during analyses. Samples (10 μL) were automatically injected into the UPLC and were chromatographed on a ZORBAX SSHD Eclipse Plus C18 column (3.0×50 mm, 1.8 μm, cat no. 959757-302; Agilent, Santa Clara, CA) with a guard column (2.1×5 mm, 1.8 μm, cat no.821725-901; Agilent, Santa Clara, CA). For each sample analysis, initial chromatographic conditions were 80% solvent A (water with 0.1% formic acid) and 20% solvent B (methanol with 0.1% formic acid). Conditions were maintained from 0–1 min, then increased to 90% of solvent B by 3 mins, then to 98% of solvent B by 4 mins, then to 20% of solvent B by 4.2 mins. Then, 20% of solvent B was maintained until 7 mins to allow sufficient equilibration time prior to the next injection. Flow rate was maintained at 0.4 mL/min. Column temperature was controlled at 25°C.
2.6 MS/MS parameters
An Agilent 6470 triple-quadrupole mass-spectrometer was used for all analyses. To optimize the MS/MS parameters for each analyte, pure material was dissolved in mobile phase and directly injected (column off-line) into the MS at the flow rate of 0.5 mL/min (methanol:water, 50:50, v: v, containing 0.1% formic acid). The Optimizer Tool (MassHunter, ver. B.08.00) on the Agilent software was used to achieve optimization of the fragmentor, collision energy, cell accelerator voltage, and mass transition for each analyte. Capillary voltage, sheath gas pressure, sheath gas temperature, and capillary temperature were optimized manually along with real chromatographic condition (column in-line).
2.7 Method Validation
Matrix-matched calibration curves were prepared with serum, urine, liver, and kidney obtained from untreated mice. Blank serum (50 μl), urine (50 μl), liver (50 mg), or kidney (50 mg) was spiked with standards for TCVG, TCVC (both at 0, 0.25, 0.5, 1.25, 2.5, 6.25, 18.75, and 31.25 pmoles), and NAcTCVC (0, 0.5, 1.25, 2.5, 6.25, 18.75, and 31.25 pmoles). All standard solutions were also spiked with 10 pmoles of each internal standard. Quantitative analysis was achieved by using the peak area ratios of standards and internal standards.
Selectivity of the method was determined by using tissues obtained from six different animals. Sensitivity was defined as a limit of detection (LOD, the concentration with signal to noise ratio of 3), and a lower limit of quantification (LLOQ, the lowest concentration to be quantifiable at 20% of precision and accuracy). Sample to sample carry-over effect, as well as inter-channel cross talk were tested by using the highest concentration in the calibration curve.
Intra-day precision and accuracy (six injections per matrix and concentration) were evaluated by using serum, urine, liver, and kidney obtained from untreated mice spiked with TCVG, TCVC (both at 0.25, 2.5, and 25 pmoles), and NAcTCVC (2.5 and 25 pmoles). Inter-day precision and accuracy were further assessed in six consecutive days. Recovery (RE%), matrix effect (ME%), and process efficiency (PE%) were calculated as detailed elsewhere (Matuszewski et al. 2003).
Freeze and thaw stability, short-term stability, long-term stability, and on-tray stability of TCVG, TCVC, and NAcTCVC were evaluated by comparing peak areas of extracted samples before and after each test condition. Three freeze-thaw cycles at −20°C were applied to test the freeze and thaw stability. Samples were placed at room temperature for 4 h to evaluate short-term stability. For long-term stability, samples were stored at −20°C for 30 days. On-tray stability was evaluated at 4°C for 6 h. Stability of stock solutions was evaluated after they were placed at room temperature for 6 h.
2.8 Statistical analyses
GraphPad Prism (ver. 5, GraphPad Software, La Jolla, CA) was used to conduct one-way ANOVA and post-hoc tests. A p-value of less than 0.05 was considered significant in all analyses.
3. Results and discussion
3.1 Product ion transitions and MS/MS parameters
Product ion spectra of all standards were obtained in positive ion mode via direct injection without a column (Figure 1). The precursor ion (M+H)+ of TCVG is m/z 436, which is consistent with the chemical structure of TCVG and with previous reports (Dekant et al. 1998). Fragment ions of TCVG include m/z 307 by loss of trichloroethenyl moiety, m/z 290 by loss of γ-glutamyl moiety, and m/z 361 by loss of glycine moiety. The precursor ions for TCVC and NAcTCVC were determined experimentally. For TCVC, the precursor ion is m/z 250. Fragment ions of TCVC include m/z 233 by loss of an ammonium group, m/z 203.8 by loss of a carboxyl group, and m/z 160.8 by loss of a trichloroethenylthiol group. The precursor ion of NAcTCVC is m/z 292. Fragment ions include m/z 232.9 by loss of an acetylamine group, m/z 250 by loss of an acetyl group, and m/z 203.9 by loss of an acetyl and a carboxyl group. The quantifier and qualifier ion transitions of each analyte are summarized in Supplemental Table S1.
Figure 1. Product ion spectra of (A) TCVG (left) and TCVG* (right), (B) TCVC (left) and TCVC* (right), and (C) NAcTCVC (left) and NAcTCVC* (right).
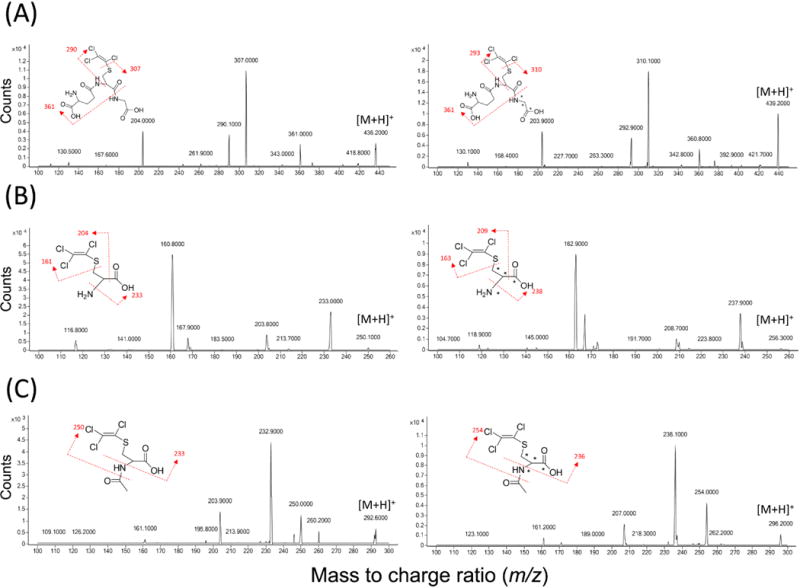
MS/MS spectra of standards and labeled standards (at 1 μM) were collected in positive ion mode. (A) The precursor ion (M+H+) of TCVG is m/z 436. Fragment ions of TCVG include m/z 307 (-C2Cl3), m/z 290 (-C5H9N2O3), and m/z 361(-C2H4NO2). (B) The precursor ion (M+H+) of TCVC is m/z 249.9. Fragment ions of TCVC include m/z 233 (-NH3), m/z 203.8 (-COOH), and m/z 160.8 (-C2Cl3S). (C) The precursor ion of NAcTCVC is m/z 291.9. Fragment ions include m/z 232.9 (-C2H4NO), m/z 250 (-C2H3O), and m/z 203.9 (-C2H3O and –COOH). TCVG*, TCVC*, and NAcTCVC* share the identical fragmentation with their corresponding unlabeled standard.
Considering the natural abundance of chlorine isotopes (35Cl, 37Cl), and the pattern of stable-isotope labelling of the all three internal standards, alternative ion transitions were selected to avoid cross-talk among channels. The ion transition of m/z 443→313.8, not m/z 439→310.1, was used as the quantifier of TCVG*. Likewise, m/z 295.9→235.8 ion transition was selected as the quantifier of NAcTCVC* because of its unique fragmentation (due to position of the stable-isotope labels) which can distinguish NAcTCVC* from NAcTCVC (m/z 295.9→236.8). There was no ion channel cross-talk effect observed for TCVC and TCVC*.
To avoid the interference from matrices, matrix-specific mass transitions were used for quantification of each analyte (Supplemental Table S1). In general, the most abundant mass transition of each compound was used as a quantifier. However, interferences were observed in quantifier channels of TCVC* (255.9→237.8) in serum. Therefore, m/z 255.9→162.9 was used as the quantifier of TCVC* specifically in serum. The quantifiers listed in Supplemental Table S1 show good selectivity of the method in liver, kidney, and urine.
3.2 Ionization parameters
Ionization parameters including capillary voltage, sheath gas temperature, drying gas temperature, and nebulizer gas pressure were optimized along with the chromatographic conditions (Supplemental Tables S2–S5). Given that efficient separation for TCVG, TCVC, and NAcTCVC was achieved, analytes were optimized individually. In the positive ion mode, the abundance of all three analytes was optimal with a capillary voltage of 3600V. Signal variation increased when sheath gas temperature was above 350°C. Drying gas temperature was optimal at 300°C. The increased variation and signal depression likely resulted from thermolysis of precursor ions. Optimization of nebulizer gas pressure showed that TCVC and TCVG need higher gas pressure for ionization.
3.3 Method validation
Figure 2 shows representative chromatograms of the analytes. Peaks of TCVC and TCVC*, TCVG and TCVG*, and NAcTCVC and NAcTCVC* co-eluted at 3.28, 3.58, and 4.04 min, respectively for each pair. Matrix-matched calibration curves were constructed for serum, urine, liver, and kidney (Figure 3). Slopes of calibration curves were similar across different matrices (CV<5%), demonstrating no inter-tissue matrix effects when stable isotope-labeled internal standards are employed. No sample-to-sample carryover effect was observed for TCVC analysis across tissues (data not shown). TCVG and NAcTCVC showed minimal sample-to-sample carryover (TCVG <0.22 % and NAcTCVC <1% at 6.25 pmoles of each metabolite on column).
Figure 2. Representative LC-MS/MS chromatogram for (A) standards and (B) internal standards of TCVG, TCVC, and NAcTCVC in liver.
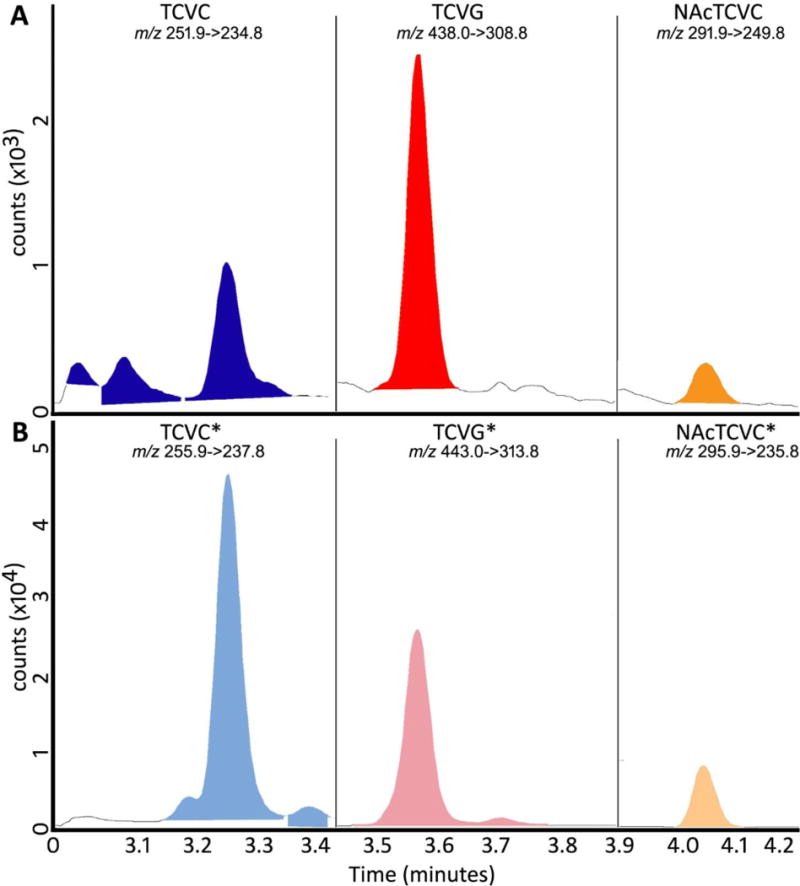
The spiked amount on-column was 0.025 pmoles for TCVG and TCVC, 0.05 pmoles for NAcTCVC, and 2 pmoles for TCVG*, TCVC*, and NAcTCVC*.
Figure 3. Matrix matched calibration curves for (A) TCVG, (B) TCVC, and (C) NAcTCVC.
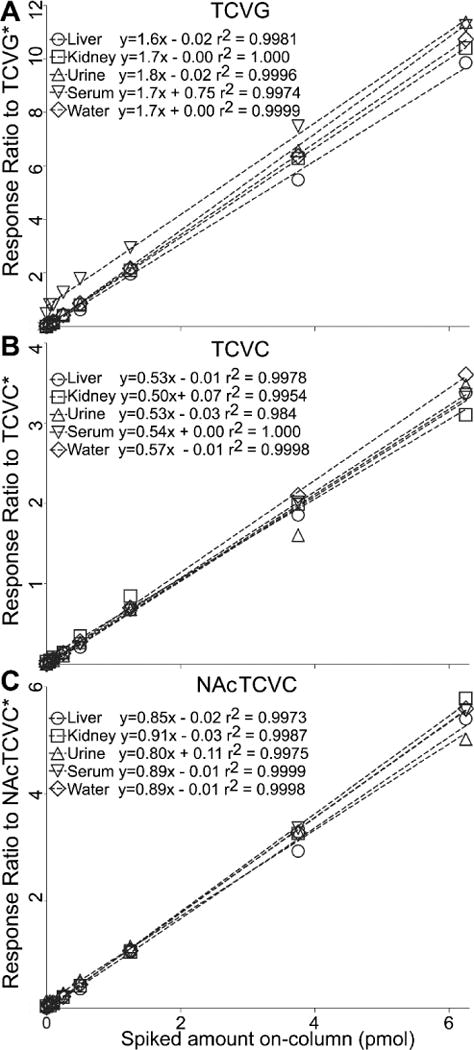
X axis, expected amount of spiked standards on column; y axis, peak area ratio of standard to internal standard.
The method described herein was highly sensitive for the analysis of TCVC, TCVG, and NAcTCVC across tissues and represents the first study to report on the method for TCVC in tissues (Table 1). As compared to previously published method for TCVG (Lash et al. 1998a), this method has about 104 lower LOD. Even though the sensitivity of NAcTCVC detection was reduced by applying positive, versus negative, electrospray ionization to achieve higher sensitivity of TCVG and TCVC, the sensitivity for urinary analysis of NAcTCVC is still superior to previously published methods (Bartels 1994, Volkel et al. 1999, Birner et al. 1996). Interestingly, the LOD of NAcTCVC in serum is 3–6 fold lower than that in other matrices, which probably results from the ion enhancement effect of NAcTCVC in serum (see Section 3.4).
Table 1.
Comparative analysis of LODs for TCVG, TCVC, and NAcTCVC between tissues and studies.
| Reference | Matrix | Extraction method* | Detect Method | TCVG† (fmole) |
TCVC (fmole) |
NAcTCVC (fmole) |
|---|---|---|---|---|---|---|
| This study | Liver | LL-SPE | LC-MS/MS | 4.5 | 22.7 | 31.3 |
| Kidney | 4.2 | 68.2 | 17.8 | |||
| Serum | PP-SPE | 3.4 | 9.4 | 5.4 | ||
| Urine | PP-Direct dilution | 13.5 | 22 | 26.3 | ||
| Instrumental LOD₸ |
|
2.1 | 1.8 | 14 | ||
|
| ||||||
| Bartels et al., 1994 | Urine | LL and derivatization with methanolic HCl | NICI-GC-MS/MS | N/R | N/R | 4 |
| Birner et al., 1996 | Urine | Derivatization with diethylether/diazomethane | GC-MS | N/R | N/R | 60,000 |
| Lash et al., 1998 | Hepatocyte | Derivatization with 1-fluoro-2,4-dinitrobenzene | HPLC-UV | 50,000 | N/R | N/R |
| Volkel et al., 1999 | Urine | LL and derivatization with methanolic BF3 | NICI-GC-MS | N/R | N/R | 20 |
Limit of detection (LOD) is defined as the tested concentration with the signal-to-noise ratio equals to 3, and expressed with the on-column amount of analyte. N/R: Not reported.
Instrumental LOD was tested in de-ionized water.
LL-SPE: liquid-liquid extraction coupled with SPE; PP-SPE: protein precipitation coupled with SPE.
3.4 Extraction recovery and matrix effect
Methanol:chloroform was selected as the homogenizing solution to standardize the extraction procedure in liver and kidney samples and because analyte recovery was significantly improved (Supplemental Figure S2). Serum was extracted by protein precipitation rather than liquid-liquid extraction to avoid sample loss. Urine was diluted with ammonium formate buffer to balance pH.
Recoveries and matrix effects of TCVG, TCVC, and NAcTCVC varied at different tested concentrations and among tissues (Supplemental Tables S6–S9). The recovery of analytes was generally highest in urine and serum, and lowest in liver and kidney. Variability in recovery was observed, which may have been a consequence of experimental error in the liquid-liquid or solid-phase extraction steps, or may be a result of differential composition among matrices. Overall, there was negligible matrix effect, except in urine where appreciable concentration-dependent ion suppression or enhancement was observed (Table 2). Despite these matrix effects, the use of stable isotope-labeled internal standards permitted accurate and precise quantitation (see Section 3.5).
Table 2.
Comparative analysis of method performance of TCVG, TCVC, and NAcTCVC in multiple tissues
| Liver | Kidney | Serum | Urine | ||||||||||||
|---|---|---|---|---|---|---|---|---|---|---|---|---|---|---|---|
|
|
|||||||||||||||
| TCVG | TCVC | NAcTCVC | TCVG | TCVC | NAcTCVC | TCVG | TCVC | NAcTCVC | TCVG | TCVC | NAcTCVC | ||||
| RE(%)† | 50 | 32 | 58 | 53 | 43 | 60 | 56 | 43 | 68 | 81 | 91 | 102 | |||
| ME(%) | 115 | 100 | 91 | 107 | 102 | 85 | 90 | 94 | 110 | 126 | 91 | 105 | |||
| PE(%) | 57 | 32 | 53 | 57 | 44 | 51 | 51 | 40 | 74 | 102 | 83 | 107 | |||
|
| |||||||||||||||
| Intra-day₸ | Accuracy(%) | −2.5 | −0.1 | +1.0 | +11.5 | +3.2 | +6.5 | +0.8 | +1.3 | +8.6 | +1.2 | +5.9 | +4.9 | ||
| Precision(%) | 5.5 | 3.4 | 11.6 | 9.8 | 6.9 | 10.0 | 6.1 | 2.9 | 10.8 | 5.4 | 10.9 | 19.9 | |||
| Inter-day | Accuracy(%) | −3.2 | −2.7 | +0.5 | −1.5 | +2.3 | −8.1 | +4.9 | −0.8 | +2.2 | +6.0 | +5.0 | +17.7 | ||
| Precision(%) | 10.3 | 1.7 | 9.0 | 2 | 3.3 | 8.3 | 6.9 | 5.4 | 6.7 | 4.7 | 18.0 | 7.6 | |||
|
| |||||||||||||||
| On-tray stability (%)* | 102 ± 12 | 99 ± 6 | 104 ± 9 | 106 ± 1 | 105 ± 1 | 103 ± 1 | 102 ± 1 | 105 ± 1 | 104 ± 3 | 103 ± 3 | 101 ± 6 | 97 ± 11 | |||
| Short-term stability (%) | 106 ± 7 | 106 ± 5 | 108 ± 6 | 102 ± 1 | 101 ± 1 | 102 ± 2 | 101 ± 1 | 102 ± 1 | 98 ± 2 | 99 ± 3 | 101 ± 3 | 99 ± 6 | |||
| Long-term stability (%) | 98 ± 2 | 102 ± 3 | 114 ± 4 | 102 ± 2 | 101 ± 6 | 99 ± 2 | 100 ± 6 | 98 ± 2 | 99 ± 3 | 107 ± 6 | 53 ± 8 | 102 ± 85 | |||
| Freeze-thaw stability (%) | 102 ± 2 | 98 ± 3 | 88 ± 3 | 98 ± 2 | 99 ± 6 | 101 ± 2 | 100 ± 6 | 102 ± 2 | 101 ± 3 | 94 ± 5 | 193 ±31 | 301 ± 396 | |||
Method validation for analysis of TCVG, TCVC, and NAcTCVC was compared at level of 50 pmole/g tissue or mL serum across different tissues. Recovery (RE), matrix effect (ME), and process efficiency (PE) were determined from n=5.
Inter-day (n=6) and intra-day (n=6) accuracy (%) are expressed as bias deviated from the nominal concentration. Precision (%) is expressed as relative standard deviation.
Results of stabilities are expressed in average ± standard deviation (n=3).
3.5 Inter- and intra-day accuracy and precision
Inter-day accuracy and precision were further evaluated across six different days; intra-day accuracy and precision were assessed by using six biological replicates in the same day. Our results show that this method is accurate (bias <15%) and reliable (precision <15%) for analysis of TCVG, TCVC, and NAcTCVC in liver, kidney, and serum (Table 2, Supplemental Tables S6–S9). Urinary analysis of NAcTCVC exhibited slightly higher variability; however, it still passed the criteria for determining the LLOQ (accuracy and precision <20%). The inferior performance of NAcTCVC is not surprising because this method is operated in positive ion mode, which is optimized for TCVG and TCVC, but not for NAcTCVC. Also, some blank urine samples had background levels of NAcTCVC, which may also introduce the variability into urinary analysis of NAcTCVC.
3.6 Analyte stability
Stock solutions and extracted samples were evaluated with respect to the stability of TCVG, TCVC, and NAcTCVC under various storage conditions. Stock solutions were stable at room temperature for up to 6 hours (data not shown). Analytes were stable in liver, kidney, and serum when evaluated for the on-tray, short-term, long-term, and freeze-thaw conditions (Table 2). Results in urine show that TCVC and NAcTCVC are unstable for long-term storage at −20°C or three freeze and thaw cycles. However, analytes in extracted urine samples are considered stable on-tray or for short-term storage. Thereby, long-term storage and repeated freeze and thaw cycles should be avoided for analysis of these analytes in urine samples.
3.7 Application to toxicokinetic profiling of PERC in vivo
Next, this method was applied to quantitate TCVG, TCVC, and NAcTCVC in multiple tissues of PERC-exposed mice. First a study was conducted where mice were treated with a single dose of PERC (100, 300, or 1000 mg/kg) and euthanized 2 hrs after oral gavage. Tissue levels of analytes demonstrated a dose-dependent increase with ascending dose of PERC (Figure 4). Levels of all three metabolites varied across tissues in a metabolite-specific manner. For instance, in mice treated with 1000 mg/kg PERC, TCVG level was 16.7-fold higher in liver as compared to that in kidney or serum. TCVC level in kidney was higher than that in liver (18.3-fold) or serum (2.1-fold). Likewise, NAcTCVC level in urine was higher than that in liver (1.7-fold), kidney (13.7-fold), and serum (4.6-fold) (Figure 5A).
Figure 4. Dose-response relationships of (A) TCVG, (B) TCVC, and (C) NAcTCVC in liver, kidney, and serum of mice treated with PERC (n=3 for each dose as indicated in the inset).
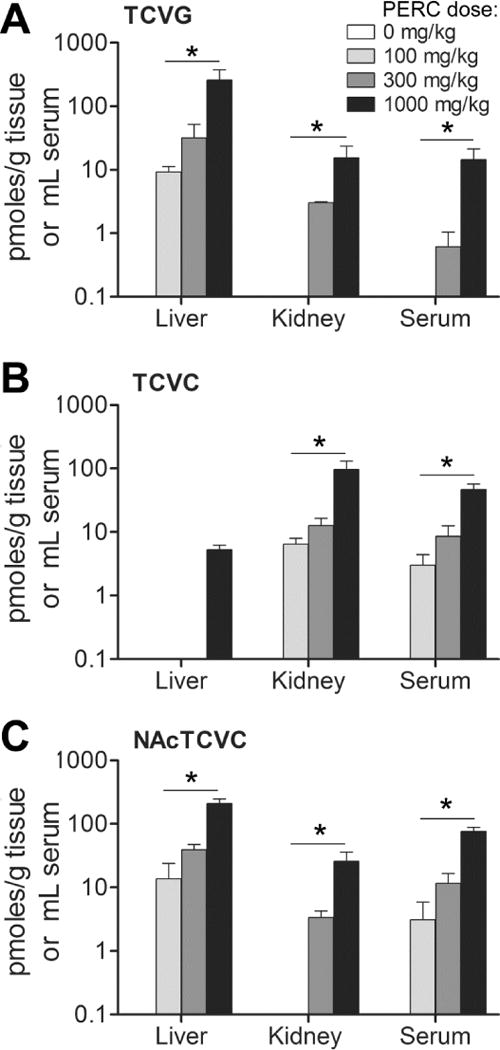
Data shown are group means with standard deviations. The significance of dose-response relationships in each tissue was tested by one-way ANOVA and post-hoc test for a linear trend (*, p<0.05). The lack of a bar indicates that an analyte was below the limit of quantitation.
Figure 5. Analysis of TCVG, TCVC, and NAcTCVC in urine of PERC-treated mice at (A) 2 hrs or (B) 24 hrs after dosing.

Data shown are group means with standard deviations. The significance of the dose-response relationship was tested by one-way ANOVA and post-hoc test for a linear trend (*, p<0.05). The lack of a bar indicates that an analyte was below the limit of quantitation.
The observed differences in metabolite levels across different tissues are consistent with PERC metabolism pathways. GSH conjugation of PERC and other chemicals predominantly occurs in liver because of the high activity of GSH S-transferases (Moron et al. 1979). Renal GGT and dipeptidase activity is responsible for high levels of TCVC in kidney (Griffith and Meister 1979). Also, the reabsorption of cysteine S-conjugates, as demonstrated in rat kidney (Heuner et al. 1991) and LLC-PK1 cells (Schaeffer and Stevens 1987), and the deacetylation of NAcTCVC that is catalyzed by renal aminoacylase (Uttamsingh et al. 1998) can also contribute to the high levels of TCVC in kidney. Interestingly, large quantities of NAcTCVC were found in liver even though the activity of gamma-glutamyl transpeptidase is approximately one-fifth of that in kidney (Whitfield 2001). Intrahepatic conversion of GSH conjugates to mercapturic acids by N-acetyltransferase activity has been reported in rat and guinea pig livers (Hinchman et al. 1991), which could account for the generation of NAcTCVC in liver. Further mechanistic investigation on the fate of PERC conjugative metabolites in vivo is possible using this method.
Next, urinary levels of NAcTCVC were quantified in mice treated with PERC (10, 100, or 1000 mg/kg) (Figure 5B). Our results demonstrate that NAcTCVC is a major conjugative metabolite (~98% of combined amount of TCVG, TCVC, and NAcTCVC) excreted in urine. This is not surprising because the renal transport systems favor reabsorption of amino acids, but excretion of mercapturates. Our method is able to profile urinary levels of NAcTCVC in mice treated with as little as 10 mg/kg PERC (46.8±9.1 pmol/mLurine, approximately 100 pmoles total) using only 50 μL of sample volume. In a previous study, rats and humans exposed to 10 ppm PERC by inhalation for 6 h excreted (24 hr urine collection) ~500 pmol and 40 nmol of NAcTCVC, respectively (Volkel et al. 1998). Therefore, our method should be sufficiently sensitive for detection of urinary NAcTCVC in PERC-exposed animals and humans.
The sensitivity of our method also allowed us to demonstrate the linear dose-dependent increase of NAcTCVC, which suggests that the conjugative metabolism of PERC remains unsaturated at doses up to 1000 mg/kg. Lack of saturation of the GSH conjugation metabolism pathway of PERC is noteworthy because the oxidative metabolism is saturable above 100 mg/kg (Philip et al. 2007) and may reflect the small overall flux of PERC through conjugation in mice.
3.8 Conclusions
Metabolism of PERC is qualitatively similar in humans and rodents, although quantitative differences do exist (Cichocki et al. 2016). These quantitative differences in metabolism may be important for extrapolation of data derived from rodents to human health assessments for PERC.
It is now assumed that flux of PERC through conjugative pathways is minimal as compared to oxidative pathways; these assumptions are largely based on the data for trichloroethylene and quantification of urinary NAcTCVC and oxidative PERC metabolites in PERC-exposed humans and laboratory rodents (Birner et al. 1996, Bartels 1994, Volkel et al. 1999). However, urinary NAcTCVC may represent only a fraction of the overall flux of PERC through GSH conjugation (IARC 2014).
Little is known about PERC conjugative metabolism in vivo due to the lack of a sensitive analytical assays; to our knowledge, no previously published method for analysis of multiple PERC conjugative metabolites exists. To address these critical gaps in our knowledge of PERC toxicity, a rapid, sensitive, and robust UPLC-ESI+-MS/MS method was developed. For the first time, quantitative data for levels of TCVG, TCVC, and NAcTCVC in multiple mouse tissues after exposure to PERC is reported. This method has a limit of quantitation of 1–2.5, 1–10, 1–2.5, and 2.5–5 pmol/mL in liver, kidney, serum, and urine, respectively, while maintaining selectivity of the method and a short duration of analysis.
Successful quantitation of PERC GSH metabolites was achieved in all tissues tested despite small amounts of starting material. TCVC and TCVG can be detected and quantified in animals that were dosed with 100 mg/kg or more of PERC, while NAcTCVC is quantifiable in the urine of animals that were dosed with as little as 10 mg/kg of PERC. The range of doses used in this study is well within the range of doses used in PERC rodent cancer bioassays and other animal studies. Thus, the method and data provide important information for interpreting the findings from cancer bioassays in rodents. In addition, it is important to note that this method may have utility for the internal dosimetry of conjugative metabolites in studies of occupational and even environmental exposures in humans because PBPK modeling shows that the PERC fraction conjugated via GSH pathway may be 100 to 1000 fold higher in humans than in mice (Chiu and Ginsberg 2011).
One important limitation of this method, however, is its focus on proximal metabolites of the GSH conjugation pathway and not on some of the more reactive and toxic downstream metabolites such as TCVC sulfoxide (Elfarra and Krause 2007). Still, the method reported herein will be applicable to further toxicokinetic studies of PERC and inform human health assessments of this ubiquitous environmental toxicant.
Supplementary Material
Acknowledgments
J.A.C. was a recipient of a National Research Service Award through the National Institutes of Health (F32 ES026005). This work was supported, in part, by a cooperative agreement STAR RD83561202 from US EPA to Texas A&M University. The views expressed in this paper are those of the authors and do not necessarily reflect the views or policies of NIH or EPA. The authors express their gratitude to Dr. Avram Gold from the Department of Environmental Sciences and Engineering, University of North Carolina at Chapel Hill for providing chemical standards and to Drs. Terry Wade and Anthony Knap from the Geochemical Environmental Research Group at Texas A&M University for assistance with analytical instrumentation.
Abbreviations
- DCVC
S-(1,2-dichlorovinyl)-L-cysteine
- DCVG
S-(1,2-dichlorovinyl)-glutathione
- GSH
Glutathione
- GST
Glutathione-S-Transferase
- NAcTCVC
N-acetyl-S-(1,2,2-trichlorovinyl)-L-cysteine
- PERC
Tetrachloroethylene
- TCA
Trichloroacetate
- TCVC
S-(1,2,2-trichlorovinyl)-L-cysteine
- TCVG
S-(1,2,2-trichlorovinyl) glutathione
References
- Bartels MJ. Quantitation of the tetrachloroethylene metabolite N-acetyl-S-(trichlorovinyl)cysteine in rat urine via negative ion chemical ionization gas chromatography/tandem mass spectrometry. Biol Mass Spectrom. 1994;23(11):689–94. doi: 10.1002/bms.1200231107. [DOI] [PubMed] [Google Scholar]
- Birner G, Bernauer U, Werner M, Dekant W. Biotransformation, excretion and nephrotoxicity of haloalkene-derived cysteine S-conjugates. Arch Toxicol. 1997;72(1):1–8. doi: 10.1007/s002040050461. [DOI] [PubMed] [Google Scholar]
- Birner G, Rutkowska A, Dekant W. N-acetyl-S-(1,2,2-trichlorovinyl)-L-cysteine and 2,2,2-trichloroethanol: two novel metabolites of tetrachloroethene in humans after occupational exposure. Drug Metab Dispos. 1996;24(1):41–8. [PubMed] [Google Scholar]
- Bradford BU, Lock EF, Kosyk O, Kim S, Uehara T, Harbourt D, DeSimone M, Threadgill DW, Tryndyak V, Pogribny IP, Bleyle L, Koop DR, Rusyn I. Interstrain differences in the liver effects of trichloroethylene in a multistrain panel of inbred mice. Toxicol Sci. 2011;120(1):206–17. doi: 10.1093/toxsci/kfq362. [DOI] [PMC free article] [PubMed] [Google Scholar]
- Buben JA, O’Flaherty EJ. Delineation of the role of metabolism in the hepatotoxicity of trichloroethylene and perchloroethylene: a dose-effect study. Toxicol Appl Pharmacol. 1985;78(1):105–22. doi: 10.1016/0041-008x(85)90310-2. [DOI] [PubMed] [Google Scholar]
- Chiu WA, Ginsberg GL. Development and evaluation of a harmonized physiologically based pharmacokinetic (PBPK) model for perchloroethylene toxicokinetics in mice, rats, and humans. Toxicol Appl Pharmacol. 2011;253(3):203–34. doi: 10.1016/j.taap.2011.03.020. [DOI] [PubMed] [Google Scholar]
- Cichocki JA, Guyton KZ, Guha N, Chiu WA, Rusyn I, Lash LH. Target Organ Metabolism, Toxicity, and Mechanisms of Trichloroethylene and Perchloroethylene: Key Similarities, Differences, and Data Gaps. J Pharmacol Exp Ther. 2016;359(1):110–23. doi: 10.1124/jpet.116.232629. [DOI] [PMC free article] [PubMed] [Google Scholar]
- Dekant W. Bioactivation of nephrotoxins and renal carcinogens by glutathione S-conjugate formation. Toxicol Lett. 1993;67(1–3):151–60. doi: 10.1016/0378-4274(93)90052-y. [DOI] [PubMed] [Google Scholar]
- Dekant W, Birner G, Werner M, Parker J. Glutathione conjugation of perchloroethene in subcellular fractions from rodent and human liver and kidney. Chem Biol Interact. 1998;116(1–2):31–43. doi: 10.1016/s0009-2797(98)00077-5. [DOI] [PubMed] [Google Scholar]
- Elfarra AA, Krause RJ. S-(1,2,2-trichlorovinyl)-L-cysteine sulfoxide, a reactive metabolite of S-(1,2,2-Trichlorovinyl)-L-cysteine formed in rat liver and kidney microsomes, is a potent nephrotoxicant. J Pharmacol Exp Ther. 2007;321(3):1095–101. doi: 10.1124/jpet.107.120444. [DOI] [PubMed] [Google Scholar]
- Griffith OW, Meister A. Glutathione: interorgan translocation, turnover, and metabolism. Proc Natl Acad Sci U S A. 1979;76(11):5606–10. doi: 10.1073/pnas.76.11.5606. [DOI] [PMC free article] [PubMed] [Google Scholar]
- Guyton KZ, Hogan KA, Scott CS, Cooper GS, Bale AS, Kopylev L, Barone S, Makris SL, Glenn B, Subramaniam RP, Gwinn MR, Dzubow RC, Chiu WA. Human health effects of tetrachloroethylene: key findings and scientific issues. Environ Health Perspect. 2014;122(4):325–34. doi: 10.1289/ehp.1307359. [DOI] [PMC free article] [PubMed] [Google Scholar]
- Heuner A, Dekant W, Schwegler JS, Silbernagl S. Localization and capacity of the last step of mercapturic acid biosynthesis and the reabsorption and acetylation of cysteine S-conjugates in the rat kidney. Pflugers Arch. 1991;417(5):523–7. doi: 10.1007/BF00370949. [DOI] [PubMed] [Google Scholar]
- Hinchman CA, Matsumoto H, Simmons TW, Ballatori N. Intrahepatic conversion of a glutathione conjugate to its mercapturic acid. Metabolism of 1-chloro-2,4-dinitrobenzene in isolated perfused rat and guinea pig livers. J Biol Chem. 1991;266(33):22179–85. [PubMed] [Google Scholar]
- IARC. IARC Monographs on the Evaluation of Carcinogenic Risks to Humans (Vol 106) Trichloroethylene, Tetrachloroethylene and Some Other Chlorinated Agents. 2014. p. 106. [PMC free article] [PubMed] [Google Scholar]
- Irving RM, Elfarra AA. Mutagenicity of the cysteine S-conjugate sulfoxides of trichloroethylene and tetrachloroethylene in the Ames test. Toxicology. 2013;306C:157–161. doi: 10.1016/j.tox.2013.02.003. [DOI] [PMC free article] [PubMed] [Google Scholar]
- Kim S, Kim D, Pollack GM, Collins LB, Rusyn I. Pharmacokinetic analysis of trichloroethylene metabolism in male B6C3F1 mice: Formation and disposition of trichloroacetic acid, dichloroacetic acid, S-(1,2-dichlorovinyl)glutathione and S-(1,2-dichlorovinyl)-L-cysteine. Toxicol Appl Pharmacol. 2009;238(1):90–9. doi: 10.1016/j.taap.2009.04.019. [DOI] [PMC free article] [PubMed] [Google Scholar]
- Lash LH, Parker JC. Hepatic and renal toxicities associated with perchloroethylene. Pharmacol Rev. 2001;53(2):177–208. [PubMed] [Google Scholar]
- Lash LH, Qian W, Putt DA, Desai K, Elfarra AA, Sicuri AR, Parker JC. Glutathione conjugation of perchloroethylene in rats and mice in vitro: sex-, species-, and tissue-dependent differences. Toxicol Appl Pharmacol. 1998a;150(1):49–57. doi: 10.1006/taap.1998.8402. [DOI] [PubMed] [Google Scholar]
- Lash LH, Qian W, Putt DA, Hueni SE, Elfarra AA, Sicuri AR, Parker JC. Renal toxicity of perchloroethylene and S-(1,2,2-trichlorovinyl)glutathione in rats and mice: sex- and species-dependent differences. Toxicol Appl Pharmacol. 2002;179(3):163–71. doi: 10.1006/taap.2001.9358. [DOI] [PubMed] [Google Scholar]
- Lash LH, Qian W, Putt DA, Jacobs K, Elfarra AA, Krause RJ, Parker JC. Glutathione conjugation of trichloroethylene in rats and mice: sex-, species-, and tissue-dependent differences. Drug Metab Dispos. 1998b;26(1):12–9. [PubMed] [Google Scholar]
- Matuszewski BK, Constanzer ML, Chavez-Eng CM. Strategies for the assessment of matrix effect in quantitative bioanalytical methods based on HPLC-MS/MS. Anal Chem. 2003;75(13):3019–30. doi: 10.1021/ac020361s. [DOI] [PubMed] [Google Scholar]
- Moron MS, Depierre JW, Mannervik B. Levels of glutathione, glutathione reductase and glutathione S-transferase activities in rat lung and liver. Biochim Biophys Acta. 1979;582(1):67–78. doi: 10.1016/0304-4165(79)90289-7. [DOI] [PubMed] [Google Scholar]
- National Research Council. Review of the Environmental Protection Agency’s Draft IRIS Assessment of Tetrachloroethylene. Washington, DC: The National Academies Press; 2010. [PubMed] [Google Scholar]
- National Toxicology Program. Bioassay of tetrachloroethylene for possible carcinogenicity. Natl Cancer Inst Carcinog Tech Rep Ser. 1977;13:1–83. [PubMed] [Google Scholar]
- Philip BK, Mumtaz MM, Latendresse JR, Mehendale HM. Impact of repeated exposure on toxicity of perchloroethylene in Swiss Webster mice. Toxicology. 2007;232(1–2):1–14. doi: 10.1016/j.tox.2006.12.018. [DOI] [PubMed] [Google Scholar]
- Ripp SL, Overby LH, Philpot RM, Elfarra AA. Oxidation of cysteine S-conjugates by rabbit liver microsomes and cDNA-expressed flavin-containing mono-oxygenases: studies with S-(1,2-dichlorovinyl)-L-cysteine, S-(1,2,2-trichlorovinyl)-L-cysteine, S-allyl-L-cysteine, and S-benzyl-L-cysteine. Mol Pharmacol. 1997;51(3):507–15. [PubMed] [Google Scholar]
- Schaeffer VH, Stevens JL. The transport of S-cysteine conjugates in LLC-PK1 cells and its role in toxicity. Mol Pharmacol. 1987;31(5):506–12. [PubMed] [Google Scholar]
- U.S. EPA. Toxicological Review of Tetrachloroethylene (CAS No. 127-18-4): In Support of Summary Information on the Integrated Risk Information System (IRIS) Washington, DC: U.S. Environmental Protection Agency; 2011. [Google Scholar]
- Uttamsingh V, Keller DA, Anders MW. Acylase I-catalyzed deacetylation of N-acetyl-L-cysteine and S-alkyl-N-acetyl-L-cysteines. Chem Res Toxicol. 1998;11(7):800–9. doi: 10.1021/tx980018b. [DOI] [PubMed] [Google Scholar]
- Vamvakas S, Dekant W, Henschler D. Assessment of unscheduled DNA synthesis in a cultured line of renal epithelial cells exposed to cysteine S-conjugates of haloalkenes and haloalkanes. Mutat Res. 1989a;222(4):329–35. doi: 10.1016/0165-1218(89)90108-0. [DOI] [PubMed] [Google Scholar]
- Vamvakas S, Herkenhoff M, Dekant W, Henschler D. Mutagenicity of tetrachloroethene in the Ames test–metabolic activation by conjugation with glutathione. J Biochem Toxicol. 1989b;4(1):21–7. doi: 10.1002/jbt.2570040105. [DOI] [PubMed] [Google Scholar]
- Volkel W, Friedewald M, Lederer E, Pahler A, Parker J, Dekant W. Biotransformation of perchloroethene: dose-dependent excretion of trichloroacetic acid, dichloroacetic acid, and N-acetyl-S-(trichlorovinyl)-L-cysteine in rats and humans after inhalation. Toxicol Appl Pharmacol. 1998;153(1):20–7. doi: 10.1006/taap.1998.8548. [DOI] [PubMed] [Google Scholar]
- Volkel W, Pahler A, Dekant W. Gas chromatography-negative ion chemical ionization mass spectrometry as a powerful tool for the detection of mercapturic acids and DNA and protein adducts as biomarkers of exposure to halogenated olefins. J Chromatogr A. 1999;847(1–2):35–46. doi: 10.1016/s0021-9673(99)00022-9. [DOI] [PubMed] [Google Scholar]
- Whitfield JB. Gamma glutamyl transferase. Crit Rev Clin Lab Sci. 2001;38(4):263–355. doi: 10.1080/20014091084227. [DOI] [PubMed] [Google Scholar]
- Yoo HS, Bradford BU, Kosyk O, Uehara T, Shymonyak S, Collins LB, Bodnar WM, Ball LM, Gold A, Rusyn I. Comparative analysis of the relationship between trichloroethylene metabolism and tissue-specific toxicity among inbred mouse strains: kidney effects. J Toxicol Environ Health A. 2015;78(1):32–49. doi: 10.1080/15287394.2015.958418. [DOI] [PMC free article] [PubMed] [Google Scholar]
Associated Data
This section collects any data citations, data availability statements, or supplementary materials included in this article.